


The Big Idea
Gauging supply and demand in the labor market
Stephen Stanley | December 10, 2021
This document is intended for institutional investors and is not subject to all of the independence and disclosure standards applicable to debt research reports prepared for retail investors. This material does not constitute research.
Firms across the economy complain of an intense labor shortage, which has led to a sharp acceleration in wages. The household survey of the November employment report coupled with the October JOLTS release updates the state of the labor market. It looks like we are not quite at full employment yet but getting close and appear poised to blow past that benchmark next year.
Measuring labor supply
Fed officials set a benchmark last year for reaching full employment. They wanted to see employment and labor force participation return to February 2020 levels. Hitting that target for participation looks increasingly unlikely, as millions of people retired early and many others that left the job market have been slow to return. The unemployment rate has plunged to 4.2% as of last month, close to the FOMC’s estimate of the 4.0% rate consistent with full employment. However, a narrow definition of unemployment alone is not sufficient to fully describe the supply side of the labor market, especially when there is so much uncertainty about how many people may yet return from the sidelines to the job search process.
In the household survey results, those who were not employed and failed to actively search for work are considered to be out of the labor force. Of that group, most are quite settled, perhaps retired, raising children, taking care of a relative or friend, or physically unable to work. The household survey asks those not in the labor force more about their status. These questions result in a series titled “Not in the labor force, want a job now.” These people consider themselves ready to work but, for whatever reason, failed to actively look during the most recent survey period. Perhaps they were sick, or had car trouble, or had visitors in town. Or, in normal economic times, they might not have looked simply because they figured nothing was available. That latter explanation seems less broadly applicable in the current environment, when job openings are ubiquitous, but there are still many people who say that they failed to look due to discouragement each month.
In any case, if we combine those characterized as unemployed with those not in the labor force but want a job, we can create a broader measure of the pool of available workers. As of November, the pool of available workers had dropped to 12.7 million, about 2 million higher than in February 2020 split relatively evenly between the two components (Exhibit 1).
Exhibit 1: Pool of available workers
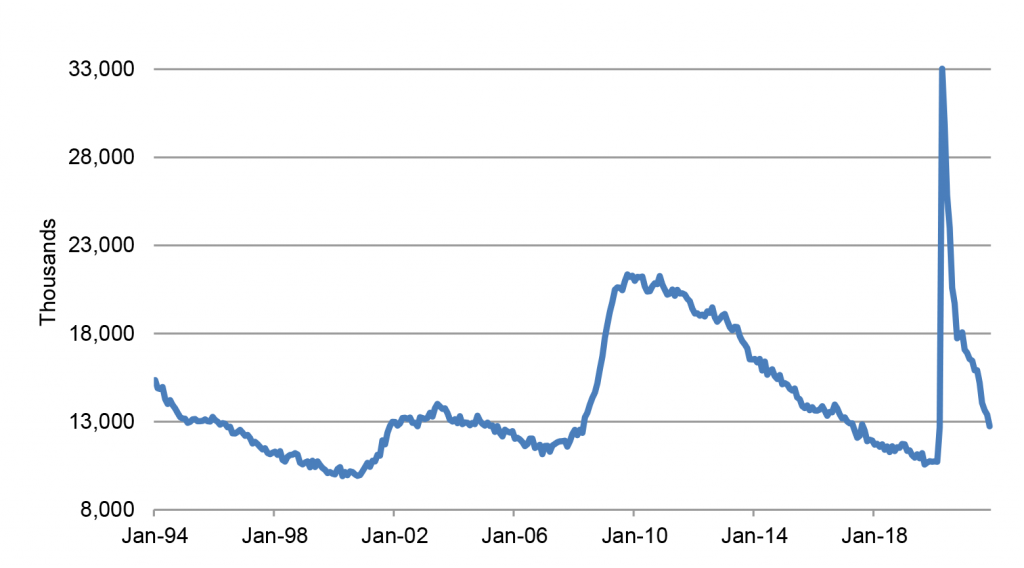
Source: BLS.
Fed officials might look at this series and conclude that the economy may be close to 2 million workers shy of full employment, but, as noted in earlier pieces, it is important to recall that the economy was likely operating beyond full employment just prior to the pandemic, even though inflation had not moved sharply higher yet. Still, if we take that 2 million figure as our benchmark, the November household survey employment gain of over 1 million offers a reminder that we are not far and can get there soon.
A slightly different way to examine the same concept is to create an alternative unemployment rate using the pool of available workers as the numerator and the labor force plus the “not in the labor, want a job” series as the denominator (Exhibit 2). As of November, the rate had dropped to 7.6%, over a percentage point higher than the February 2020 reading of 6.3%, which is the all-time low going back to 1994. Still, the rate slid by four tenths in November alone and has declined by roughly 1.5 percentage points over the past four months. So this broader metric is consistent with the idea that the economy could easily reach a broadly conceived estimate of full employment—incorporating not just unemployment but also those who are still sitting on the sidelines but likely to return to the work force soon—by early 2022.
Exhibit 2: Broader “unemployment rate”
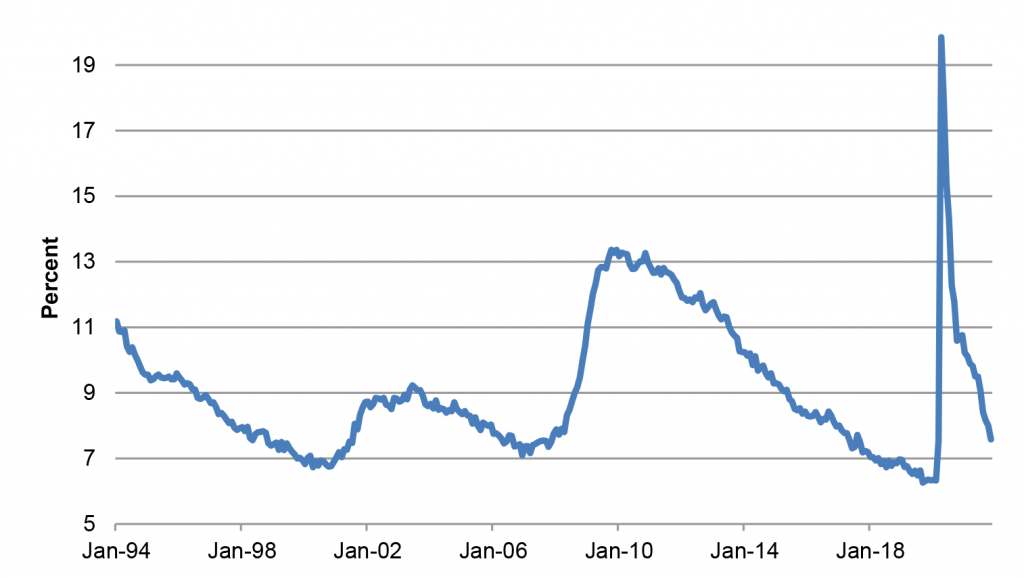
Source: BLS.
Weighing demand against supply
Economists sometimes talk about full employment as if it represents some sort of endpoint for the economy, as if once the economy achieves full employment, the game ends and everyone lives happily ever after. In reality, the economy can and does operate above full employment. Full employment represents the best that the economy can sustain indefinitely without overheating. However, the economy can move well beyond that point. As noted above, while inflation had not begun to increase much yet before the pandemic hit, various indicators of the labor market, including accelerating hourly wage increases, suggest that the economy was likely operating beyond full employment when Covid hit.
In any case, regardless of whether we pushed past full employment in 2019, there seems to be a good chance that we do so in 2022. One way to assess that would be to compare JOLTS job openings, as a gauge of the remaining unfulfilled demand for workers, with the pool of available workers.
Of course, it is well advertised that JOLTS job openings are at an all-time high. In fact, the October reading, at more than 11 million, is nearly 50% above the all-time pre-pandemic high. Looking at the pool of available workers minus JOLTS job openings (Exhibit 3). The smaller the number, the tighter the labor market. By this measure, the labor market is already significantly tighter than it was in 2018-2019 or any other time over the past 20 years. This further supports the projection that the labor market is likely to remain hot, even after those waiting on the sidelines return to the ranks of the employed.
Exhibit 3: Pool of available workers minus JOLTS job openings
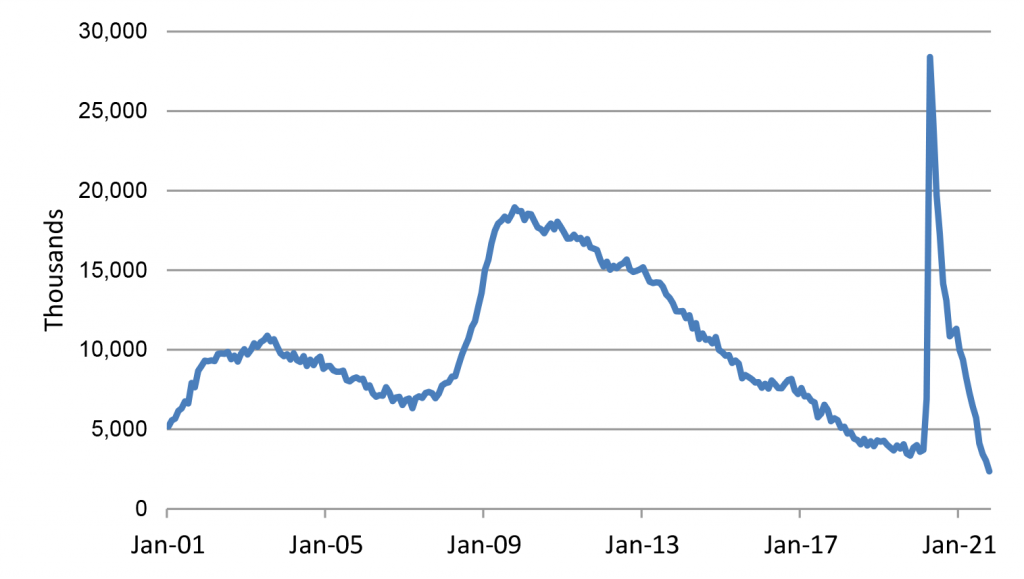
Source: BLS.
The pool of available workers net of JOLTS sank below 4 million for the first time in 2019 and registered, at that time, an all-time low of 3.6 million in January 2020. However, the October 2021 reading fell all the way to 2.4 million. Moreover, the pool of available workers dropped by more than 650,000 in November, so, if JOLTS job openings are roughly steady in November, the series will plunge to around 1.7 million, less than half of the pre-pandemic all-time low.
The November household survey results are a reminder that whatever remaining slack persists is likely to be absorbed quickly with demand for workers so strong. The labor force expanded by almost 600K in November, the largest monthly rise in over a year, but the household gauge of employment surged by nearly twice that amount. I suspect that this could be a regular feature going forward. Any time that more workers make themselves available, given the number of openings and the attractiveness of wage offers, they will be snapped up quickly.