By the Numbers
Higher loan limits will lower the convexity of TBA
This material is a Marketing Communication and does not constitute Independent Investment Research.
The value of TBA contracts should fall next year as larger loans start to make their way into MBS pools eligible for TBA delivery. The conforming loan limit will jump by 18% in 2022 to $647,200, an increase of nearly $100,000 from the current limit. This is the largest absolute increase on record and only the second double-digit percentage increase since the 1980s. TBA contracts could eventually lose between 3.5/32s and 7/32s of value, depending on the coupon, as TBA reprices to a rising share of the market in larger loans. Specified pool pay-ups should increase by similar amounts, of course. But higher pay-ups could allow originators to create new specified pool types, such as pools that contain loans no larger than $275,000.
After the limit increases in January, the larger loans will mostly come to market in multi- and single-issuer pools. Single-issuer pools can have an outsized impact on TBA pricing if there are enough of them and if they have distinct characteristics. Of pools that typically trade outside of the specified pool market, the supply of single-issuer paper has dropped over the last few years (Exhibit 1). In 2018, 70.8% of balances outside of specified pools came to market in multiple-issuer pools and 29.2% in single-issuer. In 2021, that share grew to 87.3% in multi-issuer and 12.7% in single-issuer. The shift from bank to non-bank origination played a large role, as many non-banks preferred the liquidity and certainty of execution offered by the Fannie Mae and Freddie Mac cash window.
The share of single-issuer pools with average loan sizes larger than the multi-issuer pools has also fallen, from 18.9% in 2018 to 8.0% in 2021. The table shows the average loan size for multiple issuer pools and the average loan size of only the pools with larger loan sizes. The difference was roughly $20,000 in 2021 ($389,000 − $369,759). These pools are likely some of the most negatively convex pools issued each month.
Exhibit 1. TBA pool balances typically increase by roughly 50% of the conforming limit increase
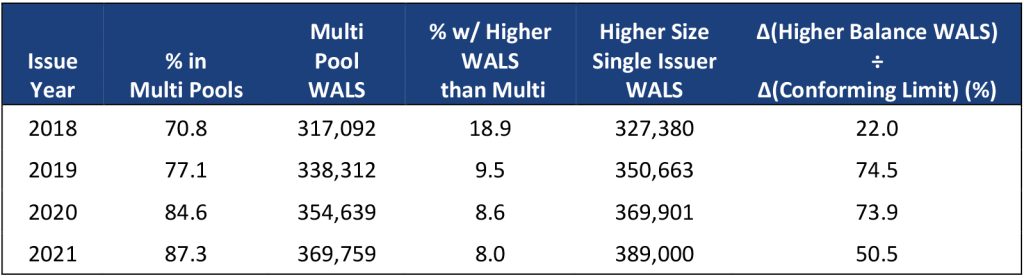
Population includes all non-specified pools. Multi pools include cash window and Major/swap pools. WALS is weighted average loan size. Higher balance pools are pools issued with a weighted average loan size greater than the multi pool weighted average loan size issued with the same coupon that month. The final column compares the increase in average loan size to the increase in conforming limit.
Source: Fannie Mae, eMBS, Amherst Pierpont Securities
The final column in the table shows how much the average loan size of the higher loan size pools increased each year as a percentage of the increase in the conforming limit. For example, the conforming limit increased from $510,400 in 2020 to $548,250 in 2021. The average loan size increased from $369,901 to $389,000, which was 50.5% of the increase in the conforming limit. Assuming the same pattern holds in 2022, these pools’ average loan size should grow by roughly $50,000. The multiple issuer pools’ average loan size should grow similarly.
Over time the TBA contract should reflect higher loan sizes and greater negative convexity and drop in value (Exhibit 2). The amount was estimated by choosing three multiple issuer pools issued this year that have seasoned to 7 WALA. These pools are used to proxy the TBA. The pools were first run through Yield Book at the TBA price with the loan size increased by $20,000 to account for the loan sizes of the most negatively convex pools. The pools were run a second time, using the OAS from the first run to calculate a price, but increasing the loan size an additional $50,000 to account for the effect of the loan limit increase. This shows that the pools price should drop from 3.5/32s to 7/32s, depending on the coupon.
Exhibit 2. Increasing average loan size by $50,000 lowers TBA prices up to 7/32s
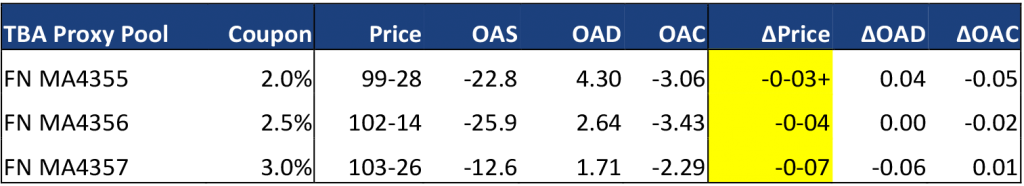
Source: Yield Book, Amherst Pierpont Securities
The drop in TBA value should manifest in higher pay-ups for all categories of specified pools. In other words, the specified pools maintain their intrinsic value while TBA drops. Originators are likely to find it attractive to start pooling some new pool types, such as pools with loans up to $275,000 or maybe even $300,000. In Ginnie Mae it should become easier for originators to make 100% FHA pools, especially since the multiple pools tend to have large VA concentrations.
This material is intended only for institutional investors and does not carry all of the independence and disclosure standards of retail debt research reports. In the preparation of this material, the author may have consulted or otherwise discussed the matters referenced herein with one or more of SCM’s trading desks, any of which may have accumulated or otherwise taken a position, long or short, in any of the financial instruments discussed in or related to this material. Further, SCM may act as a market maker or principal dealer and may have proprietary interests that differ or conflict with the recipient hereof, in connection with any financial instrument discussed in or related to this material.
This message, including any attachments or links contained herein, is subject to important disclaimers, conditions, and disclosures regarding Electronic Communications, which you can find at https://portfolio-strategy.apsec.com/sancap-disclaimers-and-disclosures.
Important Disclaimers
Copyright © 2026 Santander US Capital Markets LLC and its affiliates (“SCM”). All rights reserved. SCM is a member of FINRA and SIPC. This material is intended for limited distribution to institutions only and is not publicly available. Any unauthorized use or disclosure is prohibited.
In making this material available, SCM (i) is not providing any advice to the recipient, including, without limitation, any advice as to investment, legal, accounting, tax and financial matters, (ii) is not acting as an advisor or fiduciary in respect of the recipient, (iii) is not making any predictions or projections and (iv) intends that any recipient to which SCM has provided this material is an “institutional investor” (as defined under applicable law and regulation, including FINRA Rule 4512 and that this material will not be disseminated, in whole or part, to any third party by the recipient.
The author of this material is an economist, desk strategist or trader. In the preparation of this material, the author may have consulted or otherwise discussed the matters referenced herein with one or more of SCM’s trading desks, any of which may have accumulated or otherwise taken a position, long or short, in any of the financial instruments discussed in or related to this material. Further, SCM or any of its affiliates may act as a market maker or principal dealer and may have proprietary interests that differ or conflict with the recipient hereof, in connection with any financial instrument discussed in or related to this material.
This material (i) has been prepared for information purposes only and does not constitute a solicitation or an offer to buy or sell any securities, related investments or other financial instruments, (ii) is neither research, a “research report” as commonly understood under the securities laws and regulations promulgated thereunder nor the product of a research department, (iii) or parts thereof may have been obtained from various sources, the reliability of which has not been verified and cannot be guaranteed by SCM, (iv) should not be reproduced or disclosed to any other person, without SCM’s prior consent and (v) is not intended for distribution in any jurisdiction in which its distribution would be prohibited.
In connection with this material, SCM (i) makes no representation or warranties as to the appropriateness or reliance for use in any transaction or as to the permissibility or legality of any financial instrument in any jurisdiction, (ii) believes the information in this material to be reliable, has not independently verified such information and makes no representation, express or implied, with regard to the accuracy or completeness of such information, (iii) accepts no responsibility or liability as to any reliance placed, or investment decision made, on the basis of such information by the recipient and (iv) does not undertake, and disclaims any duty to undertake, to update or to revise the information contained in this material.
Unless otherwise stated, the views, opinions, forecasts, valuations, or estimates contained in this material are those solely of the author, as of the date of publication of this material, and are subject to change without notice. The recipient of this material should make an independent evaluation of this information and make such other investigations as the recipient considers necessary (including obtaining independent financial advice), before transacting in any financial market or instrument discussed in or related to this material.
Important disclaimers for clients in the EU and UK
This publication has been prepared by Trading Desk Strategists within the Sales and Trading functions of Santander US Capital Markets LLC (“SanCap”), the US registered broker-dealer of Santander Corporate & Investment Banking. This communication is distributed in the EEA by Banco Santander S.A., a credit institution registered in Spain and authorised and regulated by the Bank of Spain and the CNMV. Any EEA recipient of this communication that would like to affect any transaction in any security or issuer discussed herein should do so with Banco Santander S.A. or any of its affiliates (together “Santander”). This communication has been distributed in the UK by Banco Santander, S.A.’s London branch, authorised by the Bank of Spain and subject to regulatory oversight on certain matters by the Financial Conduct Authority (FCA) and the Prudential Regulation Authority (PRA).
The publication is intended for exclusive use for Professional Clients and Eligible Counterparties as defined by MiFID II and is not intended for use by retail customers or for any persons or entities in any jurisdictions or country where such distribution or use would be contrary to local law or regulation.
This material is not a product of Santander´s Research Team and does not constitute independent investment research. This is a marketing communication and may contain ¨investment recommendations¨ as defined by the Market Abuse Regulation 596/2014 ("MAR"). This publication has not been prepared in accordance with legal requirements designed to promote the independence of research and is not subject to any prohibition on dealing ahead of the dissemination of investment research. The author, date and time of the production of this publication are as indicated herein.
This publication does not constitute investment advice and may not be relied upon to form an investment decision, nor should it be construed as any offer to sell or issue or invitation to purchase, acquire or subscribe for any instruments referred herein. The publication has been prepared in good faith and based on information Santander considers reliable as of the date of publication, but Santander does not guarantee or represent, express or implied, that such information is accurate or complete. All estimates, forecasts and opinions are current as at the date of this publication and are subject to change without notice. Unless otherwise indicated, Santander does not intend to update this publication. The views and commentary in this publication may not be objective or independent of the interests of the Trading and Sales functions of Santander, who may be active participants in the markets, investments or strategies referred to herein and/or may receive compensation from investment banking and non-investment banking services from entities mentioned herein. Santander may trade as principal, make a market or hold positions in instruments (or related derivatives) and/or hold financial interest in entities discussed herein. Santander may provide market commentary or trading strategies to other clients or engage in transactions which may differ from views expressed herein. Santander may have acted upon the contents of this publication prior to you having received it.
This publication is intended for the exclusive use of the recipient and must not be reproduced, redistributed or transmitted, in whole or in part, without Santander’s consent. The recipient agrees to keep confidential at all times information contained herein.


