


By the Numbers
MBS Outlook 2022: A rise in expanded credit and non-QM lending
Chris Helwig | November 19, 2021
This material is a Marketing Communication and does not constitute Independent Investment Research.
Slightly higher rates, a growing agency footprint and recent tight lending standards may change the face of the private-label MBS market next year with a growing focus on expanded credit and non-QM lending. Next year may partly mirror pre-crisis changes to the private-label market as it finds its place between growing competition from Fannie Mae and Freddie Mac for larger prime mortgages and from the Federal Housing Administration for less creditworthy borrowers. This likely makes alternative documentation and near-prime lending the sweet spot for the private-label market next year.
Echoes from the early 2000s
The private-label market appears poised to change next year. An estimated 20% increase in agency conforming and jumbo conforming limits should increase the size of the GSE footprint, likely encroaching on prime private-label issuance while potentially increasing the amount of GSE CRT supply. Higher rates will likely further compress the spread between primary and secondary mortgage rates and subsequently narrow originators’ gain-on-sale for loans sold to the GSEs. That stands to prompt an increased focus on higher margin expanded credit lending, especially against the backdrop of a strong housing market and persistent, historically tight lending standards.
There is somewhat of an existing natural experiment showing the impact of higher rates on private-label issuance. Under the Greenspan Fed in the early 2000s, the Federal Reserve slashed target interest rates by 500 bp between 2001 and 2003 before beginning to hike in the summer of 2004. The precipitous decline in rates led to a previously unprecedented boom in refinancing that subsequently dried up as the Fed began to raise rates. And as rates rose, the contribution of prime loans to private-label issuance dipped while expanded credit lending increased substantially (Exhibit 1).
This is by no means to suggest that 2004 is a perfect corollary for the current market environment, but there are some striking similarities. First, the 2-year rate of home price appreciation is nearly identical to the rise in home values across 2003 and 2004. The 20-City Case Shiller Home Price Index rose by 27.5% from 2003 through 2004, with home prices rising by roughly the same amount over the past two years. Higher home valuations will likely have a more meaningful impact on the current private-label market as higher agency loan balances look to encroach on loans that otherwise would have been earmarked for private-label execution.
Additionally, the growth in the expanded credit market in 2004 was preceded by an overall tightening of credit conditions for mortgage lending. From 2002 to 2003 there was a steady rise in the share of banks reporting tighter underwriting standards for mortgage lending, according to the Fed’s Senior Loan Officer Opinion Survey, peaking at roughly 12% of respondents in the first quarter of 2003. There has been a comparable tightening in underwriting standards in the wake of the pandemic. Data from both the MBA’s Mortgage Credit Availability Index and the Fed Senior Loan Officer Opinion Survey show that that credit standards have tightened materially with the MBA Index declining from a level of 181 in February of last year to a current reading of 125 as of October. It seems plausible that the overall tightening of credit in both episodes should allow some latitude for expansion of the credit box and subsequent growth in expanded credit lending.
Exhibit 1: Higher rates should pave the way for more expanded credit lending
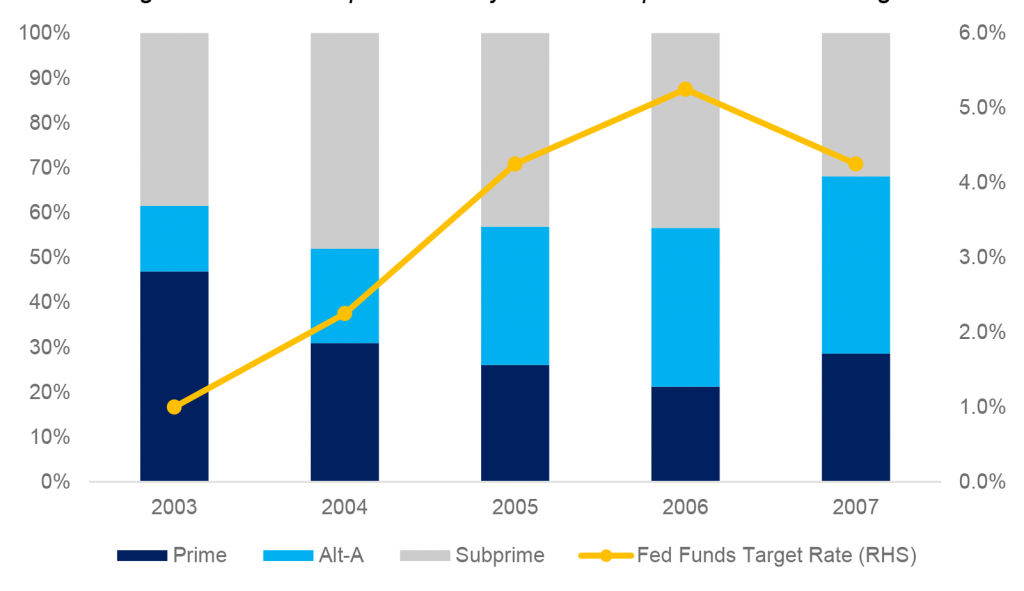
Source: Inside Mortgage Finance, Bloomberg LP, Amherst Pierpont
What’s different now?
A lot is obviously different now. The Qualified Mortgage rules and Ability to Repay standards now provide substantive safeguards against the erosion in underwriting standards seen in both the Alt-A and subprime sectors of the legacy private-label market. Risk retention requirements under the QM rules may also provide a modest headwind to exponential growth of the non-QM market, although there appears to be little evidence that the market is short on risk retention capital currently, especially in light of what appear to be attractive economics for sponsors of non-QM securitizations.
While expanded credit lending may have substantial room to grow next year, it is nearly impossible that it will make the contribution to overall issuance that it did pre-crisis, primarily since Ginnie Mae has supplanted the private-label market for less creditworthy borrowers. In 2003, Ginnie Mae and the private-label market had roughly an equal market share (Exhibit 2). As underwriting standards eroded, the legacy subprime share grew, fueled by both weaker underwriting and the prevalence of affordability products in the legacy subprime market. Estimates suggesting expanded credit lending could approach levels of private ‘B’ and ‘C’ lending, which totaled 6% to 10% of all originations in the late 1990s and early 2000s, likely do not consider that subprime lending lies firmly with Ginnie Mae. There currently seems little possibility that the private market will wrestle away any meaningful supply especially HUD’s recent report on the FHA’s Mortgage Market Insurance Fund showing capital at a 14-year high of 8.03%. While the strength of the MMIF may not signal a near term MIP reduction—regulators are likely still waiting to measure pandemic forbearance-related defaults and losses—it may trigger a reduction in MIPs in the future if credit losses are ultimately benign. Any reduction in MIPs would only serve to further reduce the government’s cost of finance to lower-credit borrowers.
Exhibit 2: Private-label share of subprime borrowers appears unlikely to grow
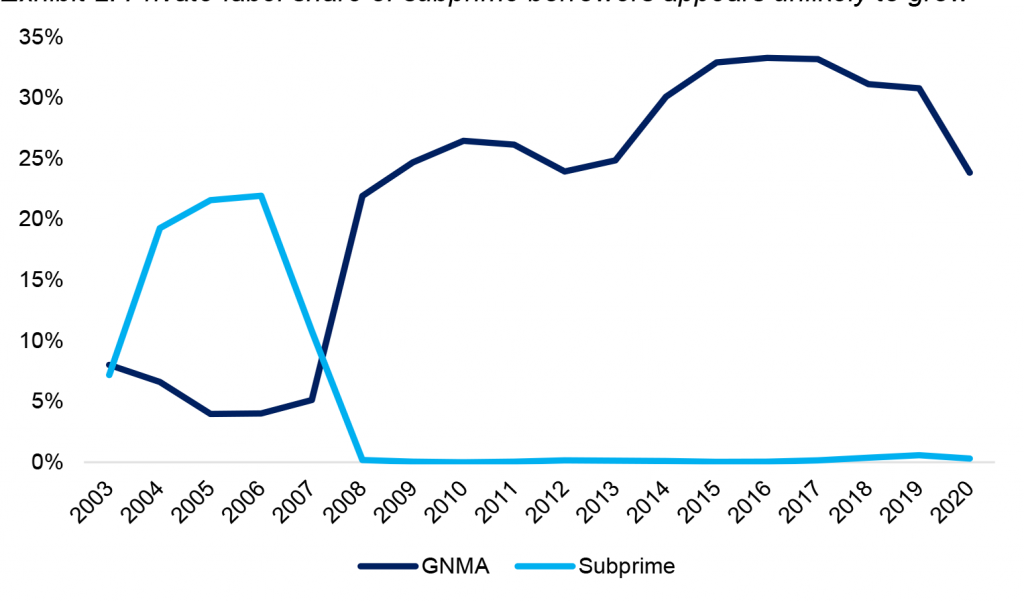
Source: Inside Mortgage Finance, Amherst Pierpont
In addition to competition from Fannie Mae and Freddie Mac for higher balance prime borrowers and from FHA for less creditworthy borrowers, the private-label market, and particularly the expanded credit market likely faces one additional headwind to growth next year, that being limited expertise in manually underwriting loans using alternative documentation. This limitation may self-correct over time if the market experiences sustained periods of higher interest rates or as originators make more substantial investments in hiring and training manual underwriters. Additionally, certain forms of non-QM lending, specifically loans underwritten using the property’s rental income rather than the borrowers’ may alleviate some of the operational constraints associated with manual underwriting.
Drivers of growth
Recent non-QM issuance suggests that two areas of growth in expanded credit next year will be in loans to self-employed borrowers and loans to investors looking to use a properties’ rental income rather than their own to secure financing. An analysis of recent non-QM issuance shows that anywhere from 30% to upwards of 90% of collateral backing recently issued non-QM trusts are loans to self-employed borrowers, a trend that looks likely to hold well into next year (Exhibit 3).
Exhibit 3: Alternative documentation and self-employed borrowers make up most of recent non-QM issuance
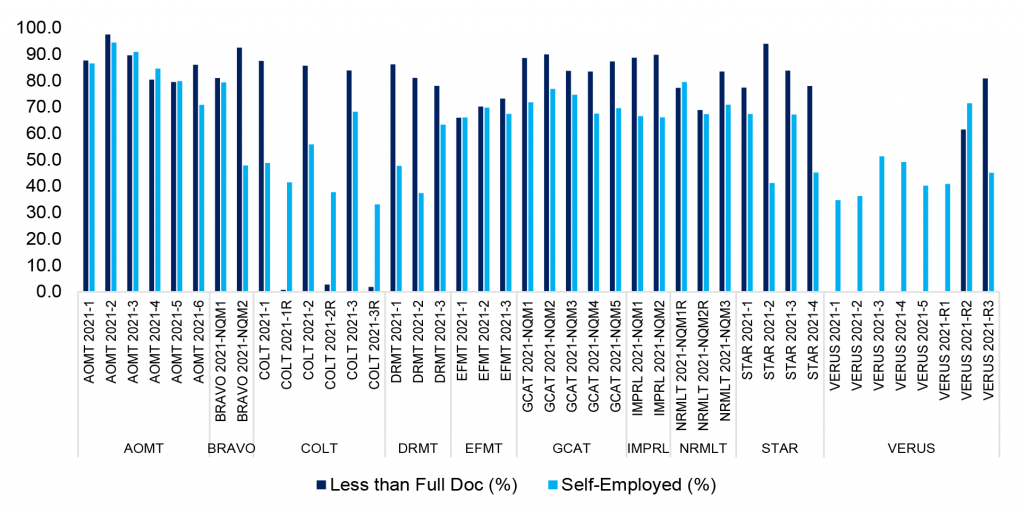
Source: KBRA, Amherst Pierpont – Populations of less than full doc loans unknown for VERUS 2021-1 through 2021-5
Overall demographic trends appear to support growth in the expanded credit market due to an increasing amount of self-employment. The number of self-employed workers in the US had steadily risen from 2011 until the beginning of last year when the pandemic significantly reduced the self-employed workforce. However, that number has rebounded substantially and is now approaching pre-pandemic levels (Exhibit 4). What appears to be somewhat of a secular shift away from traditional W-2 based income looks likely to help fuel expanded credit issuance in the future.
Exhibit 4: Self-employed workers rebound post-pandemic
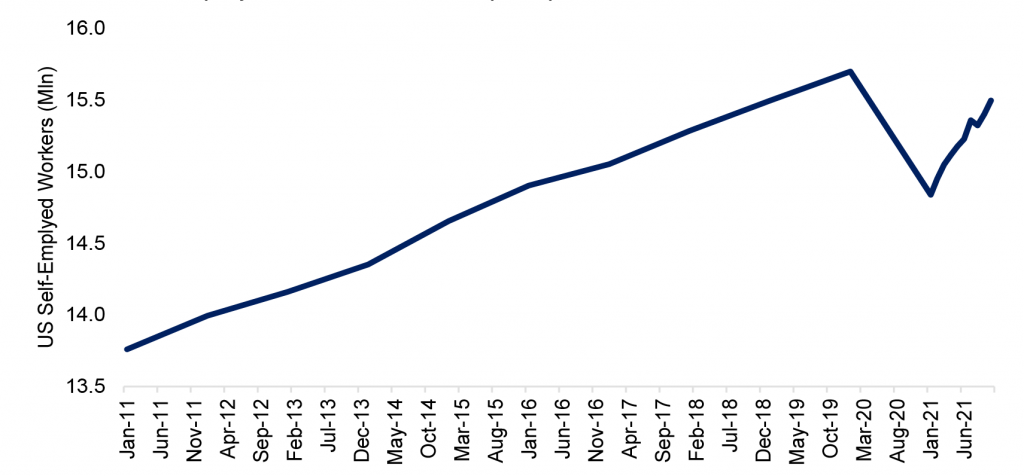
Source: US Bureau of Labor Statistics – Data is not seasonally adjusted
Additionally, the sharp rise in home values over the last year or so has almost certainly made it more difficult for buyers of investment properties to qualify for a loan based on personal income alone. Investors may increasingly try to qualify by using the property’s rental income, which would boost non-QM supply. Stronger fundamental performance and more straightforward underwriting of these loans than other non-QM products likely provide a substantive tailwind to greater issuance going forward as well. While DSCR lending was not part of the residential securitization landscape pre-crisis, it could be a meaningful contributor to issuance in this cycle.
Other sources of supply – CRT
The other major potential source of supply in mortgage credit next year will likely come in the form of GSE CRT. Gauging the amount of CRT supply that could hit the market next year is somewhat challenging as it will rely on a few factors. First, and most obviously is the amount of qualifying gross production that the enterprises purchase next year. Internal APS projections estimate that gross issuance of conventional 30-year production, which would make up the bulk of the balance of CRT reference pools, could range from $1.50 trillion to $1.75 trillion next year. Assuming a 3% slice of risk transferred on qualifying gross production, that would equate to roughly $45 to $52 billion in new CRT next year if all the risk were transferred on the qualifying reference loans.
In addition to organic gross supply, additional supply may come in the form of issuance referencing Fannie Mae’s retained guarantee book of loans acquired during their pause in issuance. According to the agency’s second quarter 10-Q, Fannie Mae had acquired just over $1.2 trillion in qualifying loans where it retained the credit risk. In two transactions this year, the firm has subsequently transferred credit risk on just over $100 billion in reference principal balance where the loans were roughly nine months seasoned at time of issuance in each deal. According to their guidance, Fannie Mae will only issue CRT on the portion of the remaining $1.1 trillion originated this year. While it is difficult to estimate the seasoning distribution of retained production, if roughly $500 billion were originated this year, a 1.5% to 2.0% slice of risk on these more seasoned, de-levered loans could add an additional $7.5 to $10 billion in net supply.
How much CRT the enterprises ultimately issue will be governed by FHFA, specifically through their annual scorecard for the GSEs. Historically, the enterprises have been mandated to transfer credit risk on 90% of qualifying originations, a requirement that was obviously relaxed under the Calabria regime against the backdrop of changes to the Enterprise Capital Rule. Given the renewed focus on CRT under current FHFA leadership, it seems likely that the GSEs will revert to the previous scorecard requirements, which would translate to roughly $40 billion to $47 billion in new CRT next year, with an upward bound of slightly less than $60 billion if Fannie Mae transfers the credit risk on the remainder of loans acquired this year during their pause in issuance.
As forbearance plans come to term through the remainder of this year and principal with windows open on existing CRT transactions, paydowns from existing deals will increase. Looking back to 2019 performance against the backdrop of low delinquencies and higher interest rates, annual paydowns totaled slightly less than $11 billion on average bond balance of $58.2 billion. Comparable paydowns would offset 18% of gross issuance next year assuming those proceeds were reinvested in CRT would equate to between $32 and $38 billion of net issuance next year with an additional $7 to $10 billion adjustment for incremental catch-up Fannie Mae issuance. Net supply of $40 to $50 billion meted out over the entire year should be relatively easily absorbed by the market. (Exhibit 5)
Exhibit 5: Estimating net issuance of CRT in 2022
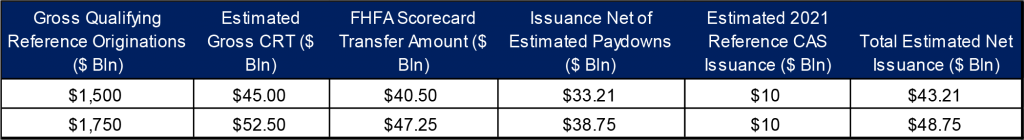
Source: Amherst Pierpont
As a result, we would expect spreads to gradually tighten next year, especially if outstanding supply was further curtailed by additional redemption activity through tender offers. CRT spreads will likely govern risk premia in other areas of the market and spread tightening in CRT should be widely constructive for issuance of other forms of deep mortgage credit.
The private-label market next year may reflect certain early pre-crisis trends, namely the growth in expanded credit against the backdrop of rising rates, strong home price appreciation and tight underwriting standards but some things will be markedly different. The private-label subprime market looks likely to remain a legacy anachronism, while novel forms of underwriting for investment properties should be an area of growth that did not exist pre-crisis. And unlike the pre-crisis era, the GSEs will be meaningful sellers of mortgage credit rather than buyers of it. Ultimately 2022 may be the litmus test of whether reforms to the private-label market in the wake of the crisis will yield a meaningful source of mortgage finance in the future or a niche market for loans that do not fit into what appears to be an expanding government footprint.