


The Big Idea
Markets Outlook 2022: Lingering liquidity, rising volatility
Steven Abrahams | November 19, 2021
This material is a Marketing Communication and does not constitute Independent Investment Research.
The Fed will attempt to make a smooth shift in policy next year, and that will almost certainly dominate debt capital markets. The rates and inflation markets have priced to the Fed’s expected path, but the effects on volatility and risk assets are much less clear. Volatility is likely to be higher, but the options markets have not yet priced that in. And despite the Fed shift, an overhang of liquidity is likely to suppress risk-adjusted returns for years to come. Finding opportunity in public markets requires careful work, with perhaps easier opportunities in various forms of private debt.
* * *
A mispriced market for volatility
Taper kicks off a transition that widens the range of possible market outcomes for the next few years, and the volatility and spread markets are not yet priced for that. One driver looks likely to be the back-and-forth between policy and the economy itself as the Fed navigates inflation. The other is the handoff of market power from the Fed to private capital. MBS may make a small, separate contribution to volatility, too. Portfolios can trace the labyrinth of possibilities and position or navigate accordingly as markets reprice. But portfolios also can just get long convexity and offset the cost by taking liquidity or other risk.
The Fed will be tapering through circumstances different from its only prior taper, which ran from December 18,2013 to October 29, 2014. Most importantly, Fed policy itself has changed. Jackson Hole in 2020 set out the flexible average inflation targeting framework, which opened the door for inflation well above the Fed’s 2% target. From 2008 through 2020, core PCE only ran above 2% for two brief periods (Exhibit 1). Things obviously have changed. The Fed will have to reel inflation in and keep expectations grounded around 2%. It clearly has the tools—tapering, forward guidance and ultimately the hammer of higher rates—and the inflation markets today expect the Fed to deliver, with forward implied inflation falling quickly over the next few years. But the Fed will have to do this in a different economy than the one it faced in 2013—GDP today relying more on goods, less on fixed investment, less on trade. It also faces a work force where preferences have changed, too, highlighted by lower participation in the aftermath of pandemic. It is a setting ripe for policy recalibration if not outright mistakes.
Exhibit 1: Unlike the last time, the Fed will have to taper through higher inflation
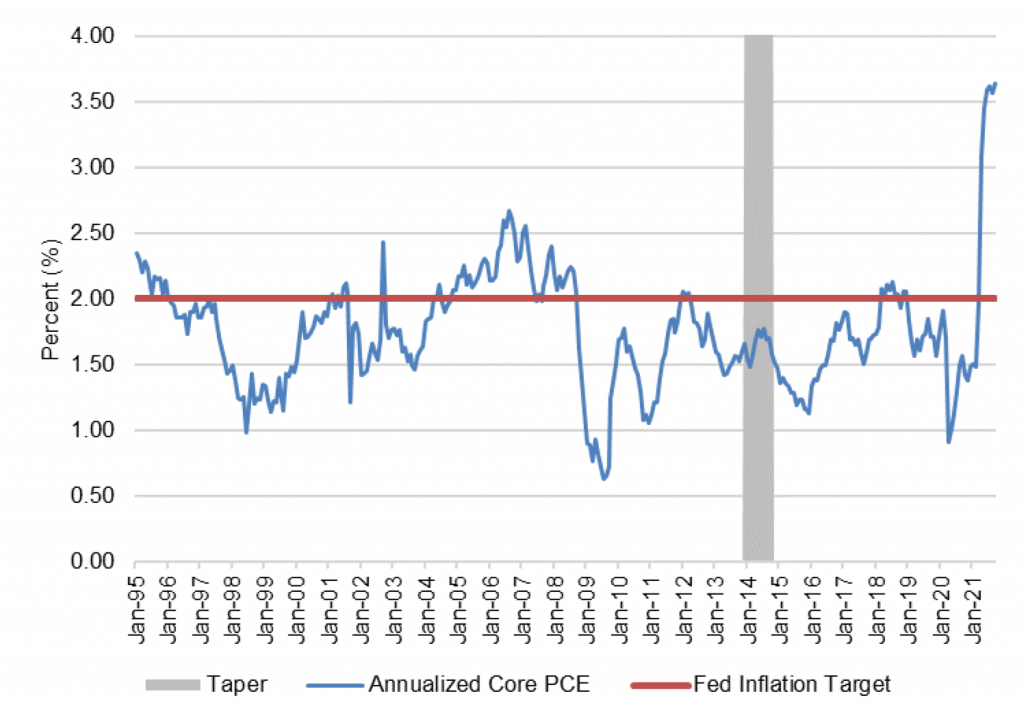
Source: Federal Reserve, Amherst Pierpont Securities
Taper also marks the beginning of the Fed’s slow ceding of market power back to private capital. The Fed now holds nearly 25% of outstanding marketable Treasury debt and nearly 32% of outstanding agency MBS. Federal deficits and a larger eligible loan balance almost assure the markets will grow, so the Fed share is almost assured to decline.
Compared to the Fed, private capital comes with more diverse and less transparent objectives and with more constraints. The Fed’s big objective is to ease financial conditions, although it works through different channels—liquidity, lower rates, tighter spreads, signals about inflation and so on. The Fed may be limited to buying only safe assets, but it has practically unlimited buying power. And the Fed tries to communicate. Private capital, in contrast, manages against a wide range of liabilities, puts different emphasis on income and total return, has different amounts and costs of funding and different amounts of capital. And private capital usually considers its plans proprietary. The impact of private capital on markets consequently is less predictable and more volatile.
Expected volatility for most rates ultimately rose through the last taper. The change in volatility depended on how much influence the Fed had on the rate. Expected volatility on 2-year rates declined from December 2013 through October 2014, although it rose sharply at the end (Exhibit 2). Volatility on 5-year rates finished roughly unchanged. Volatility of 10- and 30-year rates rose substantially. The year after taper, expected volatility was substantially higher. The higher volatility starting in late 2014 corresponded with a drop in oil from a high of more than $110 a barrel to a low below $40. Whether that was coincident with tapering or caused by concern about the impact of tighter policy on growth is hard to tell. A rising supply of natural gas definitely weighed on energy prices. But the past mix of tighter policy and shifting economic conditions highlights the potential for volatility.
Exhibit 2: In the last tapering, implied vol on 5-, 10- and 30-year swaps rose
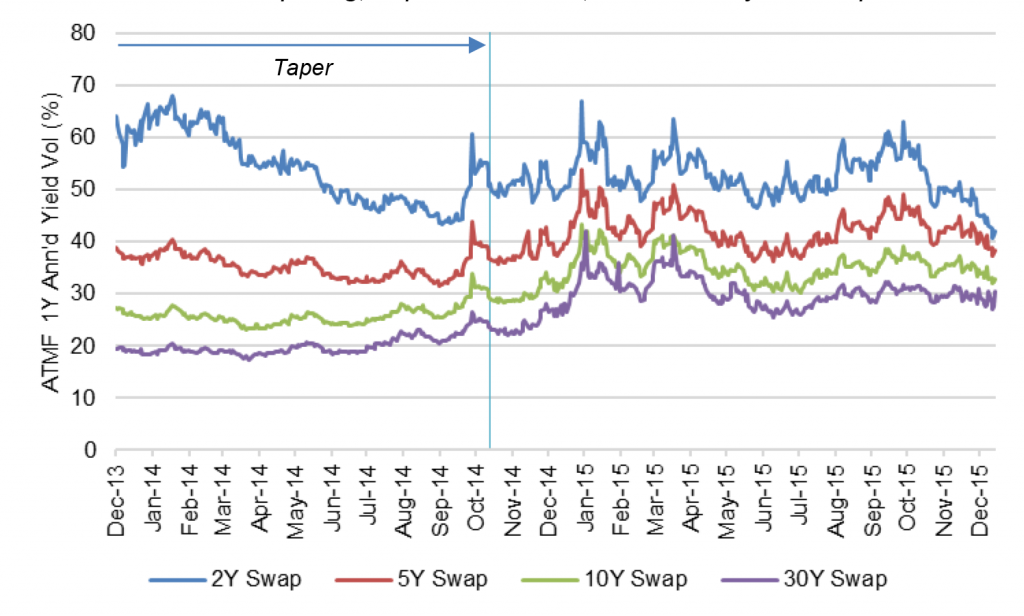
Source: Bloomberg, Amherst Pierpont Securities
MBS may also make a small contribution to volatility next year. The loan balance eligible for a Fannie Mae, Freddie Mac or Ginnie Mae guarantee should rise nearly 20%. Larger loans show much more sensitivity to rates, and the agency MBS market puts more of that risk on balance sheets likely to dynamically hedge the rate risk and relay volatility to other parts of the market.
The options markets imply volatility will drop from here forward. The rate volatility implied by options on 2-, 5- and 10-year rates all slide much lower in the years ahead (Exhibit 3). That seems like a clear mispricing based on fundamental uncertainty and the track record for taper.
Exhibit 3: The swaptions market implies rate volatility will slowly decline
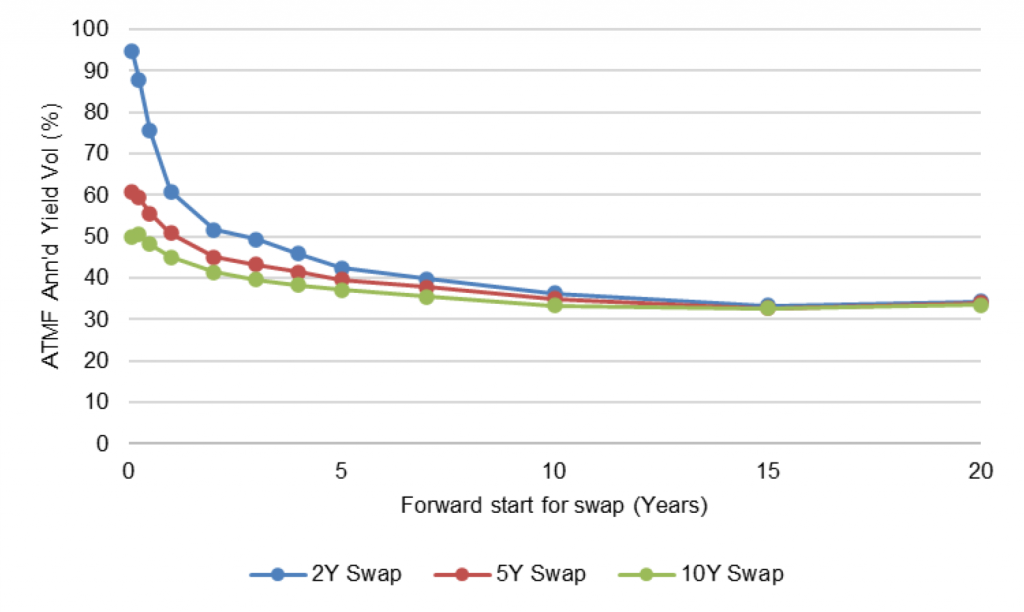
Note: As of 11/16/21.
Source: Bloomberg, Amherst Pierpont Securities
Portfolios can try to manage through volatility by anticipating Fed or market recalibration, but that is a game of informational advantage where few if any players have a reliable edge. And holding liquidity in hopes of redeploying it at just the right moment is expensive.
Instead, add convexity either through cash securities with fewer embedded rate options or by buying options back outright. Convexity or options cost money either in carry or outright, so offset the cost by selling some other risk. Illiquidity risk seems like the best source of compensating return, especially in a market likely to be awash in cash throughout the Fed’s long return to normal.
Some expressions of expected higher volatility:
- Buying at-the-money-forward 1Y5Y or 1Y10Y swaption straddles
- Selling TBA MBS to buy specified pools
- Selling CMO sequential classes to buy PACs
- Selling ‘AAA’ prime RMBS to buy ‘AA’ non-amortizing senior classes
- Selling lower-rated corporates or CLOs to buy higher-rated, less liquid names
* * *
Falling risk-adjusted returns and a flatter spread curve
Taper also clearly starts to slow the flow of cash into the financial system, but cash will likely be sloshing around for years. And the excess liquidity should keep squeezing returns across all assets. The practical effect should be steady pressure on debt spreads, all else equal, and steady narrowing of yield differences between the safest and riskiest assets. Credit risk curves should flatten, although investors should anticipate the risk from volatility
The cash put into private hands when the Fed buys Treasury debt and MBS already has squeezed asset yields. In repo, parts of the Treasury market, in agency MBS, corporate debt and other areas, many spreads stand near their tightest levels in decades. Investors that might have dipped into these markets have been forced to look elsewhere. The Fed will continue adding liquidity through taper, and that should tighten markets further.
The rates market already anticipates historical amounts of excess cash for years to come. Real rates on 5-, 10- and 30-year Treasury debt stand near their lowest levels in decades (Exhibit 4). Since real rates show the expected price where the supply of cash and the demand to borrow it clear, low real rates signal an excess of supply over demand. Cash will either have to settle for current or even lower real rates or move to other corners of the market.
Exhibit 4: Historically low real rates suggest lots of cash, little demand to borrow
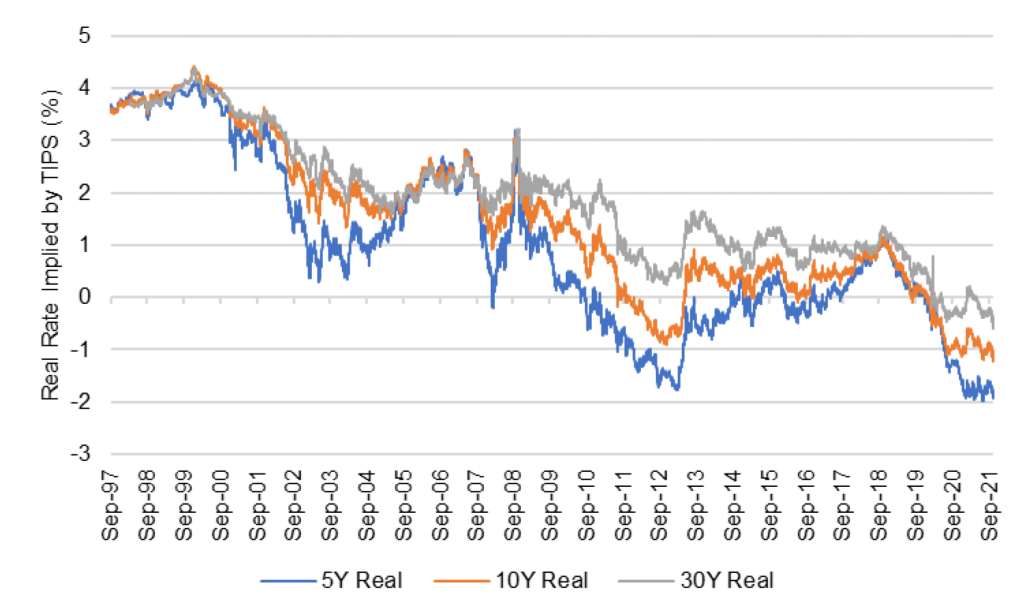
Source: Bloomberg, Amherst Pierpont Securities
The safest assets already have priced to negative risk-adjusted returns. In the Treasury market, term premiums—the yield left after accounting for the likely path of short rates—are negative at most maturities (Exhibit 5). Negative premiums imply investors would be better off rolling Treasury bills. Interest rate risk or duration clearly is rich.
Exhibit 5: A flatter yield curve has pushed Treasury term premiums negative
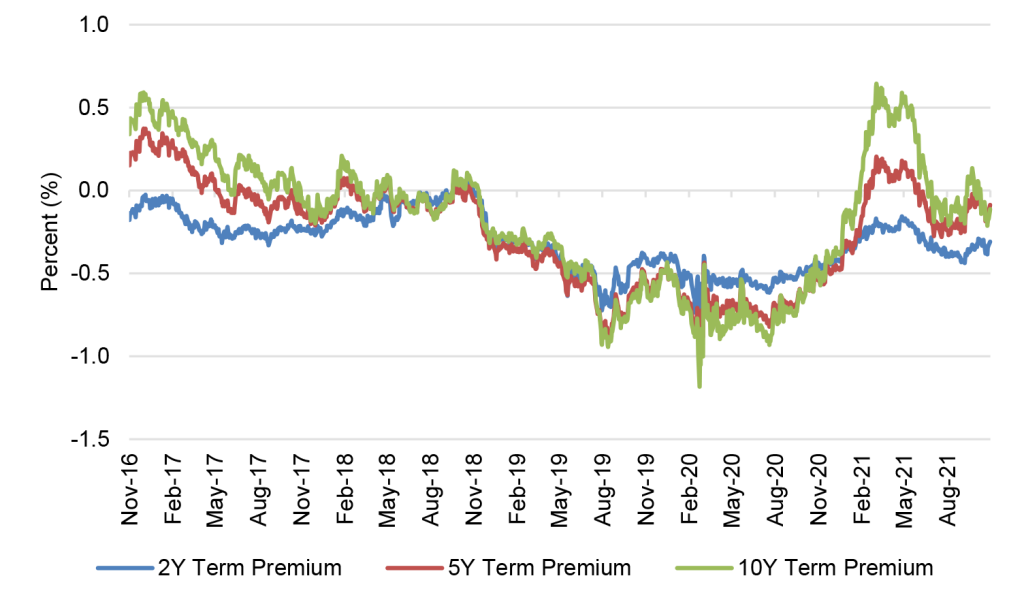
Source: Bloomberg, Amherst Pierpont Securities
The agency MBS market also has priced to low option-adjusted spreads. Par 30-year MBS now trade at an OAS of 3 bp and 15-year MBS at -16 OAS, some of the lowest levels in years (Exhibit 6). The tight spreads come just as the loan balances eligible for agency MBS rise, adding negative convexity. Effective OAS is probably lower than MBS models estimate since few if any anticipate the rising conventional conforming loan balance. Prepayment risk is rich.
Exhibit 6: Par 30- and 15-year MBS have priced to historically low OAS
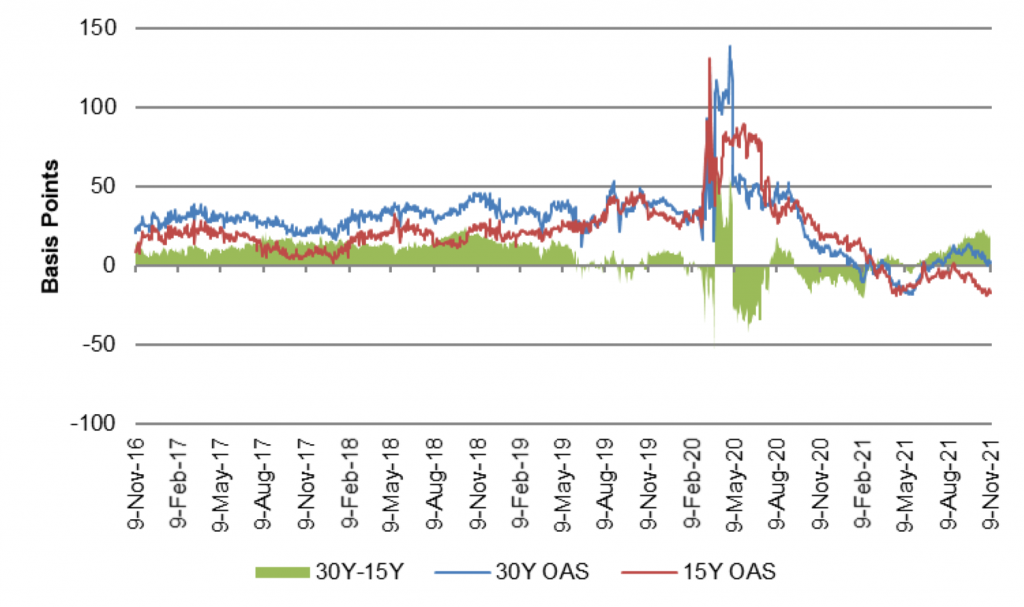
Source: Bloomberg, Amherst Pierpont Securities
Low returns in the safest assets have pushed cash into riskier markets, and this should continue into 2022. The spread between high yield and investment grade corporate debt now stands at one of the narrowest levels in at least the last decade (Exhibit 7). Since the start of 2012, the market has seen a spread tighter than the current level of 231 bp less than 5% of the time.
Exhibit 7: The spread between high yield and investment grade has narrowed
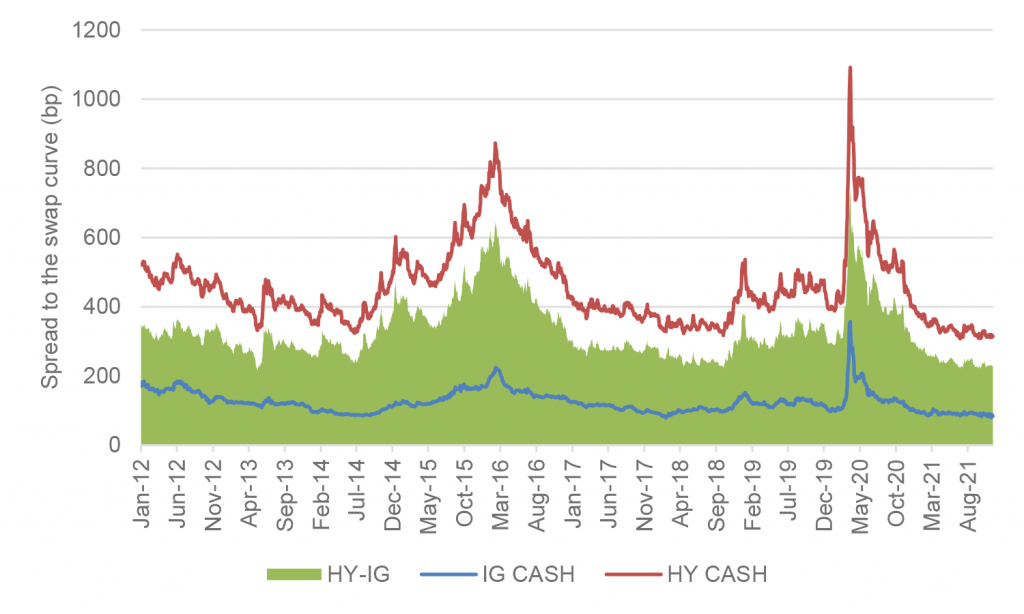
Source: Bloomberg, Amherst Pierpont Securities
For at least the next year, a flattening spread curve should help weaker credits outperform stronger ones. All credits will be vulnerable to higher volatility. But investors should be able to balance overweight positions in weaker credits with underweight positions in stronger credits, offsetting the spread sensitivity or beta of the weaker credit with the beta of the stronger one. The higher spread in the weaker credit should provide net positive carry and better total return as the spread curve flattens further.
Some expressions of an expected flatter spread curve, volatility-neutral:
- Selling higher-rated, long maturity debt to buy lower-rated, short maturity
- Selling higher-rated debt to buyer lower-rated, and hedging with option straddles
* * *
A lift from inflation for credit fundamentals
The market typically trades as if inflation is good for credit, and that intuition has history behind it. Rising inflation expectations usually come with tightening credit spreads, and realized inflation usually comes with rising corporate margins. The market expects 3.5% CPI on average for the next two years, and our chief economist, Stephen Stanley, points to risk of higher levels. That is bullish for credit, especially leveraged credit. But the market also has good reason to expect inflation eventually to fall. So, add leveraged credit but keep the maturity short.
Inflation expectations and credit spreads usually move in sync. Rising expectations come with tighter spreads, and falling expectations come with wider spreads (Exhibit 8). That is true for investment grade and high yield debt. Rising inflation potentially allows issuers to pay off nominal debt with inflated net revenues—at least as long as revenues rise faster than costs. But cause-and-effect can be hard to pin down. Tighter spreads could raise inflation expectations if easier financial conditions accelerate growth. Simple efforts to untangle cause and effect suggest inflation expectations drive spreads rather than the other way around. The market expects issuers on average to benefit from inflation
Exhibit 8: Credit spreads, HY especially, have tracked inflation expectations
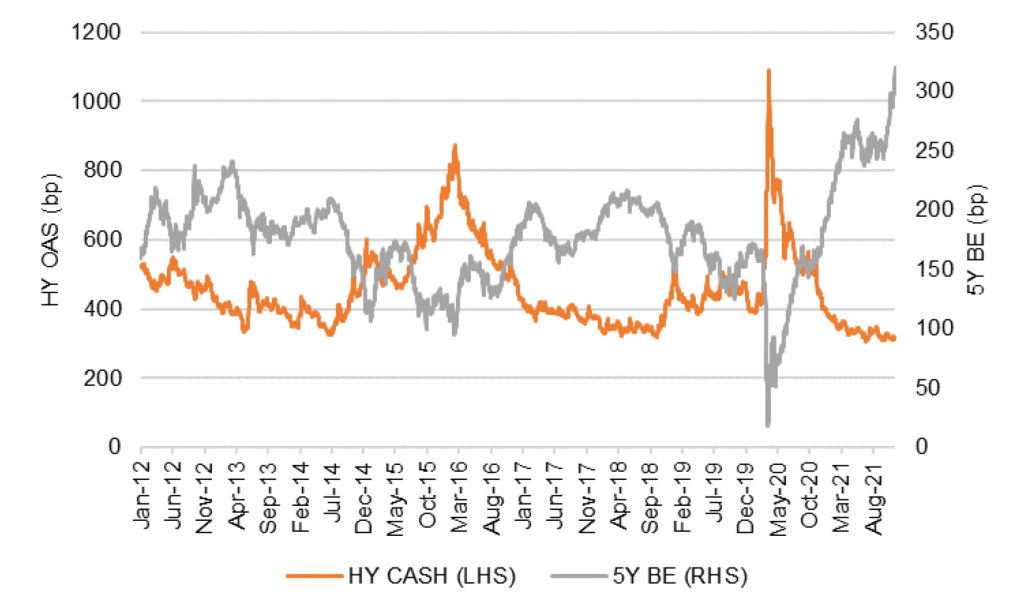
Source: Bloomberg, Amherst Pierpont Securities
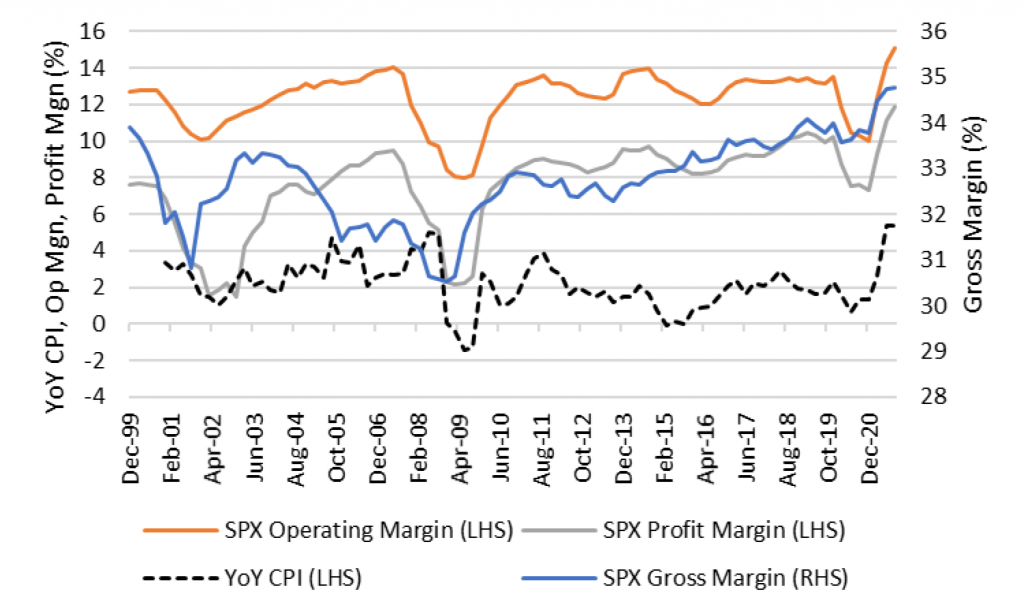
Market expectations have some grounding in reality. Margins for the S&P 500 have varied with inflation, although changes in inflation alone only explain 5% of the changes in margin (Exhibit 9). Profit margins have varied the most, operating margins next and gross margins the least—largely reflecting differences in underlying fixed costs. The message in the numbers is that the revenue line of the income statement historically moves faster than the expense line. Lately, both inflation and corporate margins have both surged to their highest marks in decades.
Exhibit 9: Corporate margins and CPI have broadly moved in sync
Source: Bloomberg, Amherst Pierpont Securities
Dan Bruzzo and Meredith Contente, our investment grade credit strategists, are skeptical that all management teams will be able to handle current inflation. Pandemic led many companies to frontload cost cuts and other efficiencies, they argue, leaving little room to cut further. And they expect customers to begin pushing back on price hikes. They are the closest to individual balance sheets and highlight a series of companies better or worse prepared to defend margin against inflation. Their view through a balance sheet lens argues inflation will weaken credit. That is fair. But giving more weight to the macro record leads to a different conclusion.
The inflation markets expect inflation to eventually decline. Even through implied 2-year inflation is at 3.57%, 5-year implied inflation is at 3.17% and 10-year at 2.70%. The 5-year inflation rate expected five years from now falls to 2.24%. The market arguably sees the possibility that supply chains will correct or that substitute sources or products will come into the market. There’s the possibility that labor will come off the sidelines to ease wage pressures. Or the market alternatively relies on the Fed to raise rates enough to cool growth and ease price pressures.
The macro record argues the inflation already in the pipeline for 2022 and beyond should drive margins higher in aggregate and corporate spreads tighter. Stephen Stanley also sees inflation adding to robust profit growth. The caveat is that inflation should eventually subside, and margins normalize. Owning credit with long duration exposes a portfolio to the other side of the inflation cycle, and possibly to recession if the Fed hikes too aggressively. Own credit, especially leveraged credit, but keep maturities short.
Some expressions of expected stronger credit fundamentals:
- Down in credit in 5-year or shorter maturities in corporate debt, CLOs, CMBS or ABS backed by corporate or residential obligations
* * *
Strong markets in private credit
Banks still provide the bulk of private credit in the US, but steady growth in private debt funds, business development companies and even middle market CLOs has steadily taken share. Banks have started to loosen lending standards after tightening sharply through 2020. But bank standards are still tighter than they were pre-pandemic. Repeated warnings on bank earnings calls about low expectations for loan growth next year suggest banks will still extend credit cautiously, allowing private debt to continue gaining share. Investors can participate through CLOs or by providing funding to portfolios of private debt.
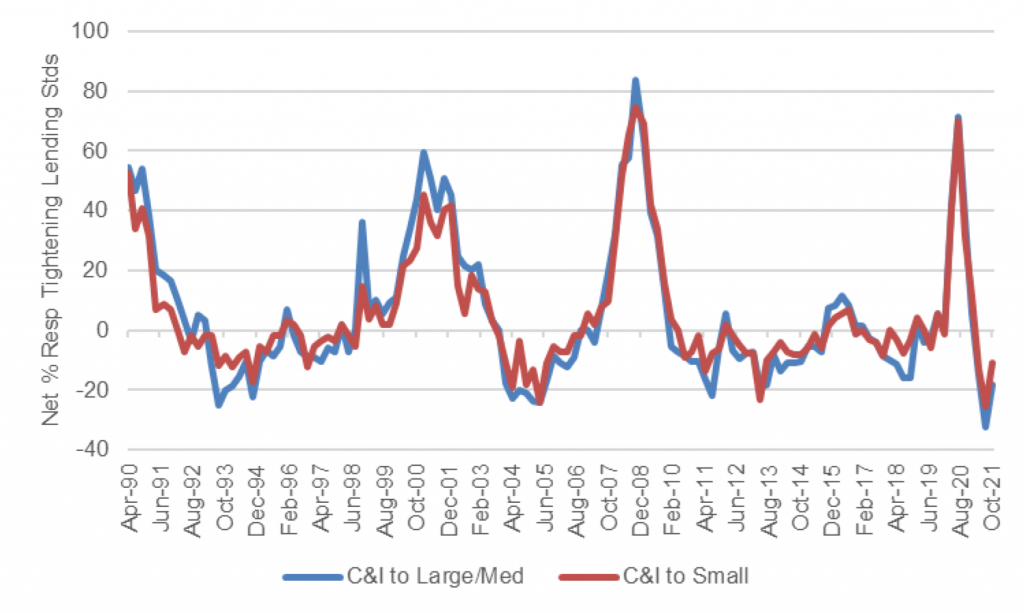
Bank credit has loosened but still has not reverted to pre-pandemic levels. Past episodes of tightening around 2001 and 2008 suggest it takes years to get back to normal conditions (Exhibit 10). The tightening may avoid bad credits, but it also leaves some creditworthy borrowers behind. And this has become the customer base for the growth in private debt.
Exhibit 10: Bank credit standards still stand tight to pre-pandemic levels
Source: Federal Reserve, Senior Loan Officer Opinion Survey, Amherst Pierpont Securities
Providers of private credit have responded. Balances at private debt funds, business development companies and middle-market CLOs have grown since 2008 at a compounded annual growth rate of 12.7% (Exhibit 11). Private debt typically wins business not by competing on price but by competing on non-price terms such as covenants, draw periods, mark-to-market features and the like.
Exhibit 11: Private debt AUM has grown since 2008 at a CAGR of 12.7%
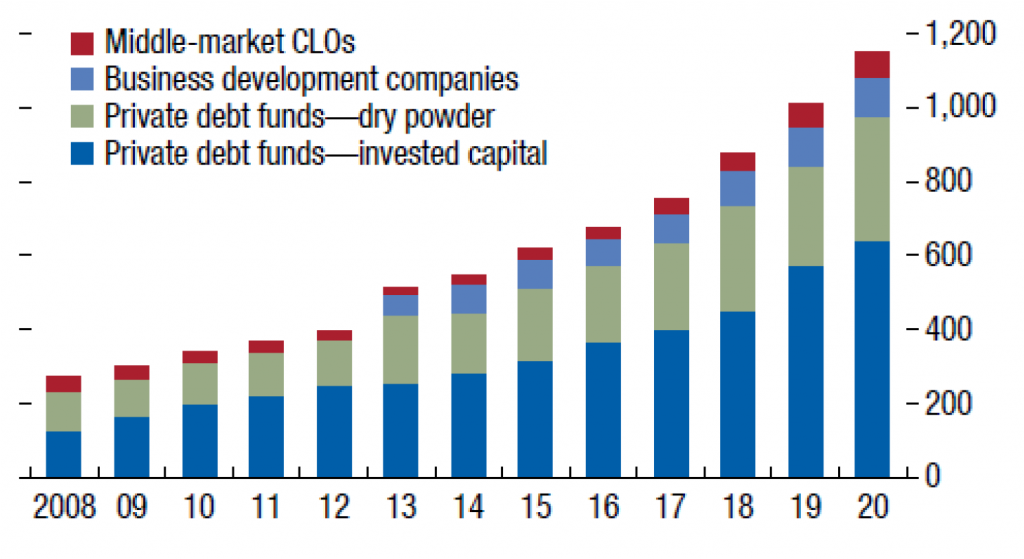
Note: figures in $billions.
Source: International Monetary Fund, Amherst Pierpont Securities
Banks have actually helped fuel the shift in credit to nonbank lenders by providing loans secured by private debt portfolio assets. The recent Fed Financial Stability Report shows bank lending to private debt funds and related nonbank lenders in the last three and a half years rose by nearly $500 billion.
Our credit strategists point out that 2022 will likely see robust M&A, which often gets funded by private debt providers. Market conditions should be good at least through the next few years—plenty of balance sheet liquidity, manageable leverage, strong earnings. And the economy should help, even though growth should slow. Barring sudden tightening by the Fed, carry and returns in private credit should add to and diversify most portfolios.
Expressions of expected strong private debt markets:
- Adding exposure to middle-market CLOs
- Financing portfolios of private debt
* * *
A range of niches to watch
The transition to SOFR. This looks likely to surprise to the upside, running more smoothly than even the ARCC might have imagined a few years ago. Legacy private-label MBS and the CLO markets remain the most vulnerable parts of the US debt capital markets. The derivatives markets and the agency MBS markets have largely transitioned to SOFR for exposures that might last beyond the scheduled June 30, 2023, sunset for LIBOR. The legacy private-label MBS market will likely get rescued by federal legislation that helps the securitizations avoid resetting to the last value of LIBOR or using other mechanism that never contemplated an end to the index. The CLO market will likely see a surprisingly fast transition of CLO debt to SOFR led by transition in the leveraged loan market. That market and the broader market in bilateral business loans will likely start transitioning next year to avoid process bottlenecks ahead of the 2023 sunset. When a majority of the underlying leveraged loans switch to SOFR, language in most deals will force much of the CLO market’s outstanding debt to switch as well. There is still room for disagreement on the fair spread adjustment for switching from LIBOR to SOFR. And a liquidity crisis could expose a possible flaw in substituting riskless SOFR for risky LIBOR. But a liquidity crisis next year is highly unlikely.
The conversation around climate. The Financial Stability Oversight Council has put climate in the spotlight with a recent report urging regulators to start getting standardized measures of climate exposure for their regulated entities. From a practical standpoint, this means bank and insurance exposure to homes and business in flood, fire and tidal zones or other areas subject to climate risk. Once a risk is measured, it is an easy next step to require capital, repricing or other measures to manage it. This could put pressure on current regulated holders of the risk and open doors for other financial providers to intermediate.
The conversation around crypto. The crypto currency market is still relatively small, but it has started to appear on the radar of the debt markets. Stablecoins are the type of crypto most likely to get attention since they try to peg their value to some external reference, such as US dollars. Some, such as Coinbase, allow holders to exchange stablecoin one-for-one for dollars. This is conceptually just like a bank, but without the transparency created by bank regulation. The broad issue is the response of stablecoin holders if some doubt arises about the ability of the provider to meet demand for exchange. A run on the stablecoin provider might not affect the financial system directly, but a holder unable to liquidate might sell other assets. And fire sales can have broader effects. The systemic exposure is still small, but the conversation is likely to get louder.