


The Big Idea
One small step for the Fed, one giant leap for markets
Steven Abrahams | November 5, 2021
This document is intended for institutional investors and is not subject to all of the independence and disclosure standards applicable to debt research reports prepared for retail investors. This material does not constitute research.
With the official notice of taper, a long series of changes goes in motion. QE has shaped rates, liquidity, asset demand, bank and asset manager behavior, mortgage risk, volatility and financing. All of that looks set to change over the long path back to neutral policy.
Off along the long path to normal
Taper sharpens the focus on eventual Fed rate hikes and other steps along the path to neutral policy. First, the Fed needs to finish taper. Then the Fed holds portfolio balances steady while it raises IOER. And finally the Fed lets portfolio balances decline through debt maturities and prepayments until its balance sheet contracts to a new normal—a level determined with a healthy dose of art since the repo market problems in September 2019 showed the Fed missed the mark a bit in winding down the last round of QE. The last path to renormalization took more than six years after taper, partly because it was interrupted by a crash in the energy markets. This path should be shorter. But the Fed dots show hikes running through 2024, so a path of another three years and five years is highly likely.
A higher cost of funds
Anticipation of taper has already raised rates primarily in 5-year and shorter maturities, so the cost of funds should steadily rise for leveraged balance sheets and investment portfolios. The fed funds futures and OIS forwards already price more than two hikes by the end of 2022, even though the Fed dots anticipate only a 50% chance of one hike. The Treasury market is already gauging whether the 2-year note yield is high enough if the Fed posts its first hike in June. Leveraged balance sheets may be able to afford higher interest expense if customers allow companies to pass along the higher costs, but investment portfolios with fixed coupons and illiquid assets may get squeezed.
Exhibit 1: The market is ahead of the Fed for 2022 but more aligned in later years

Source: Bloomberg, Amherst Pierpont Securities
Less cash in the system, more value in market liquidity
The Fed is going to collect trillions of dollars of cash when it decides to let portfolio balances decline, although the amount will depend on where the Fed sets its target level of excess reserves. But the level will be lower than today. Getting portfolio liquidity through repo or other forms lending naturally becomes more expensive, so market liquidity—the ability to trade securities for cash—should become more valuable. In other words, illiquid assets should widen to more liquid ones.
Slower growth in bank deposits and in bank demand for assets
Bank liabilities have jumped $4.2 trillion or 26% since the start of March 2020, and assets have come along for the ride (Exhibit 2). Not all of that is monetary policy. Fiscal stimulus and economic growth have helped, too. But QE has played a big role, and tapering should slow the trajectory. Renormalization should slow it further or even reverse it unless fiscal policy or growth steps in. Cash assets and securities rather than loans have received the lion’s share of the new liabilities, and deceleration should show up in less demand for those assets. Excess reserves should drift lower, and so should marginal bank demand for Treasury debt and MBS.
Exhibit 2: Bank assets and liabilities have accelerated through QE
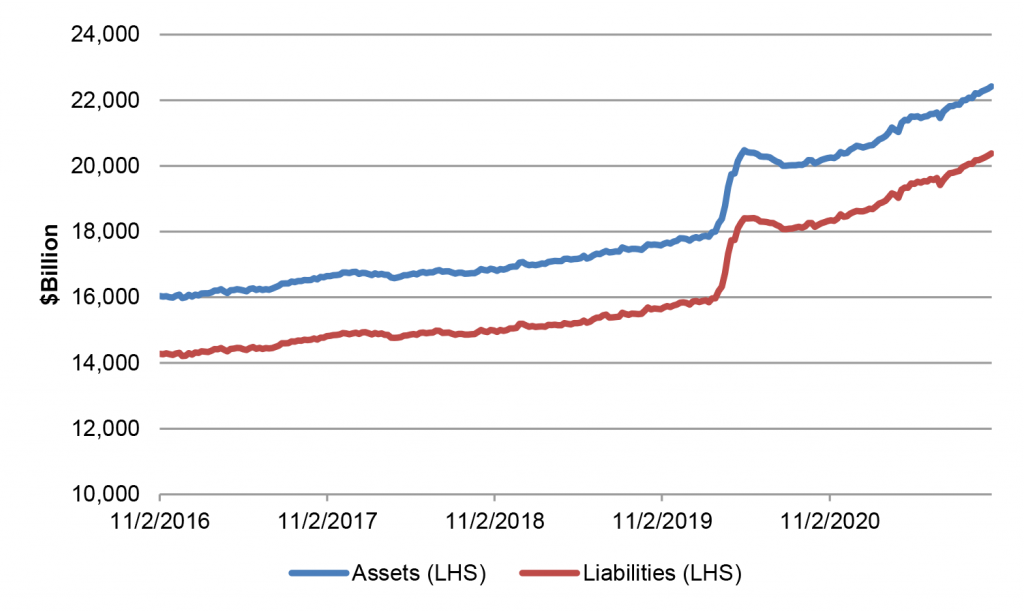
Source: Federal Reserve H.8, Amherst Pierpont Securities
Lower levels of QE deposits and longer bank liability duration
The drawdown in bank reserves—up roughly $2.2 trillion since March 2020—should just reflect a parallel drawdown in the shortest bank liabilities, leaving the weighted duration of remaining liabilities to get progressively longer. If every bank simply added to excess reserves for every dollar of hot QE deposit that came in the door, then weighted remaining asset duration should extend, too, matching the extending liabilities. But there has been great appeal to investing in longer asset to beat the return on IOER. Liquidating longer assets takes time. If liability duration extends faster than asset duration, banks will have to find ways to rebalance. That could involve investing in assets with longer duration, receiving fixed on swaps or other strategies.
The almost obvious: more negative convexity in MBS
Besides just buying MBS, the Fed has served an important role in filtering some of the most negatively convex pools out of the market. The Fed buys TBA and takes delivery without stipulations to loan size, FICO, LTV, geography, servicer or anything else. The Fed naturally ends up with a large share of the most prepayment-sensitive pools. The Fed so far has absorbed 56% of the floating supply in UMBS 2.0% pools and 63% of the float in 2.5% pools. Tapering will take some Fed demand and some filtering of pools out of the market, although keeping the portfolio balance steady will still involve buying to replace runoff. With the decision to allow balances to run off, the filtering will decline further. This leaves more of the most negatively convex pools in the floating supply of MBS, making cheapest-to-deliver for TBA worse and widening spreads. This also comes just as conforming conventional loan balances are about to rise by roughly 20%. The withdrawal of the Fed and the increasing presence of larger loans, all else equal, should steadily push up rate market volatility.
The almost obvious: a weaker TBA dollar roll
Because the Fed buys TBA and takes delivery of a sizable share of pools, dealers commonly have to offer special financing to other investors in the dollar roll market to ensure enough pool supply to cover sales to the Fed. That is a big issue for many mutual funds and other funds benchmarked to broad mortgage market indices. The indices usually exclude returns from special financing, and the dollar roll during QE has allowed many benchmarked asset managers to add significantly to performance. Tapering and eventual renormalization should lower the magnitude of special financing in dollar rolls. Manager activity in specified pools should pick up, as should interest in traditional MBS repo.
The completely obvious: less Fed demand for Treasury debt and MBS
The Fed now holds $2.5 trillion or 32% of outstanding agency MBS and $5.4 trillion or 24% of Treasury debt held by the public. That has represented significant marginal demand, and a number of Fed studies of past QE has credited Fed demand for tighter mortgage spreads and lower rates. With taper, demand drops, and with renormalization, it goes into reverse. Marginal effects on spreads and yields should slowly unwind.
The Fed has run an administered market in since 2008 with increasingly broad influence. With taper, policy changes, and broad parts of the market change, too.
* * *
The view in rates
Balances at the Fed RRP have taken a noisy path lower after peaking at $1.6 trillion on September 30. The facility is closing Friday with balances at $1.35 trillion. With taper starting, the facility has likely seen its peak.
Settings on 3-month LIBOR have closed Friday at 14.438 bp, its highest level since early July. With taper and deceleration of liquidity, yields at the short end of the curve should start to rise.
The 10-year note has finished the most recent session at 1.45%, down 10 bp from a week ago. Most of the drop came Friday after the October payrolls. Breakeven 10-year inflation is at 255 bp, down 4 bp in the last week. The 10-year real rate finished the week at negative 110 bp, down from negative 103 bp a week ago. The market is still pricing for significant excess liquidity in the future and an economy too slow to generate the borrowing needed to fully absorb it all.
The Treasury yield curve has finished its most recent session with 2s10s at 105 bp, flatter by 1 bp on the week, and 5s30s at 83 bp, steeper by 8 bp on the week.
The view in spreads
The bullish case for credit and the bearish case for MBS continues, despite surprisingly tighter spreads in MBS. Corporate and structured credit has held spread through most of the year despite the steady approach of Fed tapering. MBS, on the other hand, generally widened from the end of May before starting to tighten after the September FOMC.
Corporates benefit from strong corporate fundamentals and buyers not tied to Fed policy. The biggest buyers of credit include money managers, international investors and insurers while the only net buyers of MBS during pandemic have been the Fed and banks. Credit buyers continue to have investment demand. Demand from Fed and banks should soften as taper begins, Once the Fed shows it hand on the timing and pace of taper, the market should be able to fully price the softening in Fed and bank demand and spreads should stabilize. But something else is on the horizon.
MBS stands to face a fundamental challenge in the next few months as the market starts to price the impact of higher Fannie Mae and Freddie Mac loan limits. Home prices are tracking toward a nearly 20% year-over-year gain, which should get reflected in new agency loan limits traditionally announced in late November for loan delivered starting January 1. The jump in loans balances should add significant negative convexity to the TBA market and increase net supply. And this will come just as the Fed leans into tapering, which will take out a buyer that often absorbed the most negatively convex pools from TBA and a large share of net supply. The quality of TBA should deteriorate and the supply swell.
The view in credit
Credit fundamentals continue to look strong, although inflation could start to squeeze margins. Initial earnings reports from the third quarter are still strong. Corporations have record earnings, good margins, low multiples of debt to gross profits, low debt service and good liquidity. The consumer balance sheet now shows some of the lowest debt service on record as a percentage of disposal income. That reflects both low rates and government support during pandemic. Rising home prices and rising stock prices have both added to consumer net worth, also now at a record although not equally distributed across households. Consumers are also liquid, with near record amounts of cash in the bank. Strong credit fundamentals may explain some of the relatively stable spreads.