The Long and Short
Stay overweight communications, energy, industry
This material is a Marketing Communication and does not constitute Independent Investment Research.
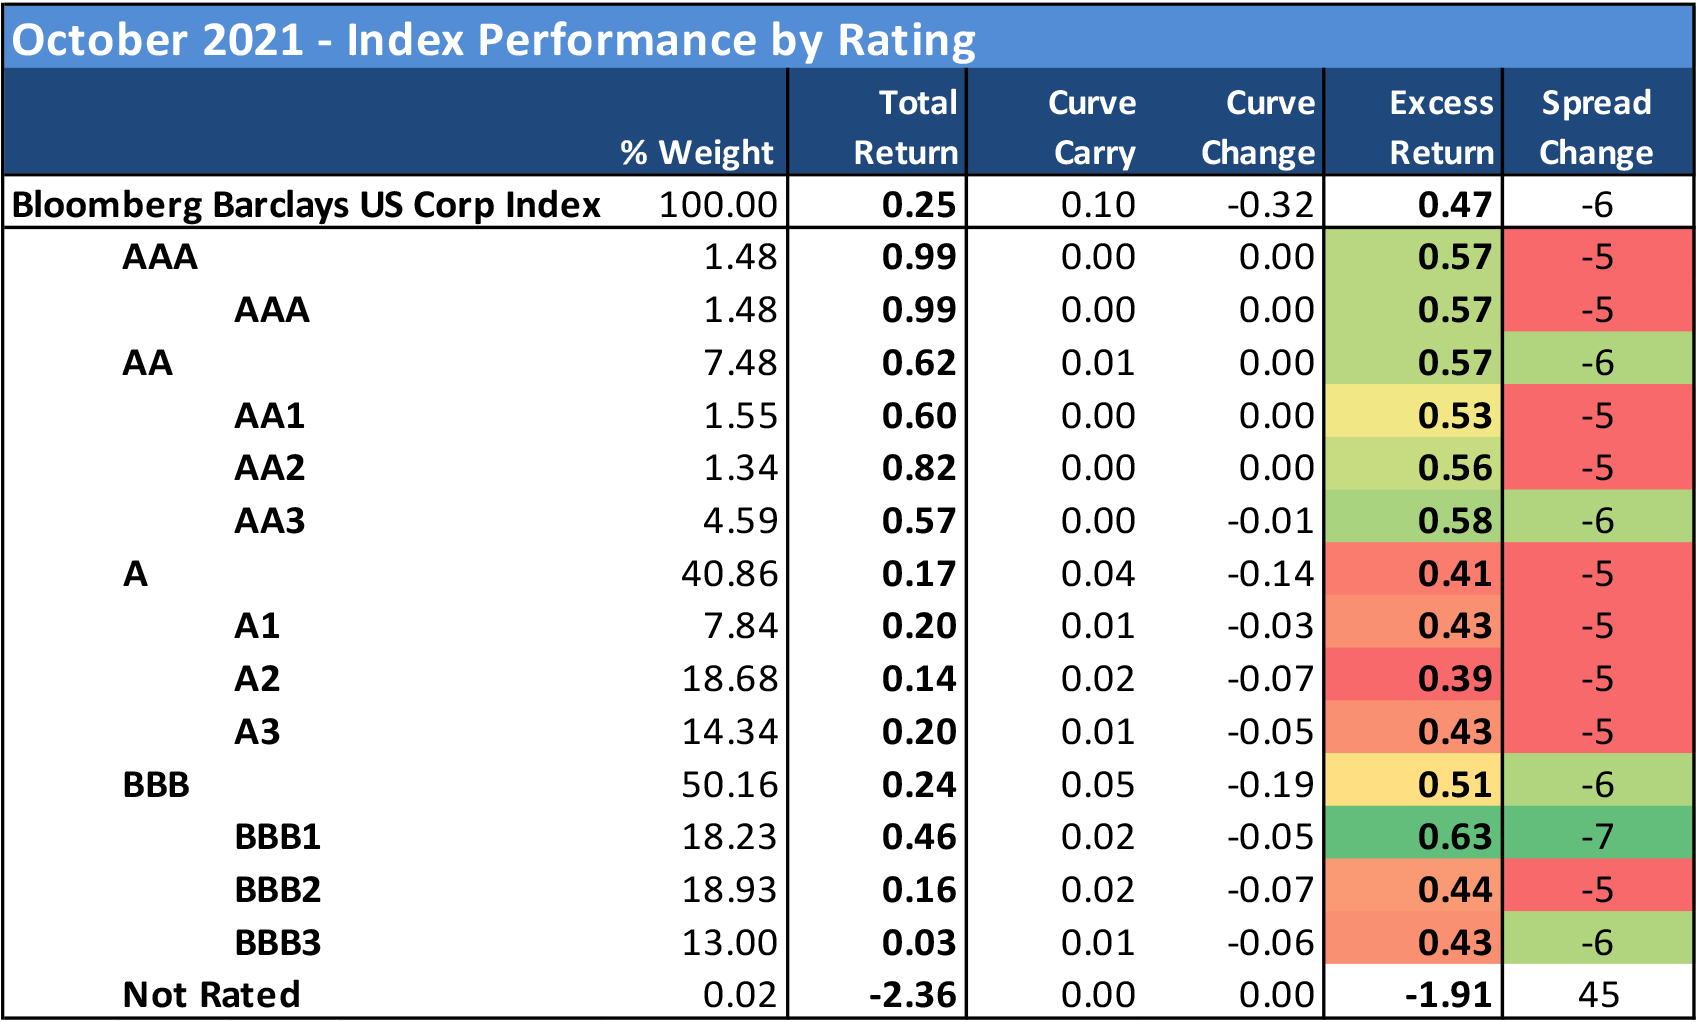
Investment grade corporate bonds ground tighter in October, even as investor preference appeared to shift to more stable, higher-rated credit. The Bloomberg Barclays Investment Grade Index tightened by 6 bp over the course of the month, resulting in excess return of 0.47% and a total return of 0.25% including the change in US Treasuries. The latest move brings the year-to-date spread change to -34 bp, which has generated a positive 2.78% in excess return versus the negative 1.02% total return for the IG sector.
Our sector weighting view recommendations remain unchanged for November. The two graphics below provide a summary of how APS expects sectors within the IG Index to perform for the next several months on an excess return basis (total return net of commensurate UST return). These weightings serve as a proxy for how we recommend that portfolio managers should position their holdings relative to the broad IG corporate bond market.
Exhibit 1 and 2. APS Sector Recommendations for November 2021
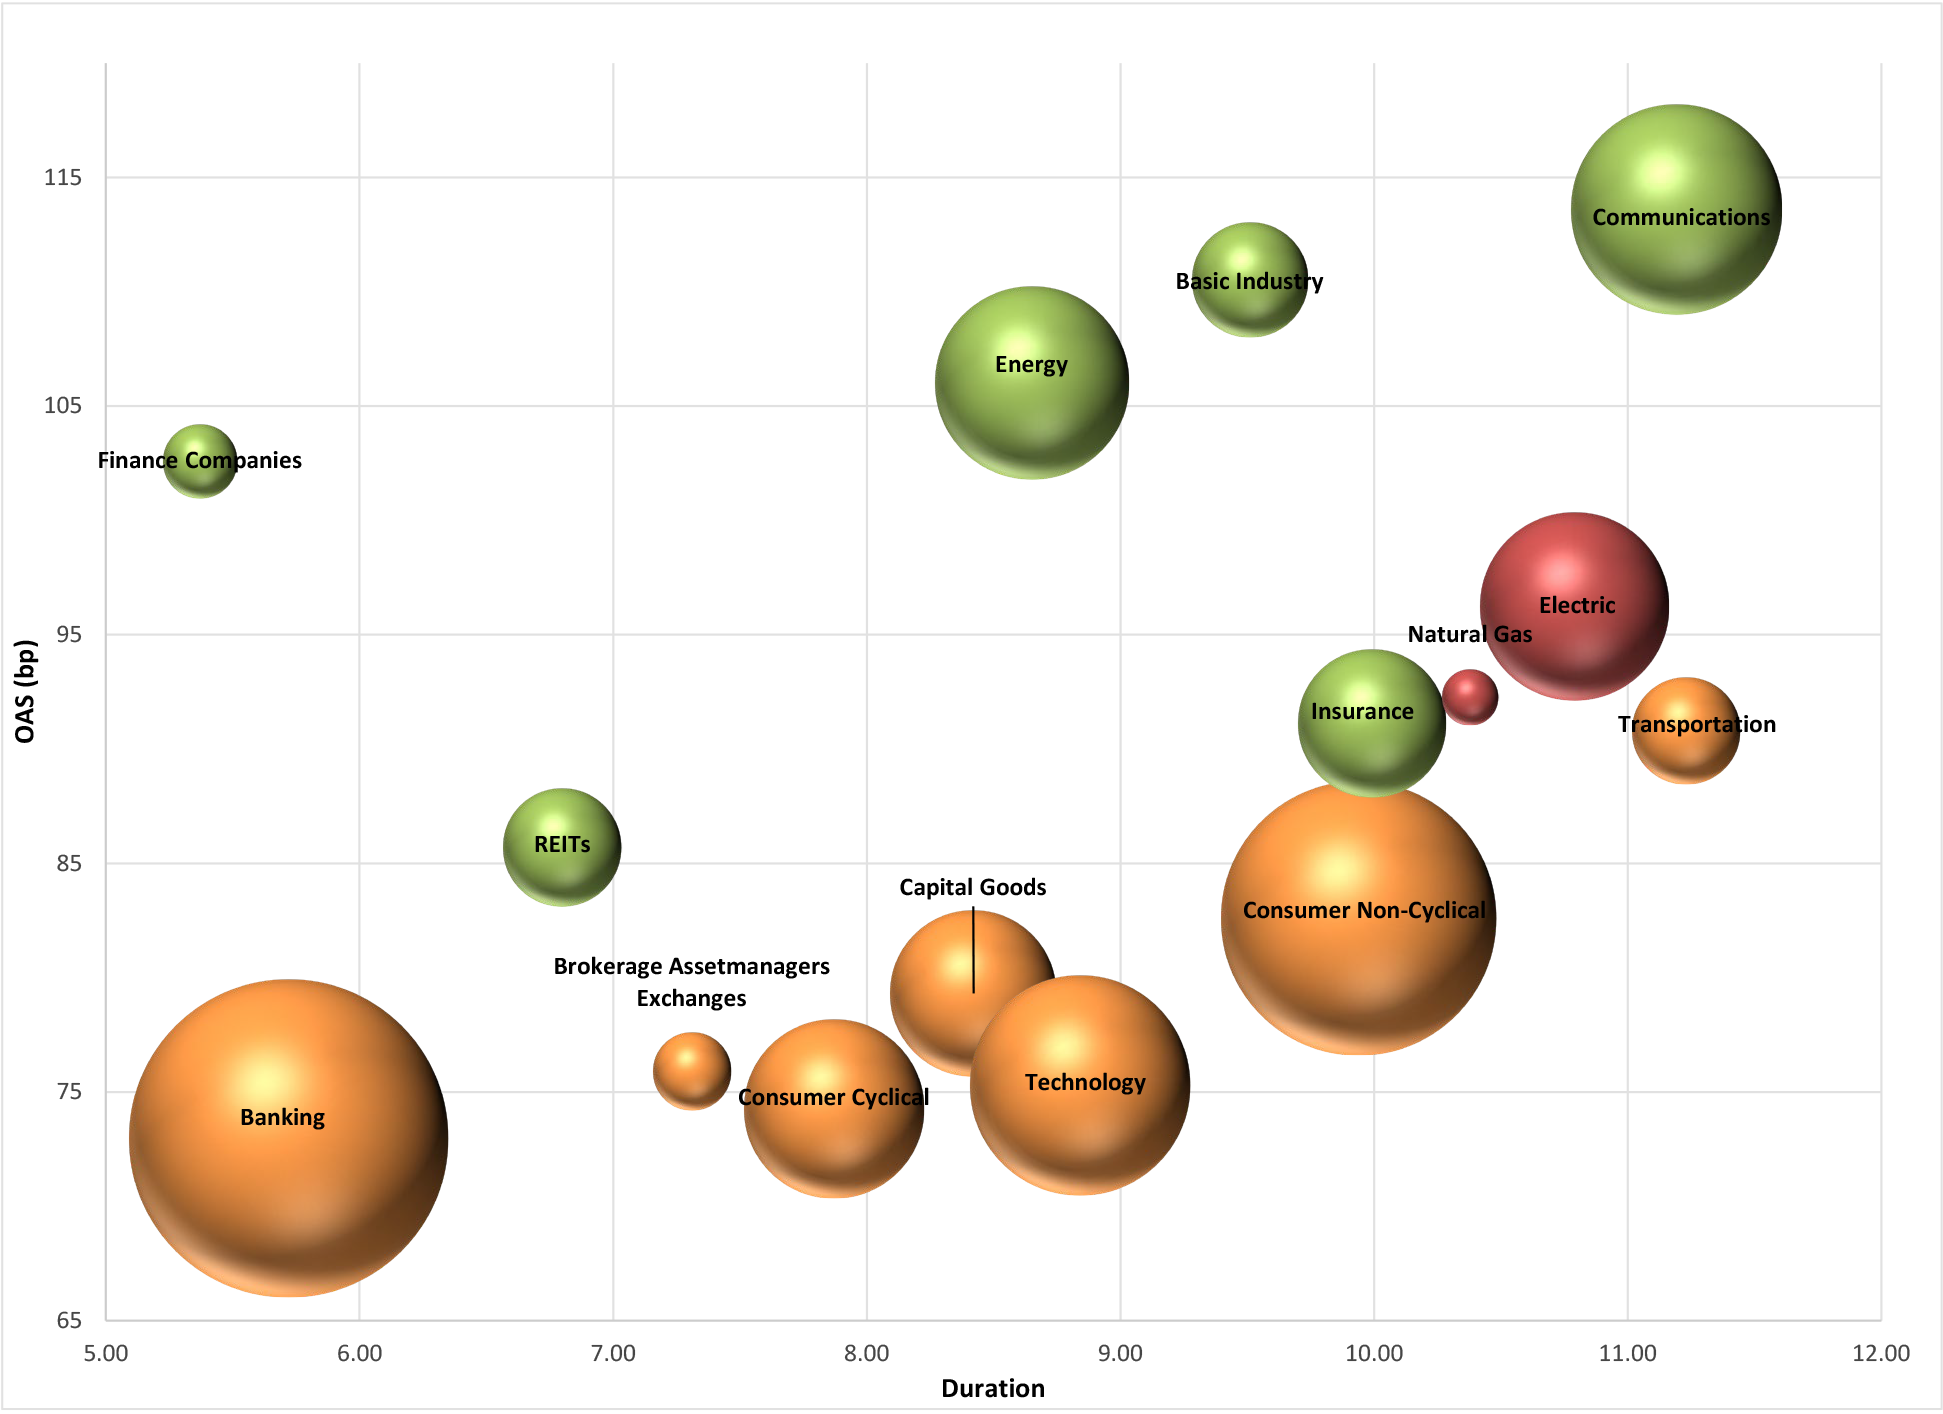
Source: Amherst Pierpont, Bloomberg/Barclays US Corp Index
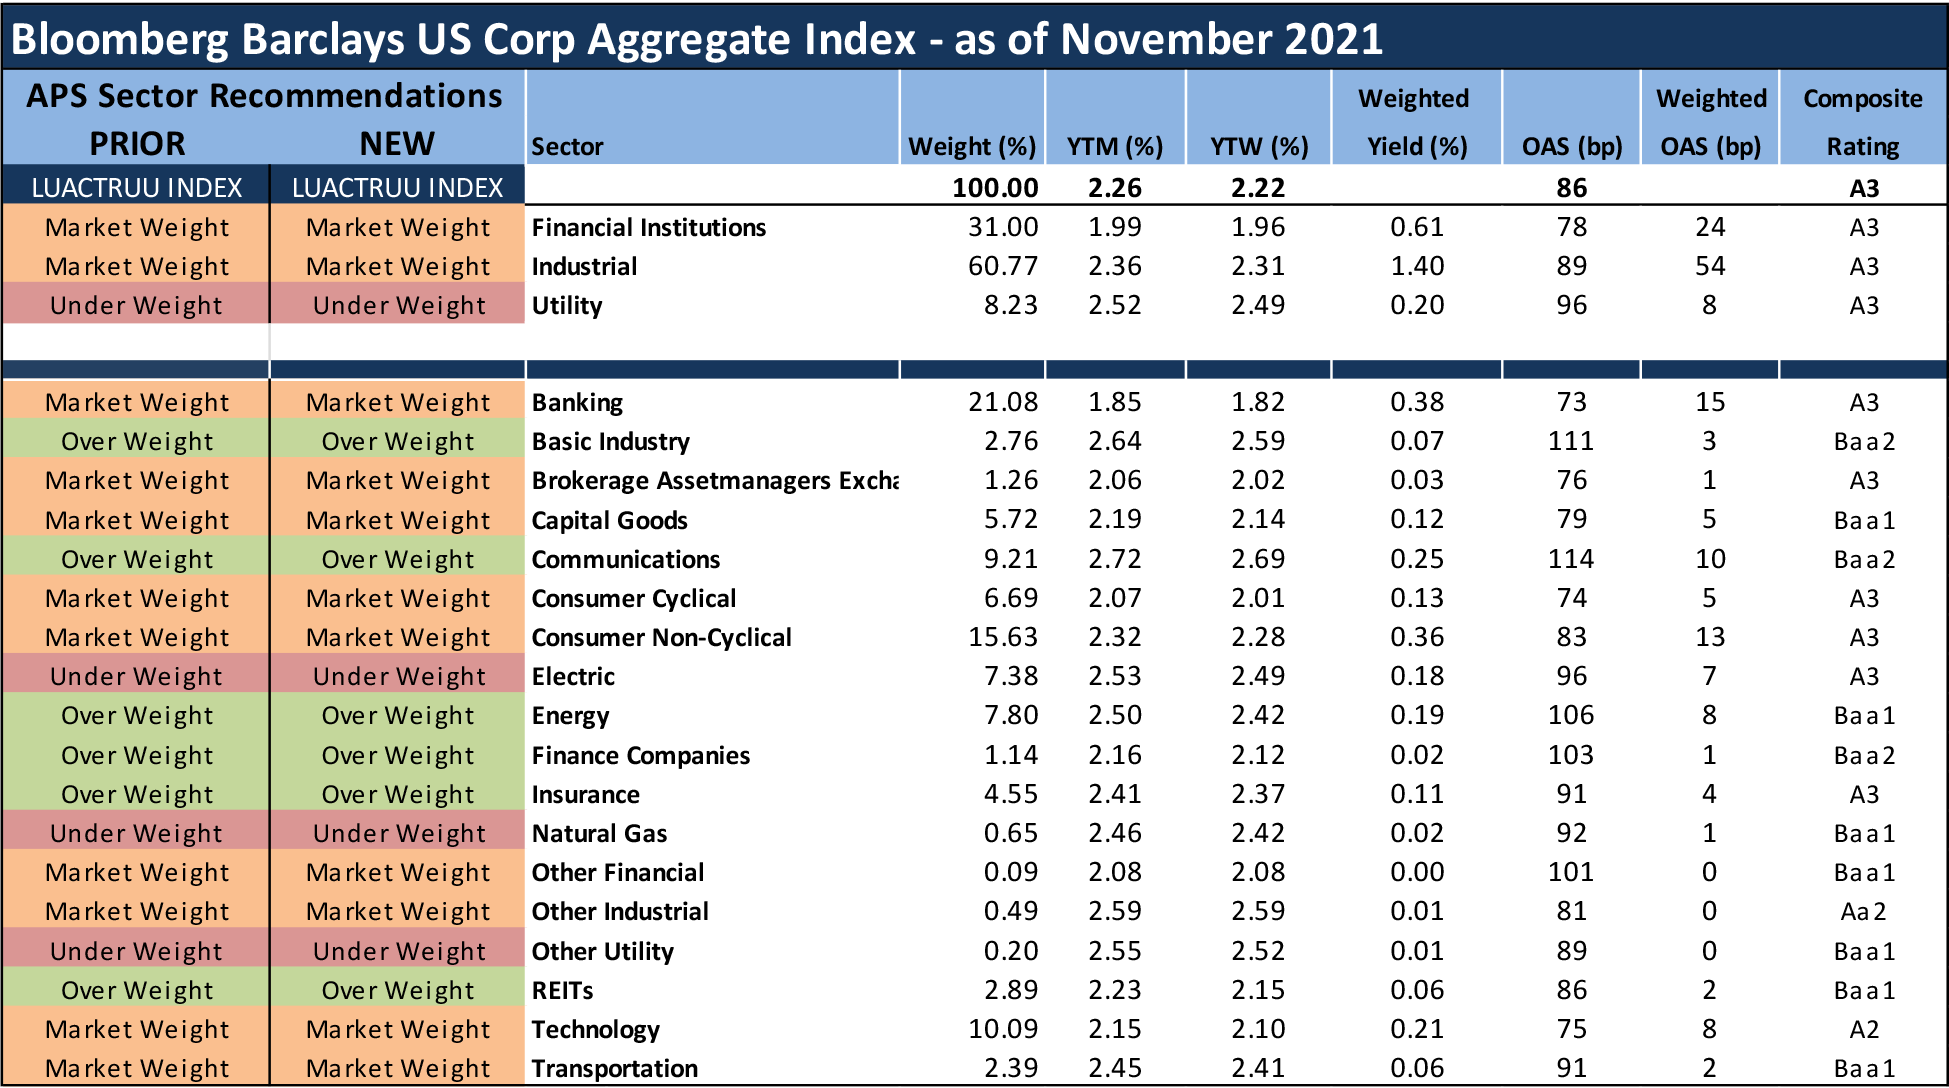
Color = recommendation: Green – Overweight, Red – Underweight, Yellow – Marketweight
Size = Market Value within the IG Index
Source: Amherst Pierpont, Bloomberg/Barclays US Corp Index
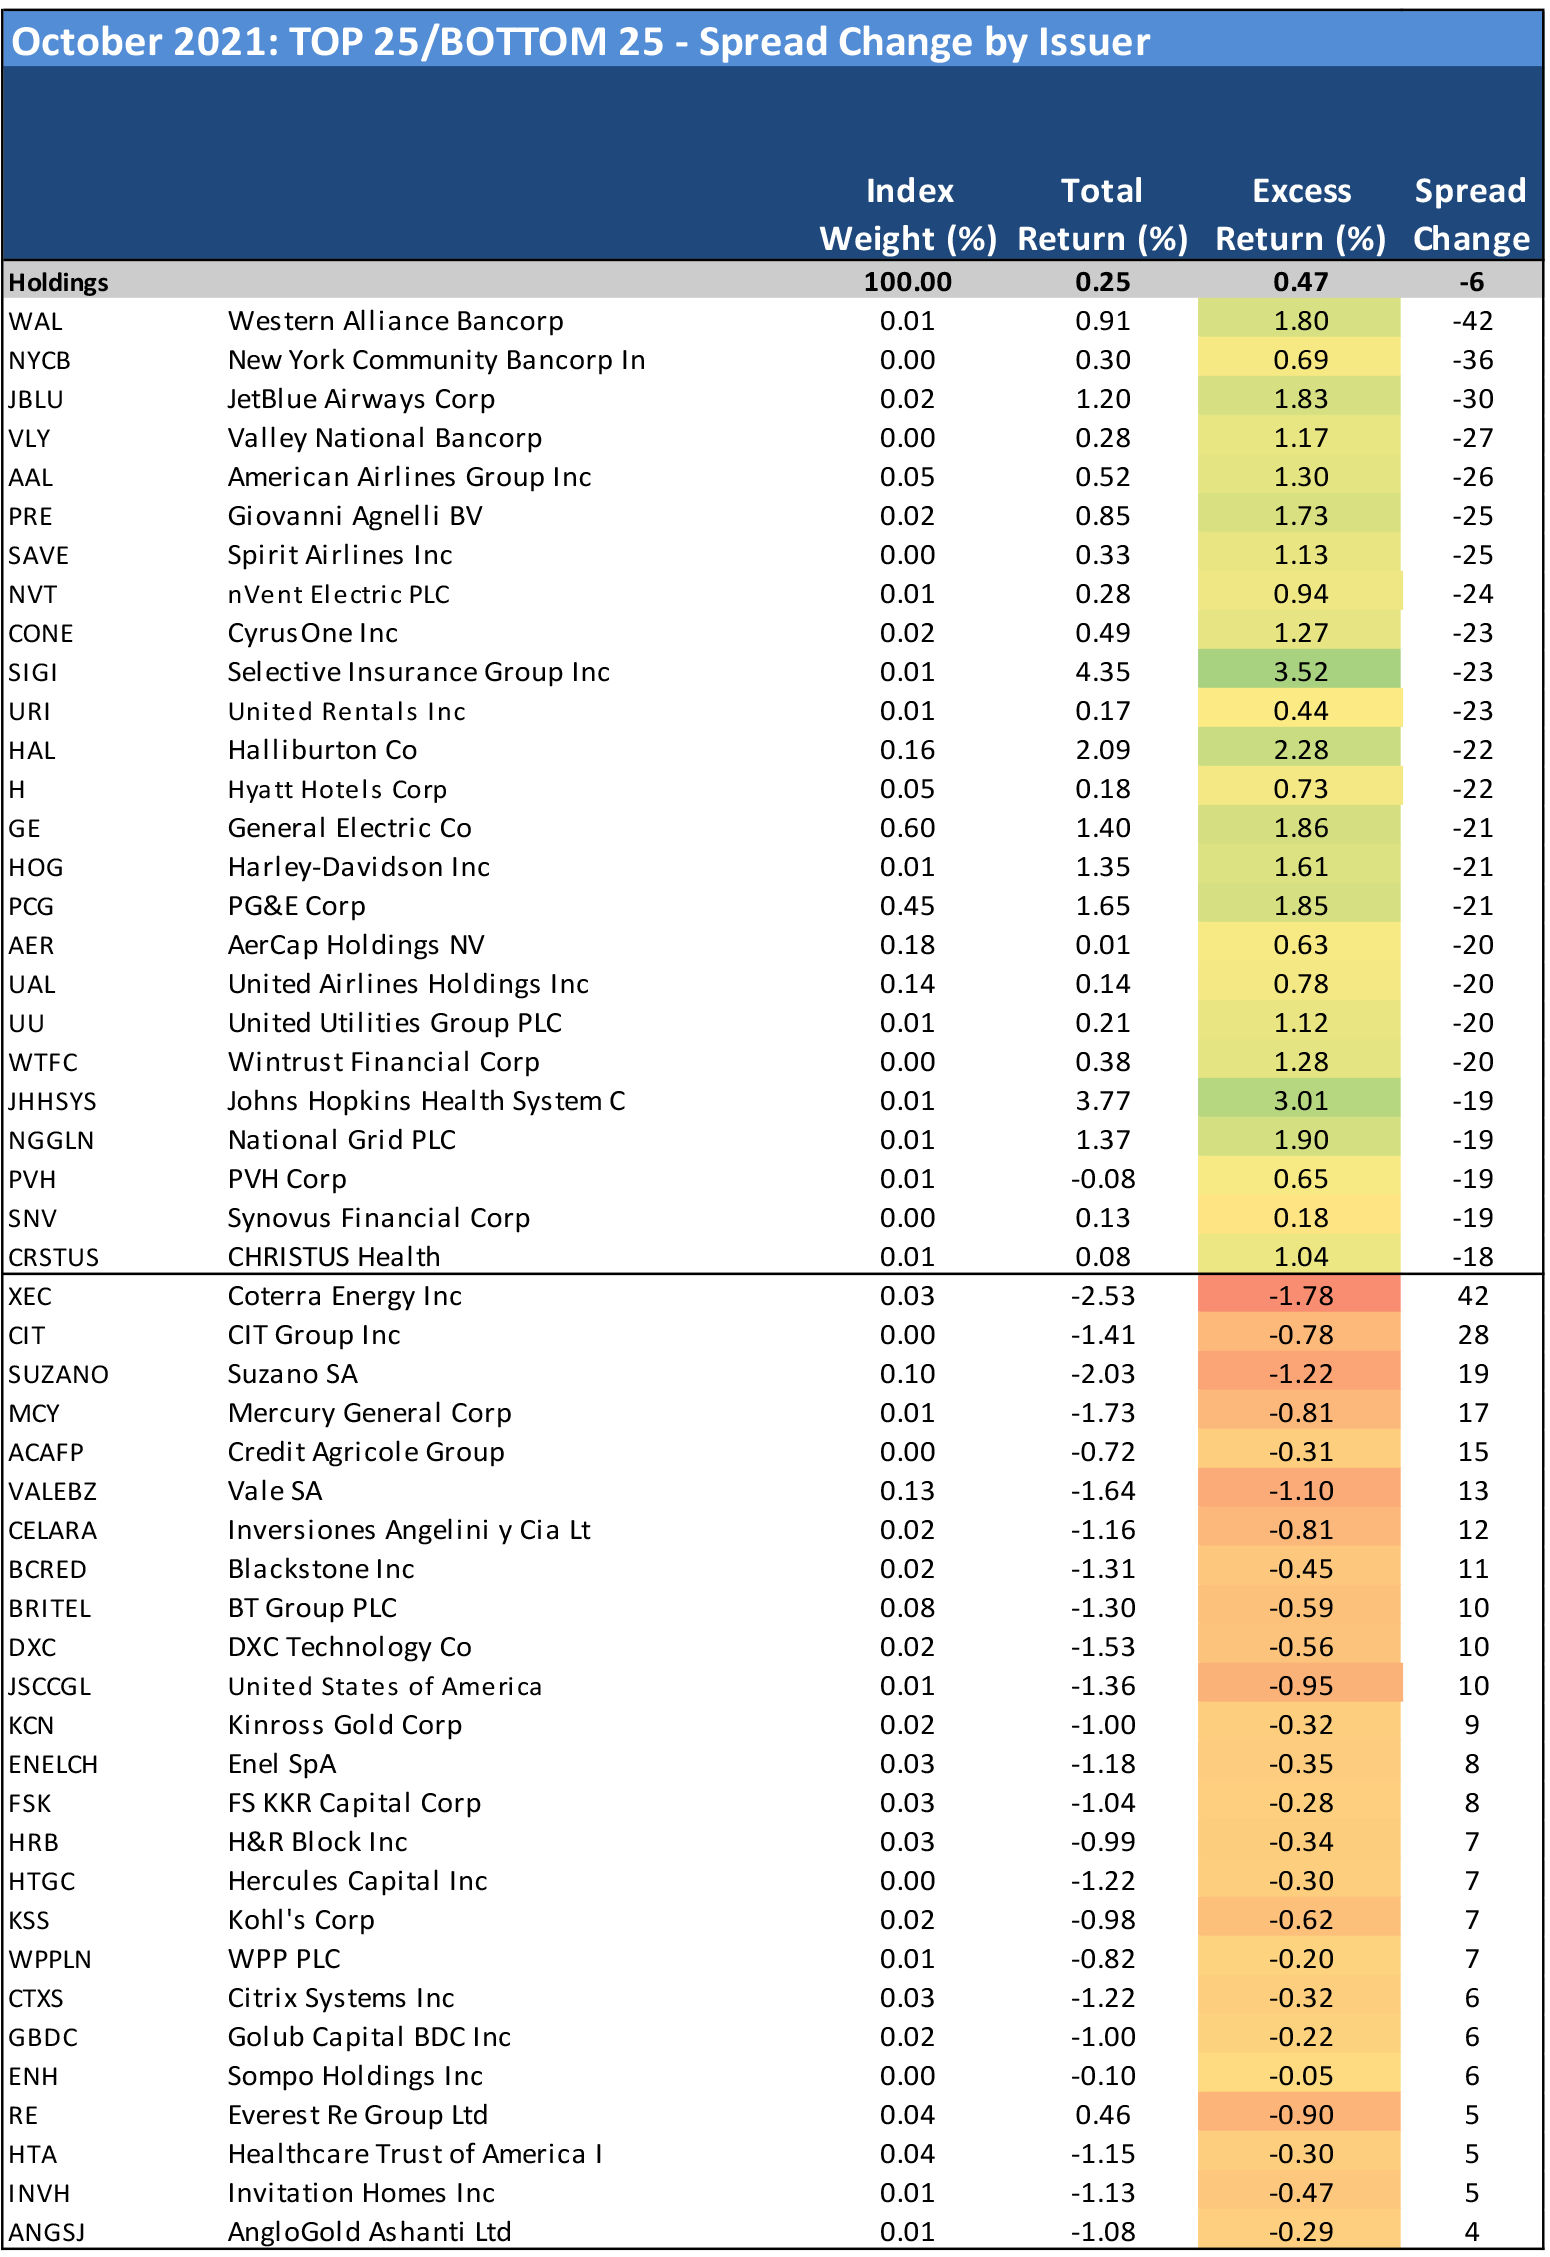
Transportation (1.05% excess return) provided the top performance in the index, aided by a continued recovery in airline paper. Other top performing market segments included electric utilities (0.77%), finance companies (0.70%), capital goods (0.68%) and energy (0.65%). Both finance companies and capital goods were given a boost by sharp trading in General Electric (GE: Baa1/BBB+/BBB) paper – in particular, the GE 2035s and 2025s issued by GE Capital Intl. Funding Co., which are classified in finance companies for index purposes. Investors believe these bonds are nearly certain to be a big part of GE’s next large debt tender, which could be approaching in a number of days with the closing of the AER/GECAS deal on November 1. GE bonds tightened as AerCap launched its $20 billion debt funding package and GE management guided the closing of the merger and reiterated its plans to allocate all proceeds to debt reduction. Under-performing sectors included banking (0.13%), broker/asset manager/exchange (0.31%), technology (0.36%), insurance (0.43%) and consumer cyclical (0.43%).
New issue volume for the IG corporate bond market well exceeded expectations at $120.8 billion in October and outpaced the prior year period for the first time in several months. October issuance was aided by the $20 billion AerCap (AER) mega-deal, as well as a very active string of jumbo post-earnings issues from Goldman Sachs ($9.75 billion), Morgan Stanley ($6.3 billion), Citigroup ($5.0 billion) and Bank of America (just shy at $4.55 bn). Banks have been more aggressive with late-year debt issuance than most were expecting; JPM is already back in the market with another debt deal on the first of November. The market is anticipating another $25 billion in supply this week to kick off the month of November, which is expected to bring $100 billion in total new issue volume. The high yield market tacked on an additional $34.5 billion in October and has vastly outpaced the prior year volume.
Exhibit 3. Supply Recap
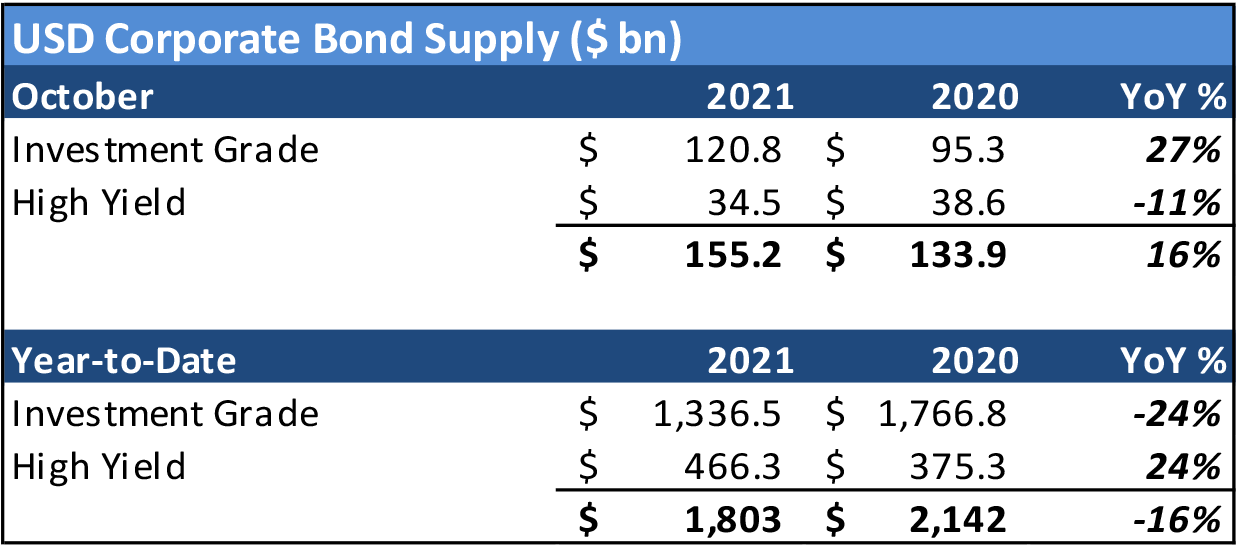
Source: Bloomberg LP
Exhibit 4. Transportation takes the top spot as airline paper rallies, while the banking sector sputters amidst an influx of supply
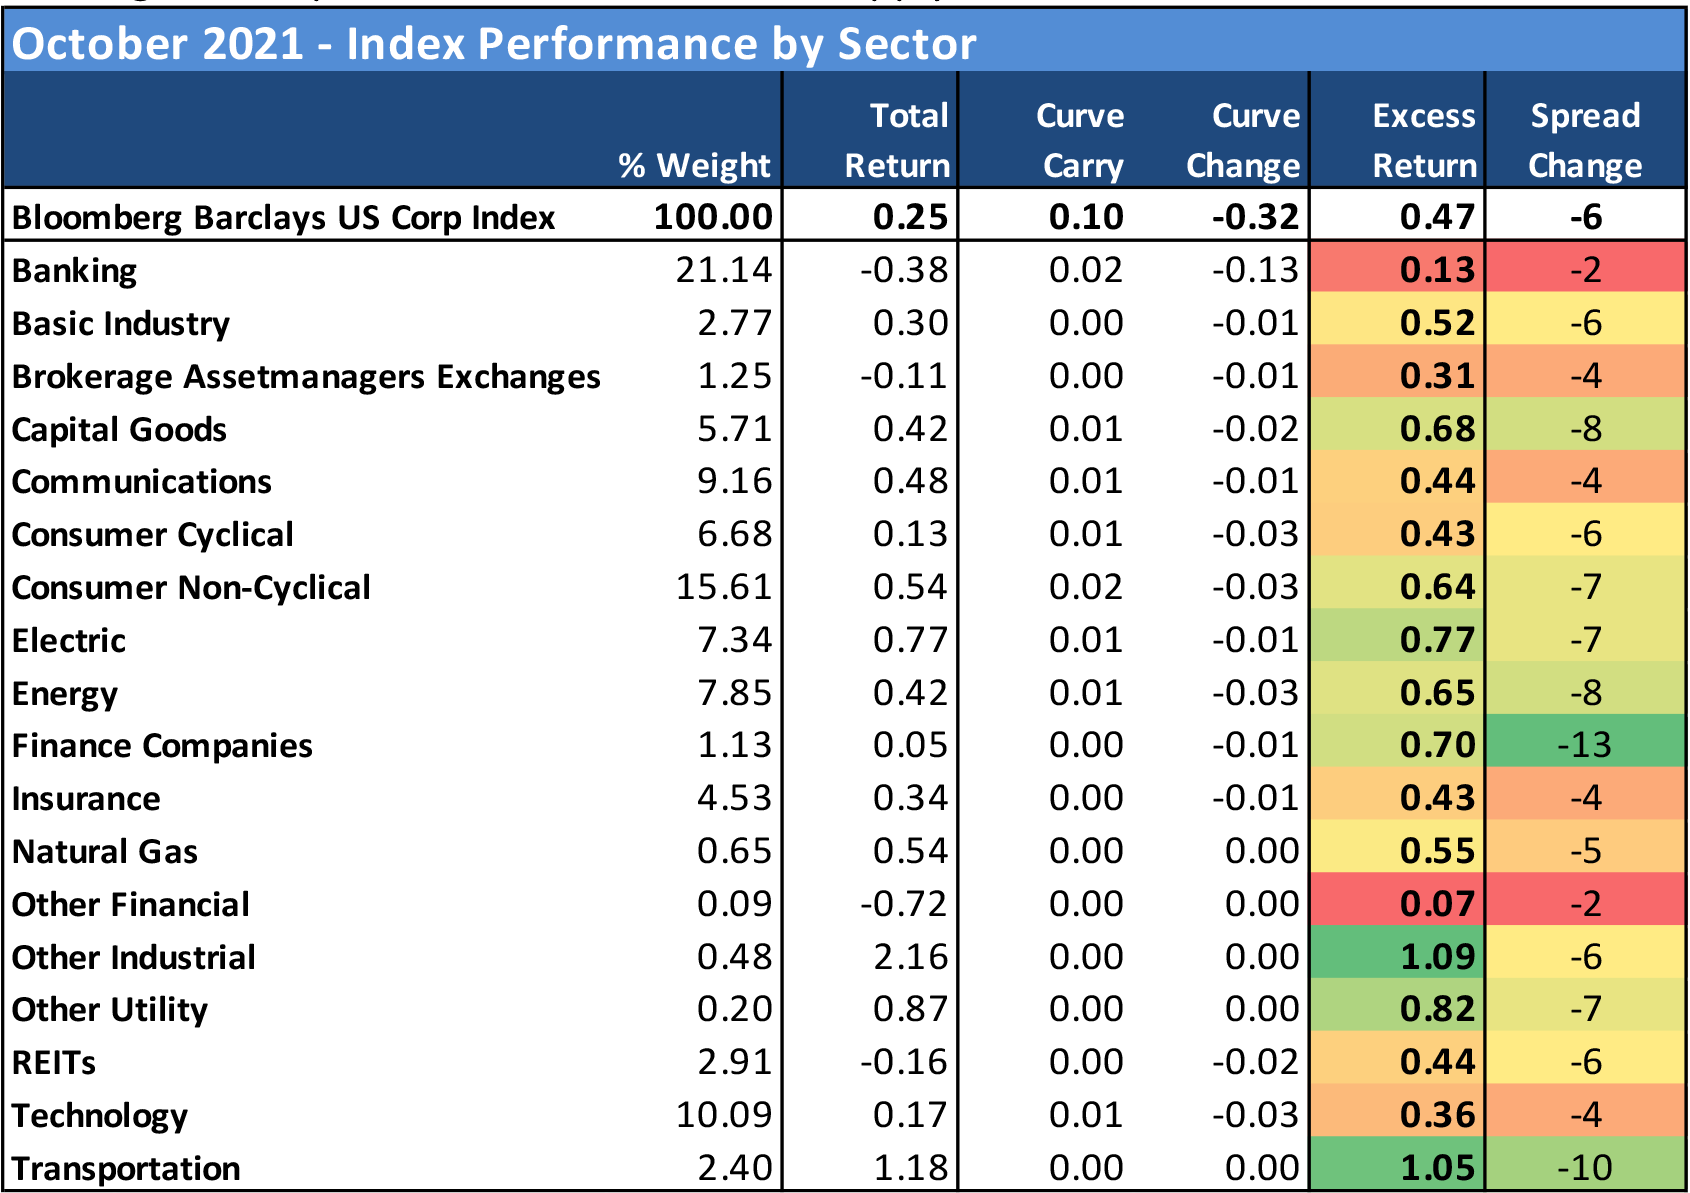
Source: Bloomberg Barclays US Corp Index
Exhibit 5. Investors appeared to target higher quality credit in October, though spread performance fairly evenly balanced across the credit curve
Source: Bloomberg Barclays US Corp Index
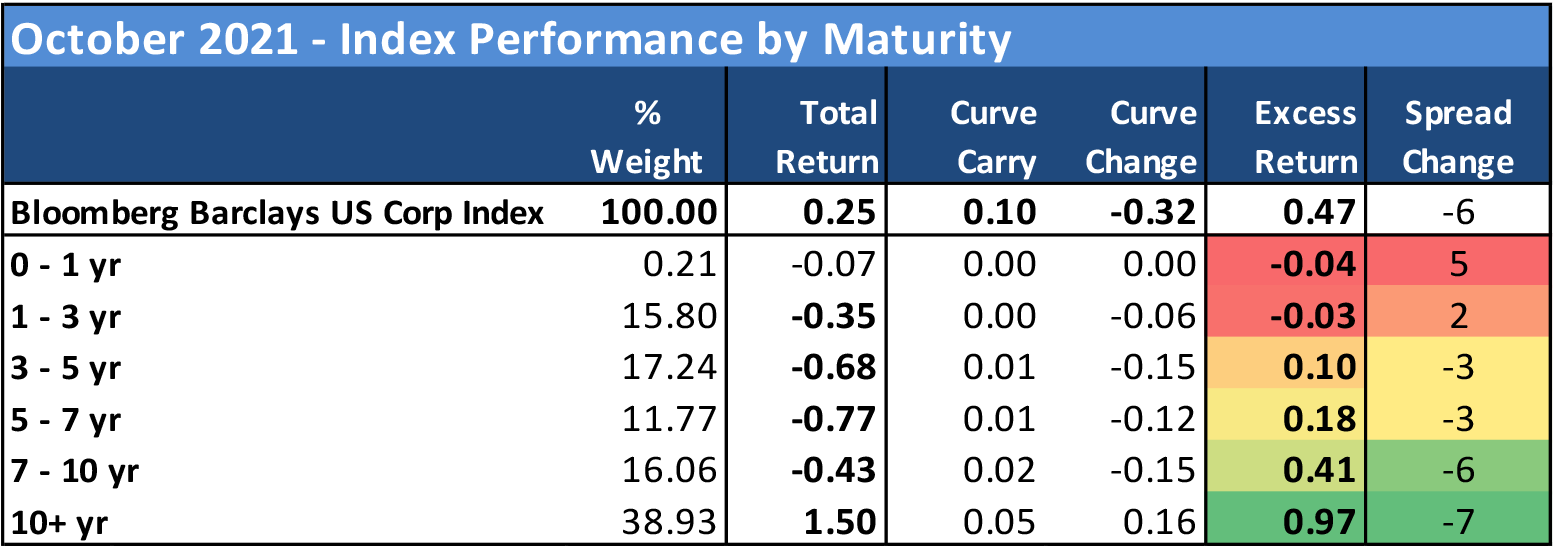
Exhibit 6. Long paper outperforms as the 10s/30s curve flattens in October
Source: Bloomberg Barclays US Corp Index
Exhibit 7. Regional banks and airlines among the top performers; GE tightens sharply as the awaited debt tender comes into focus
Source: Bloomberg Barclays US Corp Index
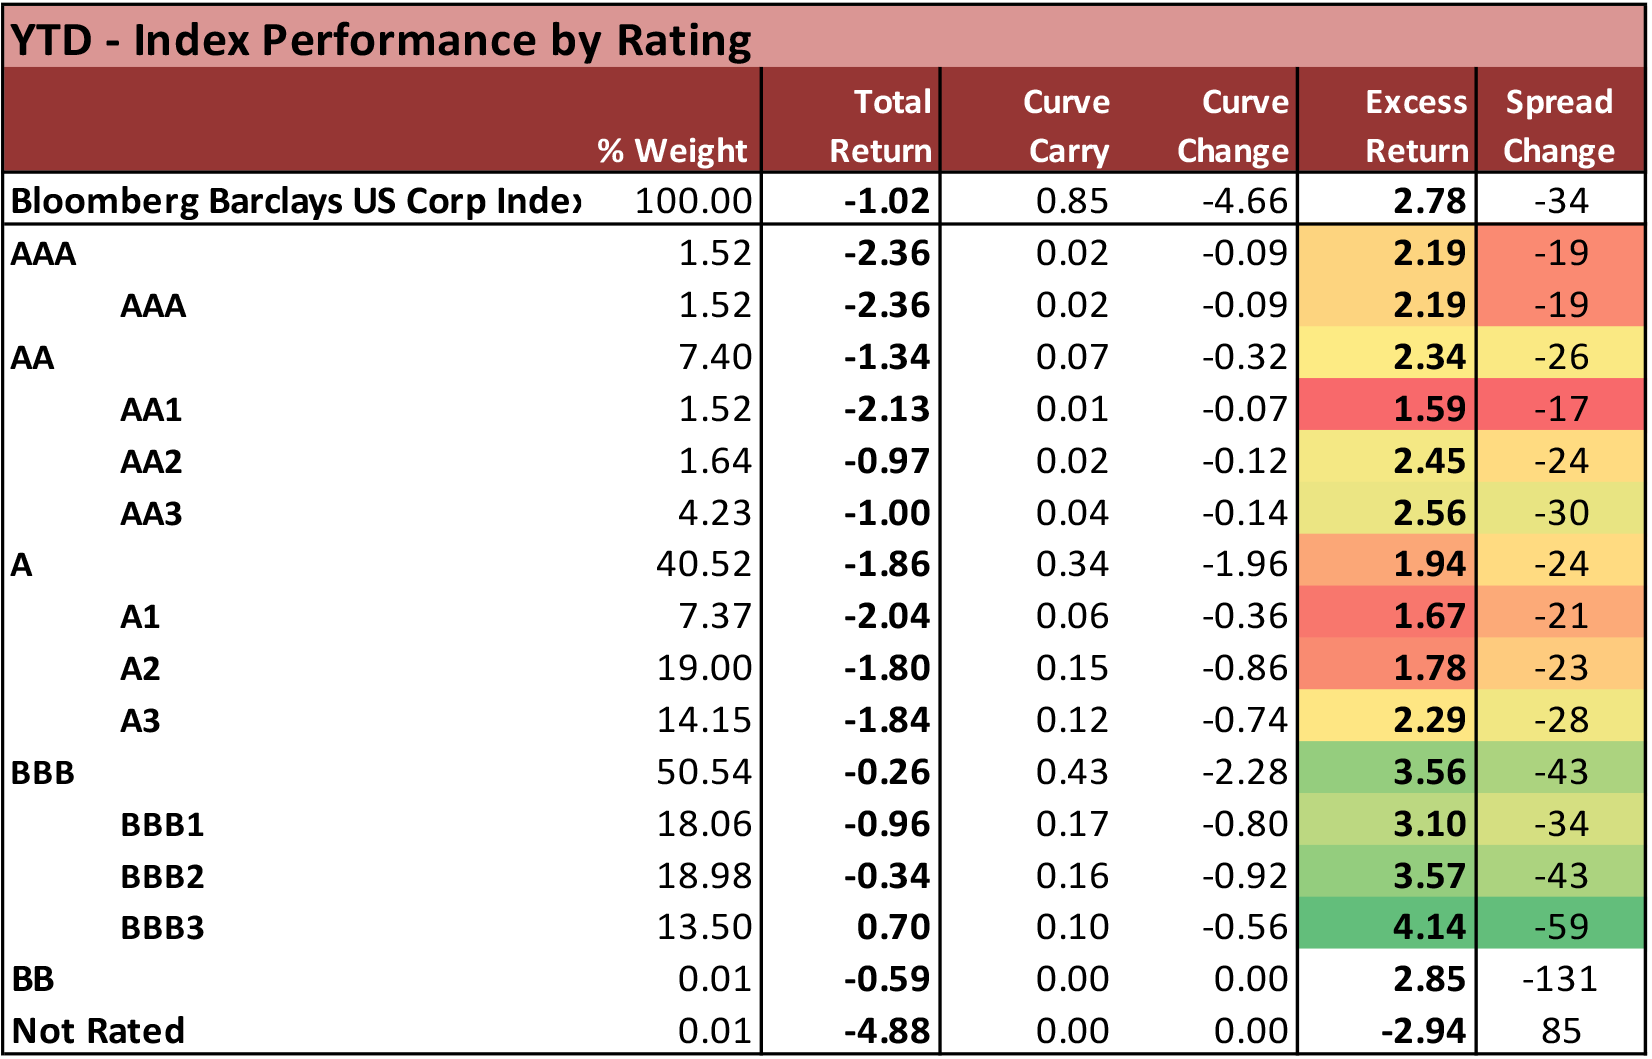
Year-to-Date Index Performances
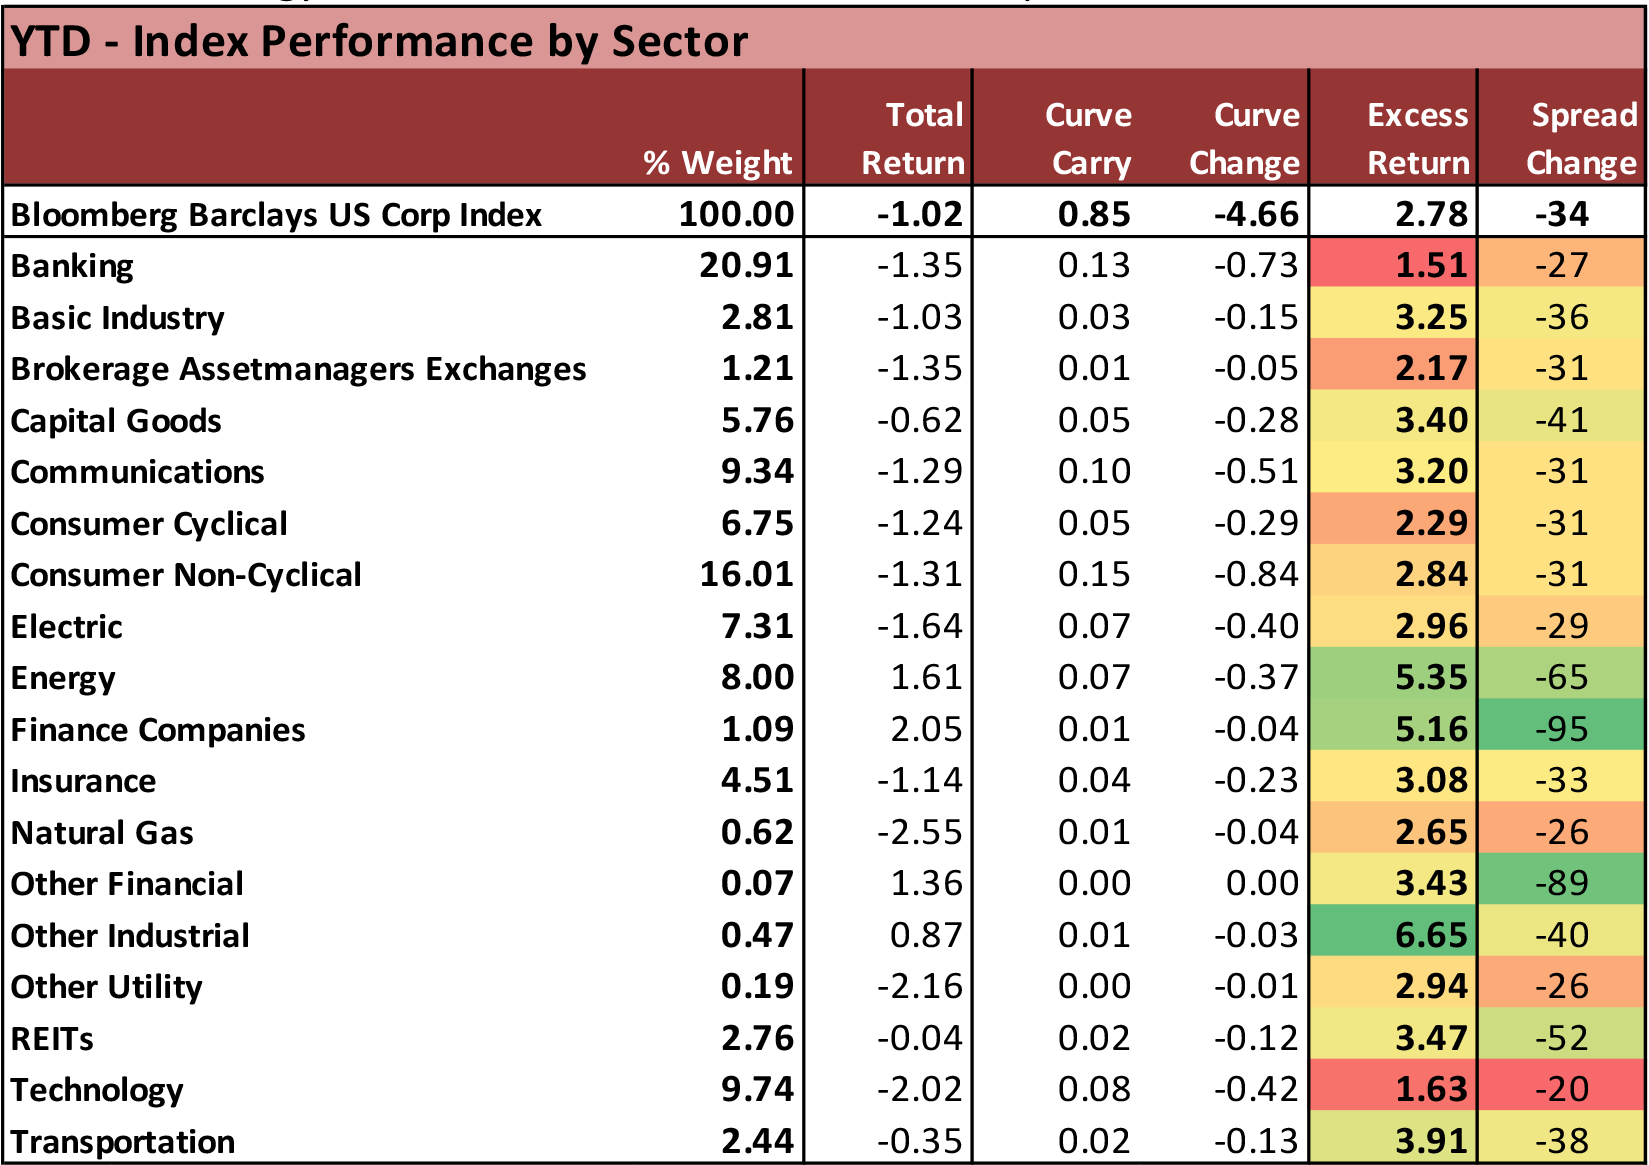
Exhibit 8. Energy and Finance Cos have remained the prominent trades YTD
Source: Bloomberg Barclays US Corp Index
Exhibit 9. Investors still sought higher-yielding, lower-rated credits YTD even as more recent preference has been for more stable credit quality
Source: Bloomberg Barclays US Corp Index
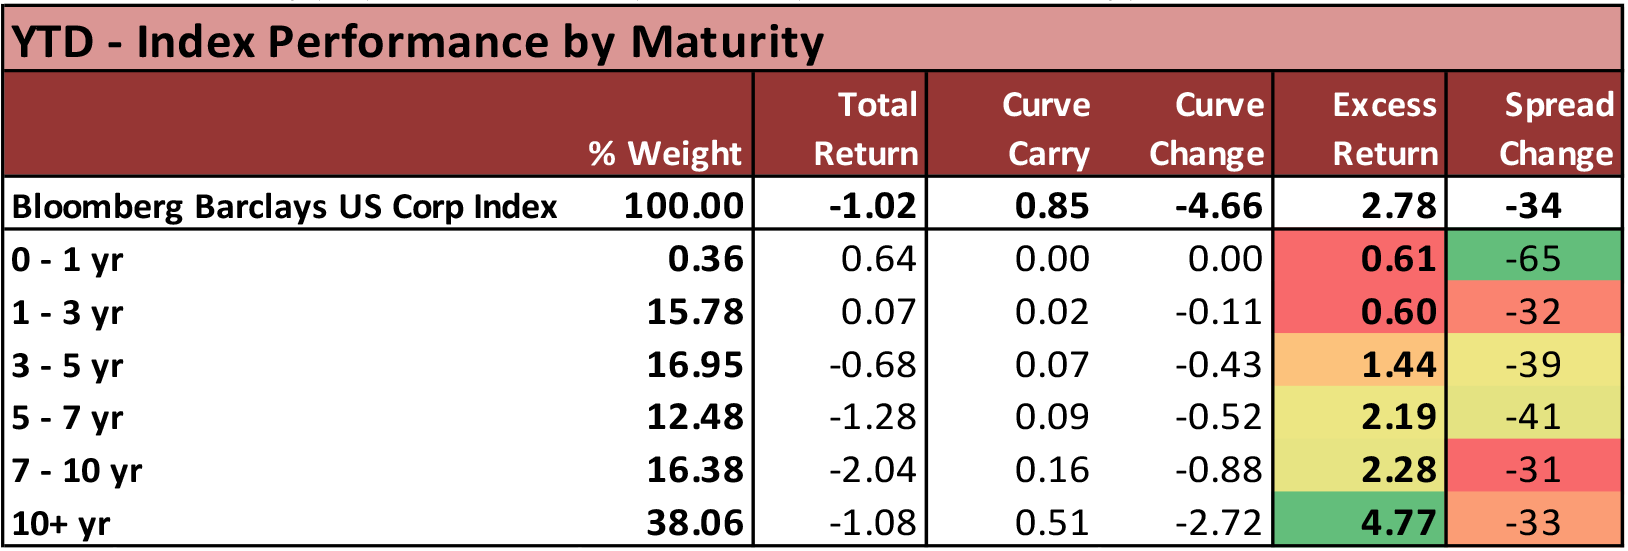
Exhibit 10. Long paper has held up as the preferred strategy YTD
Source: Bloomberg Barclays US Corp Index
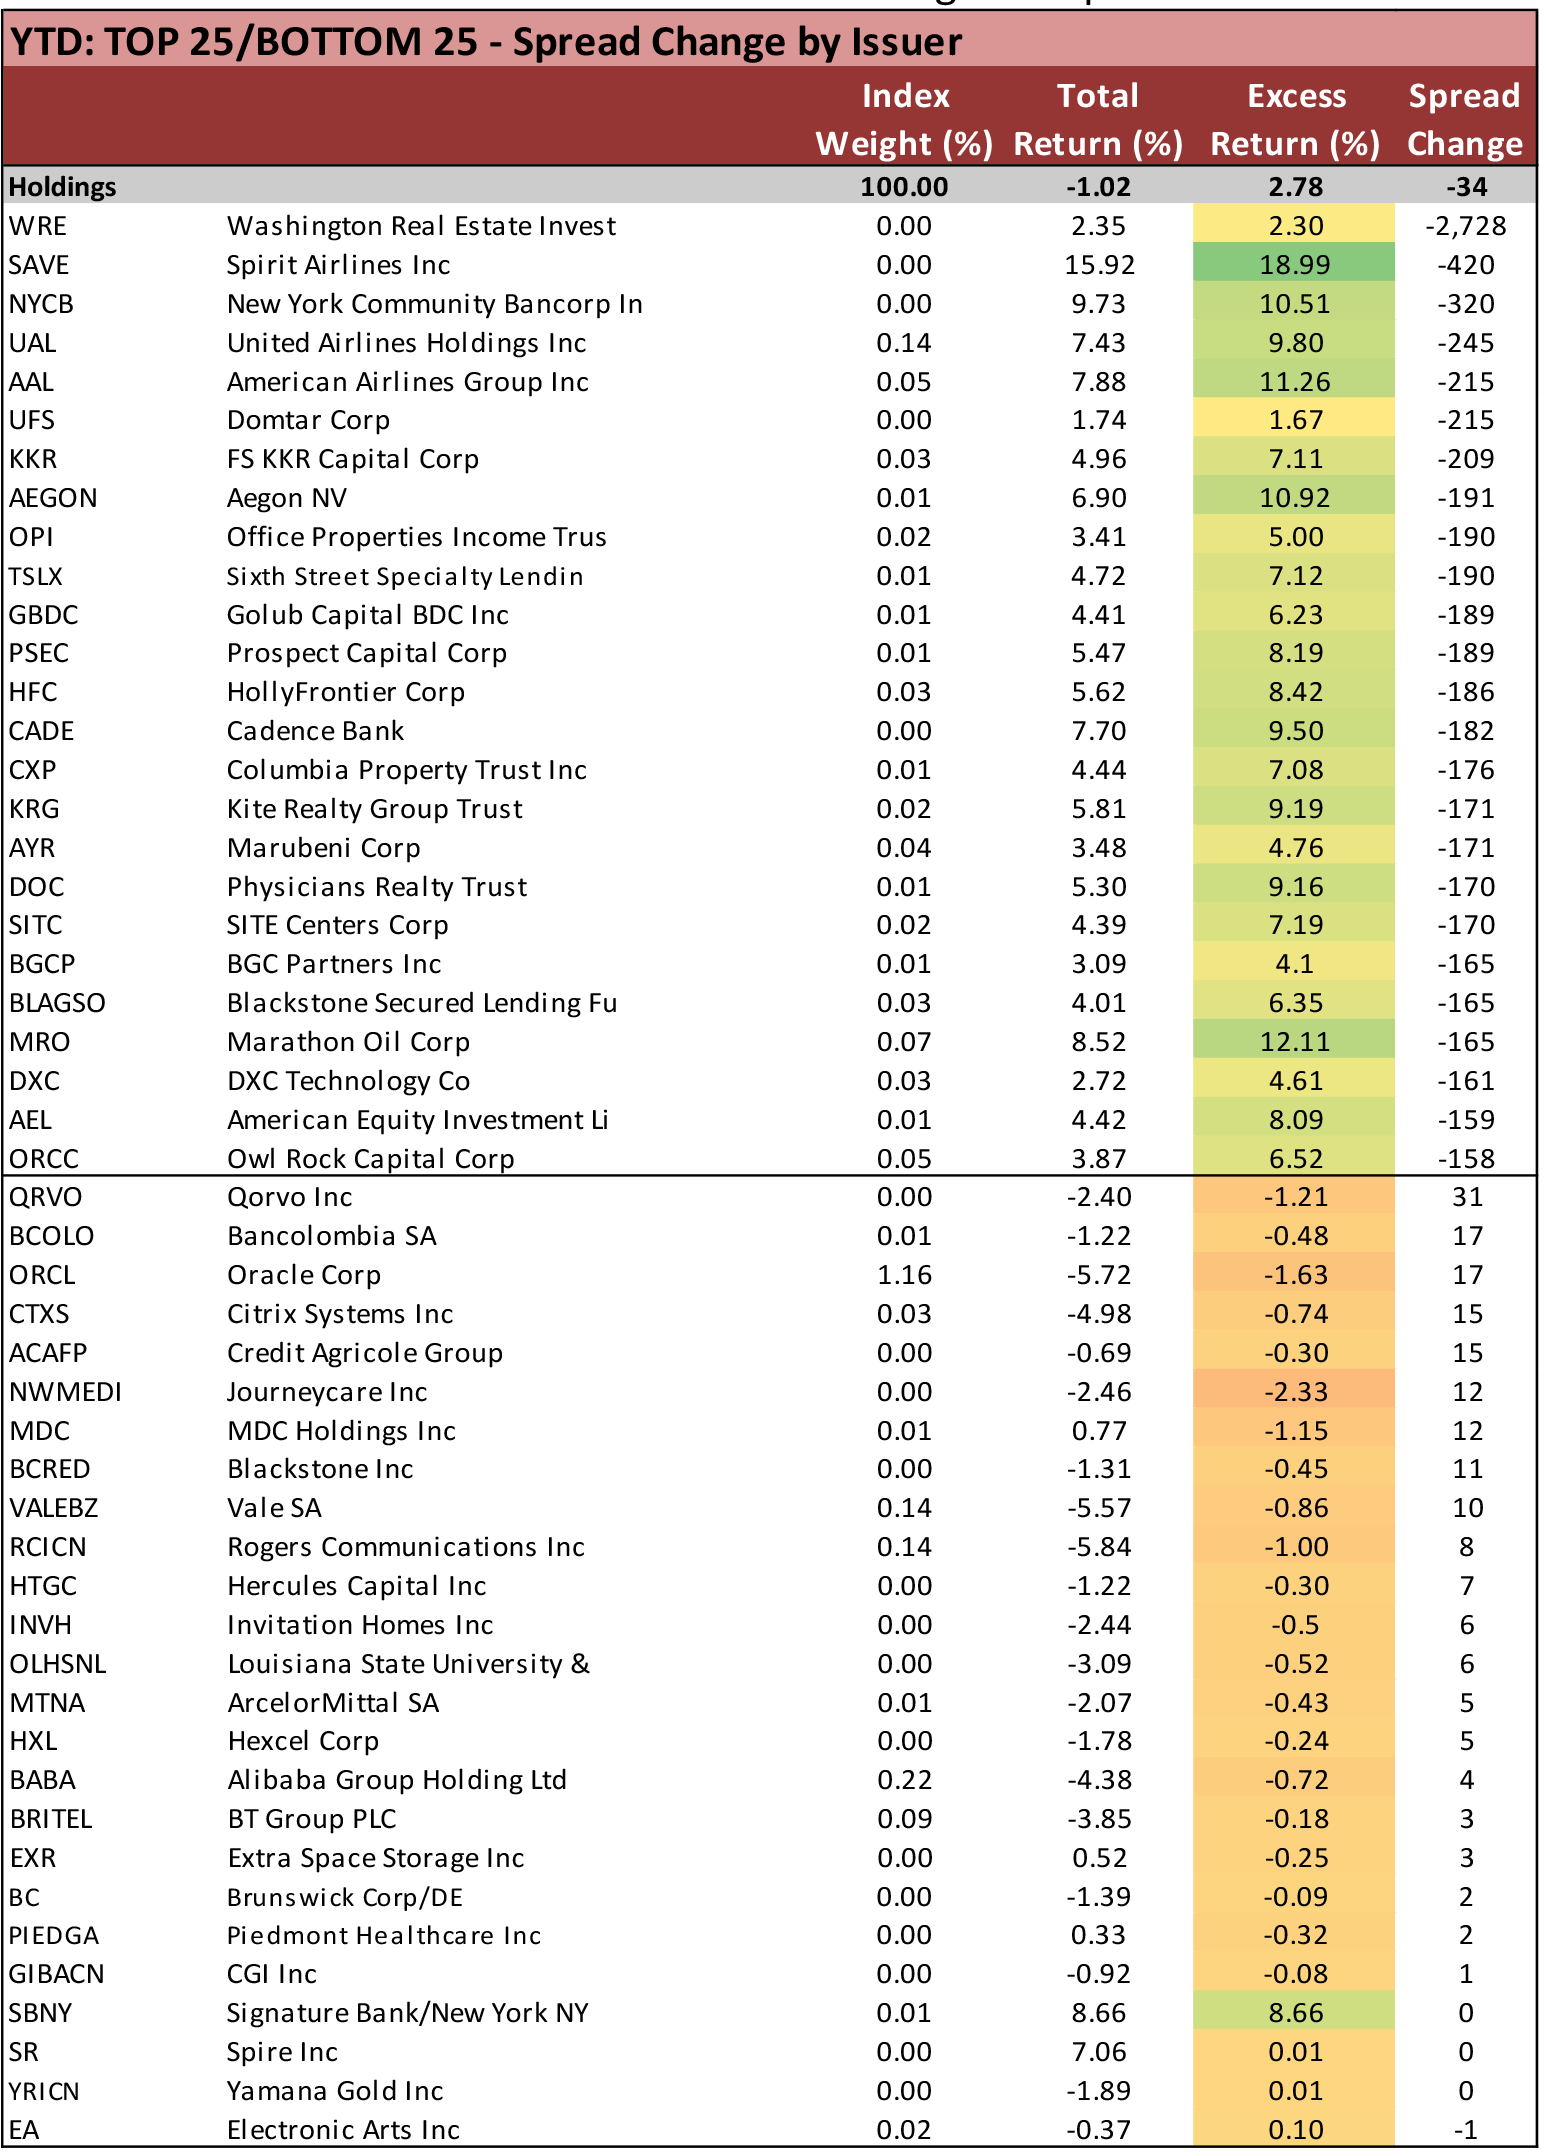
Exhibit 11. Airline credits and BDCs remain among the top credit trades of 2021
Source: Bloomberg Barclays US Corp Index
This material is intended only for institutional investors and does not carry all of the independence and disclosure standards of retail debt research reports. In the preparation of this material, the author may have consulted or otherwise discussed the matters referenced herein with one or more of SCM’s trading desks, any of which may have accumulated or otherwise taken a position, long or short, in any of the financial instruments discussed in or related to this material. Further, SCM may act as a market maker or principal dealer and may have proprietary interests that differ or conflict with the recipient hereof, in connection with any financial instrument discussed in or related to this material.
This message, including any attachments or links contained herein, is subject to important disclaimers, conditions, and disclosures regarding Electronic Communications, which you can find at https://portfolio-strategy.apsec.com/sancap-disclaimers-and-disclosures.
Important Disclaimers
Copyright © 2026 Santander US Capital Markets LLC and its affiliates (“SCM”). All rights reserved. SCM is a member of FINRA and SIPC. This material is intended for limited distribution to institutions only and is not publicly available. Any unauthorized use or disclosure is prohibited.
In making this material available, SCM (i) is not providing any advice to the recipient, including, without limitation, any advice as to investment, legal, accounting, tax and financial matters, (ii) is not acting as an advisor or fiduciary in respect of the recipient, (iii) is not making any predictions or projections and (iv) intends that any recipient to which SCM has provided this material is an “institutional investor” (as defined under applicable law and regulation, including FINRA Rule 4512 and that this material will not be disseminated, in whole or part, to any third party by the recipient.
The author of this material is an economist, desk strategist or trader. In the preparation of this material, the author may have consulted or otherwise discussed the matters referenced herein with one or more of SCM’s trading desks, any of which may have accumulated or otherwise taken a position, long or short, in any of the financial instruments discussed in or related to this material. Further, SCM or any of its affiliates may act as a market maker or principal dealer and may have proprietary interests that differ or conflict with the recipient hereof, in connection with any financial instrument discussed in or related to this material.
This material (i) has been prepared for information purposes only and does not constitute a solicitation or an offer to buy or sell any securities, related investments or other financial instruments, (ii) is neither research, a “research report” as commonly understood under the securities laws and regulations promulgated thereunder nor the product of a research department, (iii) or parts thereof may have been obtained from various sources, the reliability of which has not been verified and cannot be guaranteed by SCM, (iv) should not be reproduced or disclosed to any other person, without SCM’s prior consent and (v) is not intended for distribution in any jurisdiction in which its distribution would be prohibited.
In connection with this material, SCM (i) makes no representation or warranties as to the appropriateness or reliance for use in any transaction or as to the permissibility or legality of any financial instrument in any jurisdiction, (ii) believes the information in this material to be reliable, has not independently verified such information and makes no representation, express or implied, with regard to the accuracy or completeness of such information, (iii) accepts no responsibility or liability as to any reliance placed, or investment decision made, on the basis of such information by the recipient and (iv) does not undertake, and disclaims any duty to undertake, to update or to revise the information contained in this material.
Unless otherwise stated, the views, opinions, forecasts, valuations, or estimates contained in this material are those solely of the author, as of the date of publication of this material, and are subject to change without notice. The recipient of this material should make an independent evaluation of this information and make such other investigations as the recipient considers necessary (including obtaining independent financial advice), before transacting in any financial market or instrument discussed in or related to this material.
Important disclaimers for clients in the EU and UK
This publication has been prepared by Trading Desk Strategists within the Sales and Trading functions of Santander US Capital Markets LLC (“SanCap”), the US registered broker-dealer of Santander Corporate & Investment Banking. This communication is distributed in the EEA by Banco Santander S.A., a credit institution registered in Spain and authorised and regulated by the Bank of Spain and the CNMV. Any EEA recipient of this communication that would like to affect any transaction in any security or issuer discussed herein should do so with Banco Santander S.A. or any of its affiliates (together “Santander”). This communication has been distributed in the UK by Banco Santander, S.A.’s London branch, authorised by the Bank of Spain and subject to regulatory oversight on certain matters by the Financial Conduct Authority (FCA) and the Prudential Regulation Authority (PRA).
The publication is intended for exclusive use for Professional Clients and Eligible Counterparties as defined by MiFID II and is not intended for use by retail customers or for any persons or entities in any jurisdictions or country where such distribution or use would be contrary to local law or regulation.
This material is not a product of Santander´s Research Team and does not constitute independent investment research. This is a marketing communication and may contain ¨investment recommendations¨ as defined by the Market Abuse Regulation 596/2014 ("MAR"). This publication has not been prepared in accordance with legal requirements designed to promote the independence of research and is not subject to any prohibition on dealing ahead of the dissemination of investment research. The author, date and time of the production of this publication are as indicated herein.
This publication does not constitute investment advice and may not be relied upon to form an investment decision, nor should it be construed as any offer to sell or issue or invitation to purchase, acquire or subscribe for any instruments referred herein. The publication has been prepared in good faith and based on information Santander considers reliable as of the date of publication, but Santander does not guarantee or represent, express or implied, that such information is accurate or complete. All estimates, forecasts and opinions are current as at the date of this publication and are subject to change without notice. Unless otherwise indicated, Santander does not intend to update this publication. The views and commentary in this publication may not be objective or independent of the interests of the Trading and Sales functions of Santander, who may be active participants in the markets, investments or strategies referred to herein and/or may receive compensation from investment banking and non-investment banking services from entities mentioned herein. Santander may trade as principal, make a market or hold positions in instruments (or related derivatives) and/or hold financial interest in entities discussed herein. Santander may provide market commentary or trading strategies to other clients or engage in transactions which may differ from views expressed herein. Santander may have acted upon the contents of this publication prior to you having received it.
This publication is intended for the exclusive use of the recipient and must not be reproduced, redistributed or transmitted, in whole or in part, without Santander’s consent. The recipient agrees to keep confidential at all times information contained herein.


