


By the Numbers
Strong pandemic credit performance so far in agency multifamily
Mary Beth Fisher, PhD | October 15, 2021
This document is intended for institutional investors and is not subject to all of the independence and disclosure standards applicable to debt research reports prepared for retail investors. This material does not constitute research.
After 18 months of pandemic, the impact on Fannie Mae and Freddie Mac multifamily portfolios is coming into sharper focus. A trickle of loans has completed workout based on Fannie Mae’s recent update of its multifamily loan performance database. Default rates remain exceptionally low compared to the 2008 housing crisis, though a considerable number of loans are still in forbearance. Loss severities range widely depending on liquidation method, with a slightly troubling trend of rising severities for loans that go through foreclosure. Student housing shows the highest default rate but the lowest loss severity among multifamily properties.
Fannie Mae recently updated its multifamily loan performance database through the second quarter of 2021. The rate of defaults across vintages remains exceptionally low compared to the default rates reached during the housing crisis (Exhibit 1). The 2007 vintage still stands out as having the highest default rate of 5.5%, followed closely by the 2008 vintage with 5.1% of loans defaulting with losses. Recent vintages have so far had default rates between 0.1% and 0.4% of loans.
Exhibit 1: Fannie Mae multifamily performance summary
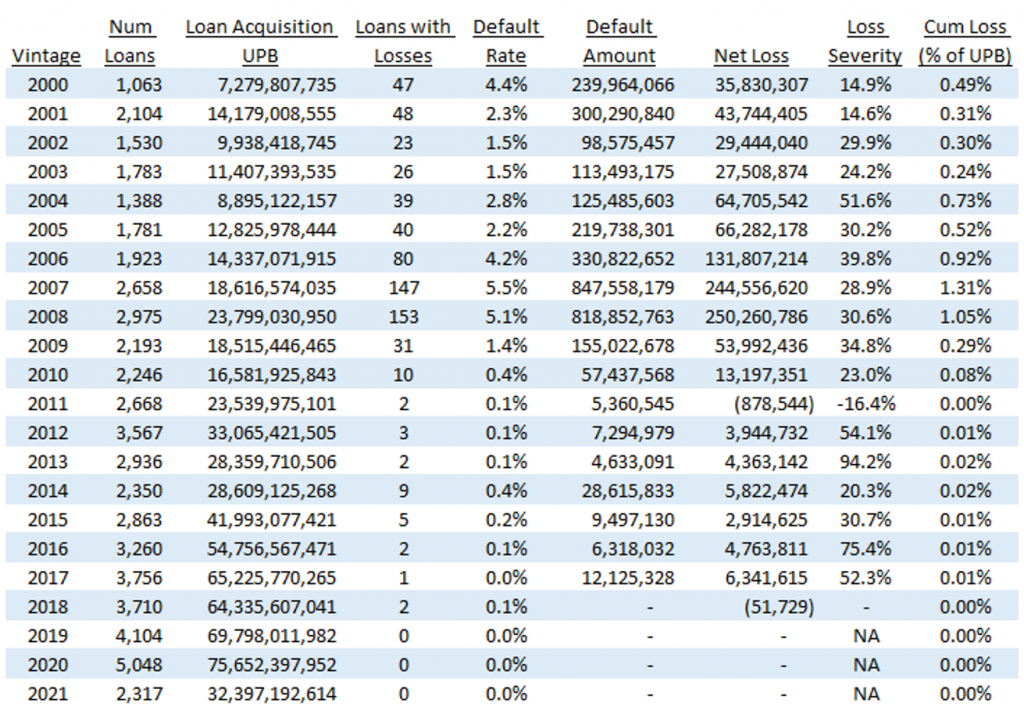
Note: Data thru Q2 2021.
Source: Fannie Mae, Amherst Pierpont Securities
The forbearance programs implemented during the pandemic have so far managed to keep default rates very low. Exhibit 2 shows the number of Fannie Mae multifamily loans that have defaulted each year since 2000.The housing and financial crisis that began in 2007 produced a wave of defaults that lasted from 2009 to 2015, peaking in 2013. That wave of defaults was somewhat extended due to the long time some loans spent in special servicing and as real estate owned before finally being resolved.
The number of loans that have defaulted and been disposed of in 2020 (8) and through the second quarter in 2021 (3) is similar to the average number of defaults per year prior to the housing crisis (Exhibit 2). There has been an increase in loans in special servicing and in default during the pandemic, but only a few of those loans completed workout through the first half of 2021 and recorded losses.
Exhibit 2: Fannie Mae multifamily loan disposals over time

Note: The date indicates when the defaulted loan was finally resolved, not the date when the loan originally defaulted. Data thru second quarter of 2021.
Source: Fannie Mae, Amherst Pierpont Securities
Average loss severities of defaulted loans vary considerably depending on the liquidation method (Exhibit 3). Several of the loans which have defaulted during the pandemic were repurchased by Fannie Mae. These loans tend to have zero losses or small positive recovery rates, indicated by a loss severity rate that is negative. Occasionally a loan that defaults will eventually be fully paid prior to final maturity, which also tends to result in trivial loss severities. Borrowers whose loans are repurchased or fully paid after default typically have found alternative financing or sold the property, using the funds to pay off the Fannie Mae loan. Other methods of liquidation result in loss severities that average 9% for third party sales to a high of 36% over time when a loan goes through foreclosure. Loss severities for loans in foreclosure have been rising for more recent vintage loans. Given the very strong trend of price appreciation in multifamily loans its unclear why this is the case. Very few recent vintage loans have defaulted, so it’s possible that these are outliers and average loss severities for loans that end up in foreclosure will fall over time.
Exhibit 3: Fannie Mae multifamily loss severity by liquidation method

Note: Data thru second quarter of 2021.
Source: Fannie Mae, Amherst Pierpont Securities
Multifamily investors and GSE regulators tend to examine the mix of property types in deals or DUS pools when evaluating potential defaults and losses (Exhibit 4). Student housing loans have historically had the highest default rate (1.4%) across property types, though they also have the lowest average loss severity of 17%. Standard multifamily housing has the second highest default rate (1.3%) and nearly twice the average loan loss severity of 29%. Seniors housing, manufactured housing communities and mixed property types have lower rates of default with average loss severities from 29% to 45%.
Exhibit 4: Fannie Mae multifamily default and loss rates by property type

Note: Data does not include 16 loans with no property type recorded. Data thru second quarter of 2021.
Source: Fannie Mae, Amherst Pierpont Securities
The ultimate impact from the pandemic on multifamily borrowers and the GSE portfolios is still being assessed, but its safe to say that losses will likely be much lower than originally feared thanks to the success of the forbearance programs. At the end of the second quarter, Fannie Mae had 160 loans that were 90 days or more delinquent, but the bulk of these are still in forbearance (Exhibit 5). Unlike Freddie Mac, Fannie Mae and Ginnie Mae record the loan payment status as being delinquent while the loan is in forbearance. As the borrower catches up on payments the loan will migrate from being 90 days or more delinquent to 60 days delinquent, 30 days delinquent, then eventually become current again.
Exhibit 5: Fannie Mae multifamily loans by loan payment status
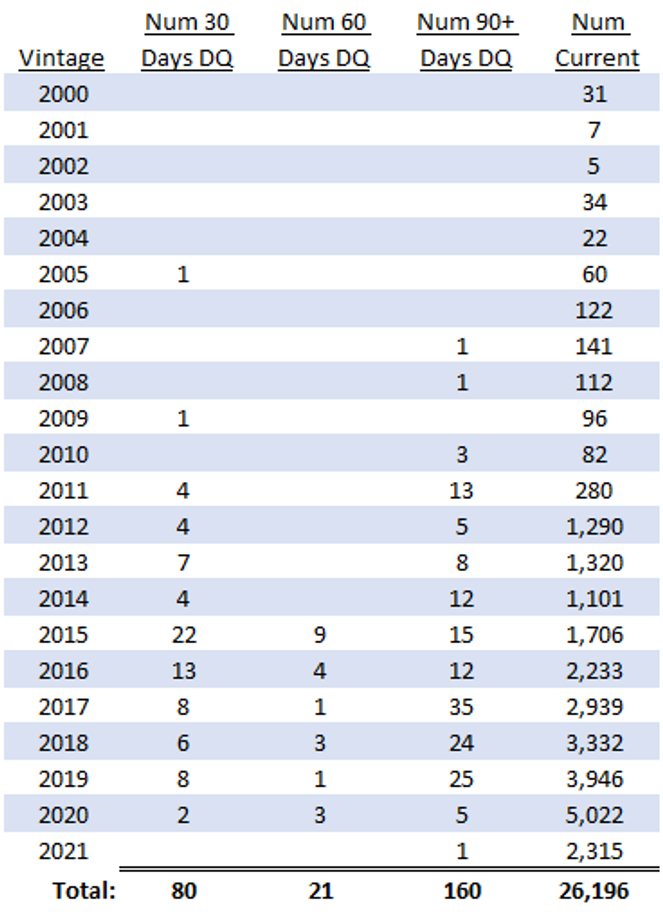
Note: Data thru second quarter of 2021.
Source: Fannie Mae, Amherst Pierpont Securities
The cure rate for loans in forbearance has been high, while some loans that have entered forbearance and defaulted have been repurchased by Fannie Mae or eventually paid off in full. While more of the delinquent loans will likely default, the pandemic will clearly not produce a wave of defaults and losses similar to that seen in the wake of the housing crisis.