


The Big Idea
Supply, demand and value in debt
Steven Abrahams | October 1, 2021
This material is a Marketing Communication and does not constitute Independent Investment Research.
Demand for debt securities in the most recently reported quarter outstripped supply by nearly three times, led by portfolios tightly linked to current monetary and fiscal policy. The Fed, banks and even state and local governments bought the lion’s share of the Treasury and agency MBS markets, leaving these sectors sensitive to Fed tapering and the twists and turns in federal spending. New corporate and structured credit largely went to mutual funds, non-US investors and life insurers, putting credit in hands likely to have more stable demand. The flows still favor credit over Treasury debt and MBS.
Fixed income supply tracks broad economic growth
Outstanding debt securities typically track economic growth, and the second quarter of this year was no exception. Outstanding securities grew $747 billion or 1.4% with GDP up 1.6%. Treasury and corporate debt grew in line with the overall market while agency and GSE-backed securities—almost entirely MBS—grew a little faster (Exhibit 1). Municipal securities and commercial paper lagged, with balances in CP dropping.
Exhibit 1: The debt securities market grew by $747 billion or 1.4% in 2Q2021
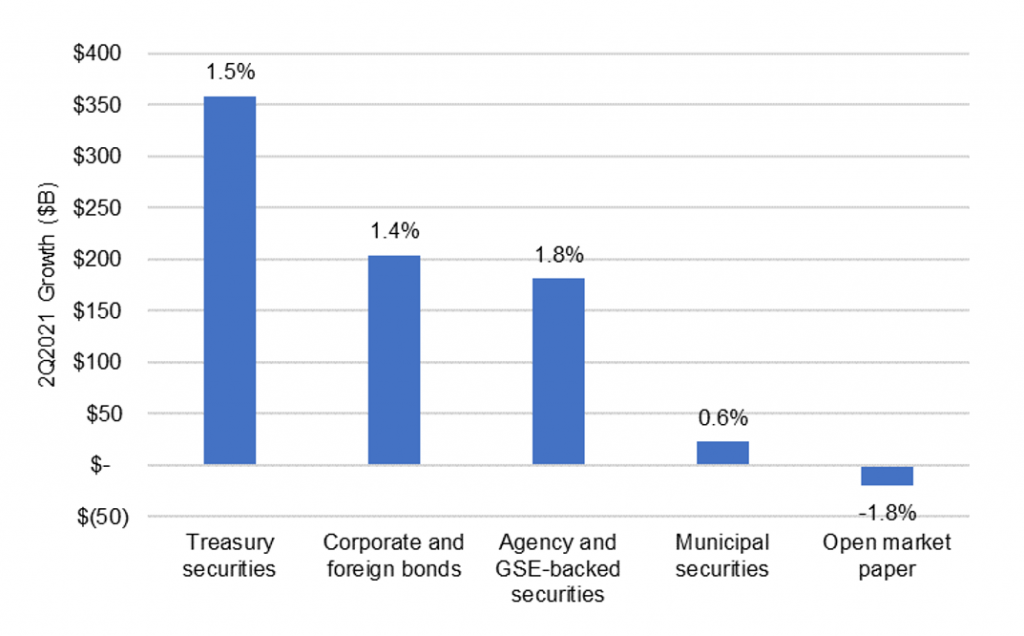
Note: Data labels show QoQ % growth.
Source: Federal Reserve Z.1, Amherst Pierpont Securities
But demand outstrips supply
Despite relatively low rates and tight spreads, demand for paper in the second quarter completely outstripped supply. Portfolios that grew—from the Fed’s $463 billion in growth to nonfinancial noncorporates’ $300 million—added nearly $1.9 trillion in new holdings (Exhibit 2). With only $747 billion in new securities available, other investors had to sell more than $1.1 trillion to satisfy the demand.
Exhibit 2: The Fed, foreign portfolios, banks, state and local governments and mutual funds had the most absolute demand
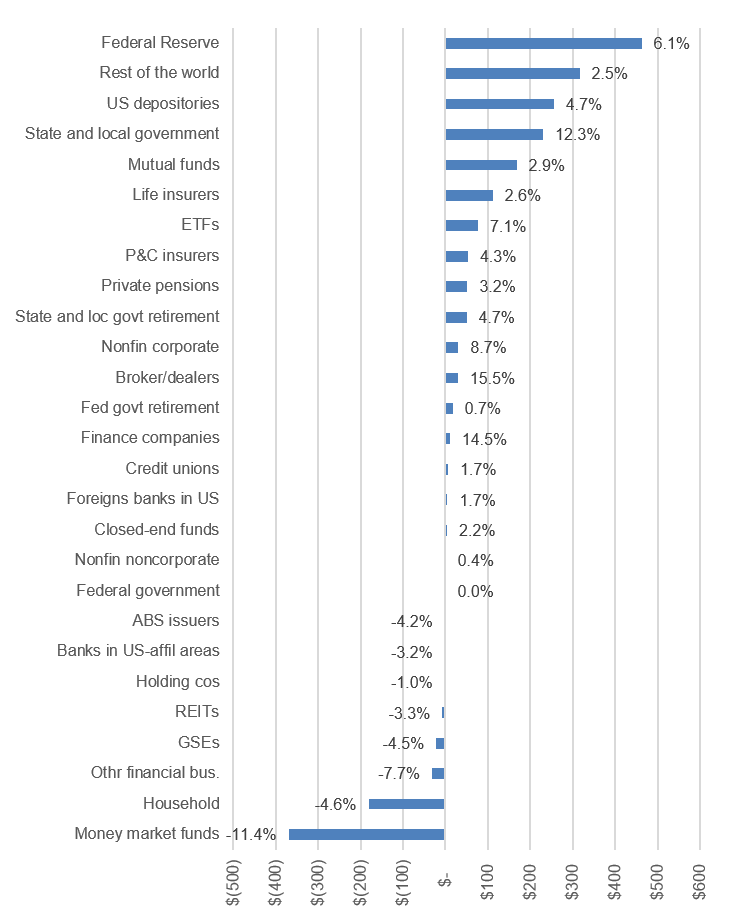
Note: Data labels show QoQ % growth. Z.1 Table L.208 discloses unatrributed changes in debt security balances of ($513) billion not shown.
Source: Federal Reserve Z.1, Amherst Pierpont Securities
Significant demand came from three types of portfolios closely tied to current monetary and fiscal policy—the Fed, US depositories and state and local government. QE obviously puts the Fed in the market to add $120 billion a month. Both QE and fiscal policy, including enhanced unemployment benefits lately, put deposits on bank balance sheets that drive bank investment demand. And federal pandemic programs in the second quarter sent $850 billion in grants to state and local governments, part of which needed at least temporary investment. Demand from the Fed and banks has continued while federal transfers to state and local government and consequent investment demand has dropped off.
Not all demand is equal
Demand from the biggest investors showed distinct patterns reflecting distinct portfolio mandates (Exhibit 3):
- The Fed bought Treasury debt and MBS for policy goals
- Non-US portfolios bought Treasury debt and corporate bonds, with the Treasury debt likely going to central bank portfolios for safety and liquidity and the corporate debt to insurers and mutual funds for spread
- Banks largely bought Treasury debt and agency MBS for liquidity and spread
- State and local governments almost exclusively bought Treasury debt for safety and liquidity
- Mutual funds bought Treasury, corporate, securitized and muni debt for expected total return
- Life insurers almost exclusively bought corporate and securitized debt for spread
- Other portfolios sold across all assets likely to generate cash
Exhibit 3: The mix of marginal investment varied clearly across portfolios
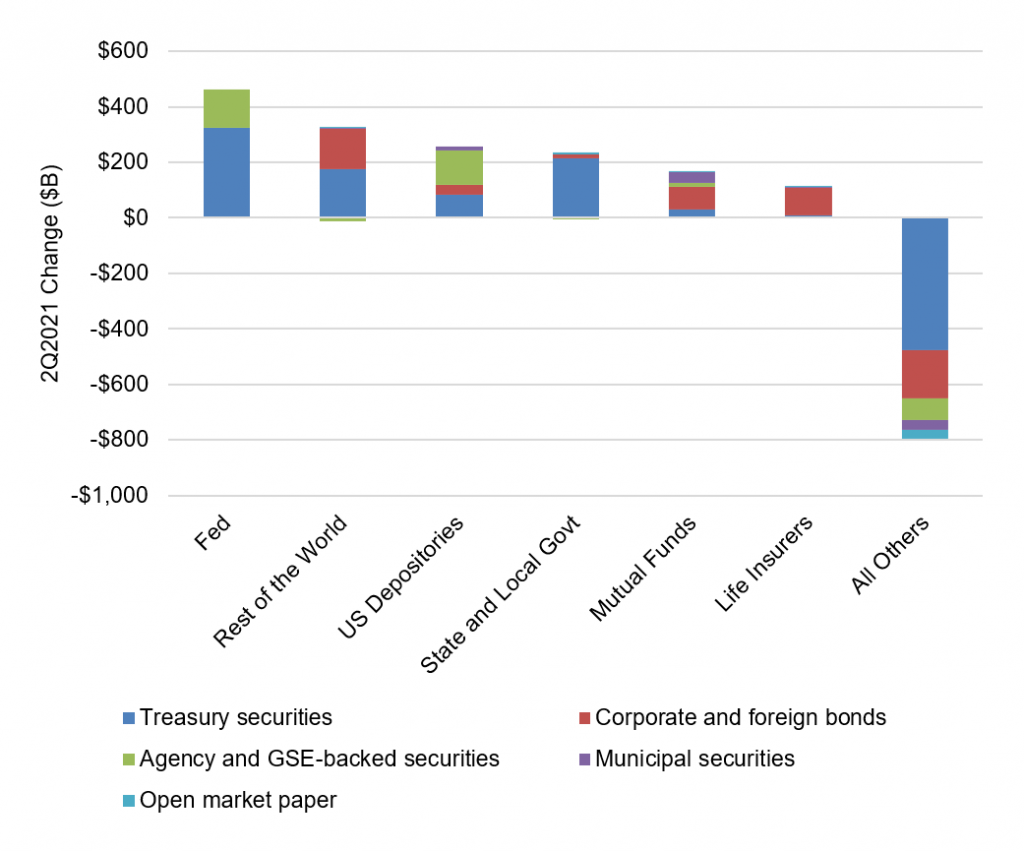
Source: Federal Reserve Z.1, Amherst Pierpont Securities
Debt sectors depend on different sources of demand
The distinct patterns of marginal demand mean each sector is vulnerable to shifts in demand from different types of buyers:
- The Treasury market continues to rely on the Fed, non-US portfolios, US banks and state and local governments
- The corporate and structured debt markets rely most heavily on non-US portfolios, mutual funds and life insurers
- The agency debt and MBS markets rely on the Fed and US banks
- The muni market relies heavily on mutual funds
- The commercial paper market is not dominated by any one investor
Exhibit 4: Debt sectors rely on demand from different investors
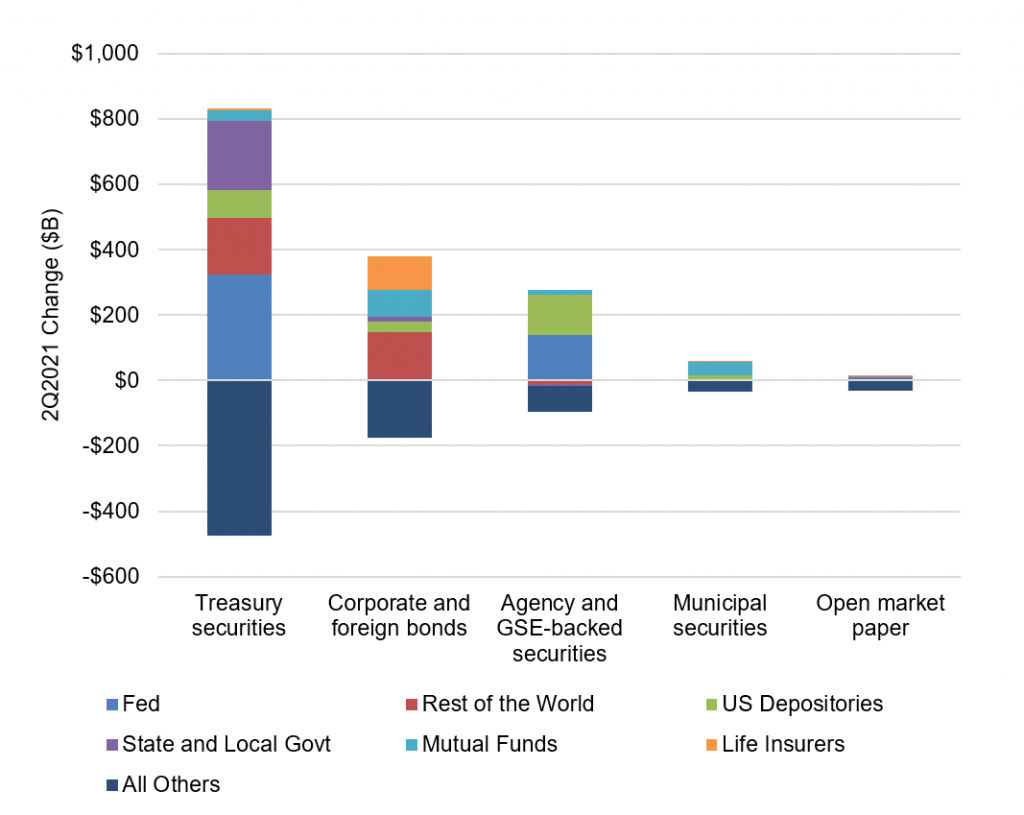
Source: Federal Reserve Z.1, Amherst Pierpont Securities
Impact on markets
For the Treasury market, the pullback in demand from the Fed and banks as QE tapers to a close creates a clear risk of higher yields, all else equal. The Fed alone bought 90% of all net new Treasury supply in the second quarter and likely took a similar share in the third. If the Fed finishes its taper in the middle of 2022, some other investor will have to fill the gap. And with Congress now debating fiscal spending bills that could put anywhere between $1 trillion to $4.5 trillion of new spending into the pipeline, the net supply of Treasury debt looks likely to remain heavy.
For the market in corporate and structured credit, supply and demand should track economic growth with good prospects for stable spreads. Demand for credit depends largely on the bid from mutual funds, non-US private portfolios and insurers. Mutual funds continue to see inflows of more than $50 billion every four weeks, according to Investment Company Institute data, and until MBS spreads widen enough to make compelling relative value, mutual funds should have a steady bid for credit. Life insurers’ premium growth and investment demand should track GDP, and
For the agency MBS market, the pullback from the Fed and banks also poses a risk of wider spreads. Although normally outstanding MBS would grow with GDP, a shortage of housing for sale may dampen growth in net supply. My colleague, Brian Landy, expects net monthly MBS supply to drop to roughly $45 billion, which would take some of the pressure off MBS spreads. But MBS is vulnerable to taper.
The muni market depends on mutual funds, and both supply and demand should scale with GDP. And the commercial paper market has a diversified investor base and should be able to clear with stable spreads.
All things considered, the best positioning still seems to be overweight corporate and structured credit and underweight Treasury debt and agency MBS until the final details of taper fall into place and the political dust settles around the next phase of fiscal policy. The reward in the Treasury and agency MBS markets does not cover the risk.
* * *
The view in rates
The Fed late last month raised the individual counterparty limit on its RRP facility from $80 billion to $160 billion, and balances have quickly set records. After peaking at $1.6 trillion on September 30, it is closing Friday at $1.385 trillion, up $72 billion over a week. Although RRP yields of 5 bp now fall below the October bills at risk of default without a boost in the US debt ceiling, they exceed yields on T-bills maturing from November out to June 2022. The RRP should continue to draw in cash.
Settings on 3-month LIBOR have closed Friday at 13.0 bp, a level toward the high end of the recent range but roughly unchanged on the week. LIBOR clearly is trading with an eye on transition to other benchmarks by June 30, 2023. All interdealer swap trades will use SOFR by October 22, with dealers, banks and others urged to create no new LIBOR exposures after December 31 this year.
The 10-year note has finished the most recent session at 1.46%, up 1 bp from a week ago. The market has been absorbing the FOMC and its intent to taper and hike. Breakeven 10-year inflation is at 238 bp, up 4 bp from a week ago but still with its range since June. The 10-year real rate finished the week at negative 91 bp, down from negative 88 bp a week ago. Tapering will start the Fed’s effort to drain liquidity from the system, and excess liquidity has weighted on real and nominal rates all year.
The Treasury yield curve has finished its most recent session with 2s10s at 120, steeper by 2 bp on the week, and 5s30s at 110 bp, steeper by 6 bp on the week.
The view in spreads
The bullish case for credit and the bearish case for MBS continues. Corporate and structured credit has held spread through most of the year despite the steady approach of Fed tapering. MBS, on the other hand, has widened steadily since the end of May. The difference is likely in the composition in demand across the sectors and in strong corporate fundamentals. The biggest buyers of credit include money managers, international investors and insurers while the only net buyers of MBS during pandemic have been the Fed and banks. Credit buyers continue to have investment demand. Demand from Fed and banks should soften as taper begins, and wider spreads since May arguably anticipate that weaker demand. Once the Fed shows it hand on the timing and pace of taper, the market should be able to fully price the softening in demand and spreads should stabilize.
The view in credit
Credit fundamentals continue to strengthen. Corporations have record earnings, good margins, low multiples of debt to gross profits, low debt service and good liquidity. The consumer balance sheet now shows some of the lowest debt service on record as a percentage of disposal income. That reflects both low rates and government support during pandemic. Rising home prices and rising stock prices have both added to consumer net worth, also now at a record although not equally distributed across households. Consumers are also liquid, with near record amounts of cash in the bank. Strong credit fundamentals may explain some of the relative stable spreads.