By the Numbers
Loan size, occupancy and servicer effects in PLS speeds
This material is a Marketing Communication and does not constitute Independent Investment Research.
As issuance increases across prime PLS, the profile of prepayment risk continues to change. The mix of PLS loans eligible for delivery to Fannie Mae and Freddie Mac has started to change, and that should shape prepayment risk in new deals. The servicer of loans in private-label trusts may influence prepayment rates as well.
Looking at most loans backing prime private-label trusts, investors can break down the universe into a relatively simple taxonomy:
- Owner-occupied loans with conforming jumbo balances
- Owner-occupied loans with non-conforming jumbo loans, and
- Loans backed by investment properties.
Some broad patterns apply. Given the same refinancing incentive, loans with agency-eligible balances prepay somewhat faster than those that cannot be delivered and that loans backed by investment properties are not as efficiently refinanced as owner-occupied loans or even second homes.
Breaking down the universe by loan size and occupancy
Historically, loans with higher balances have tended to prepay faster than those with lower ones. However, in recent years, conforming jumbo loans eligible for GSE delivery have prepaid faster than non-conforming ones. Loans eligible for the GSEs had lower frictions to refinancing, and that was especially true as liquidity from private-label conduit execution for non-conforming loans dried up last year. As the private-label market has rebounded, differences in prepayment rates between loans with jumbo conforming and non-conforming balances have narrowed. After controlling for any additional risk-based pricing on loans, conforming jumbo loans only pay 3 CRR faster than non-conforming ones given 50 bp of refinancing incentive and 5 CRR faster given 100 bp of incentive. (Exhibit 1)
And it appears that investors in private MBS will be exposed to growing amounts of larger loan balances going forward. Until the third quarter of this year, the percentage of conforming balance loans going into private-label trusts has been on a steady decline while the amount of larger loans has been growing. In the first quarter of 2019, roughly two-thirds of loans backing PLS trusts had conforming jumbo balances. That share dropped to just 23% of total issuance in the first quarter of this year. Conversely, loans with balances greater than $1 million made up just 10% of collateral backing private trusts in the first quarter of 2019 and jumped to 37% of collateral balances in the first quarter of this year. The combination of rising home prices and a substantial tightening of spreads of specified jumbo pool spreads relative to their TBA benchmarks suggests both that loan balances should continue to grow and that conforming jumbo loans may likely fetch better prices by being delivered to the enterprises especially in the wake of the expiry of the 50 bp adverse market delivery charge that was previously applied to all refinances delivered to the enterprises.
Exhibit 1: Prepay differences between conforming and non-conforming loans narrow
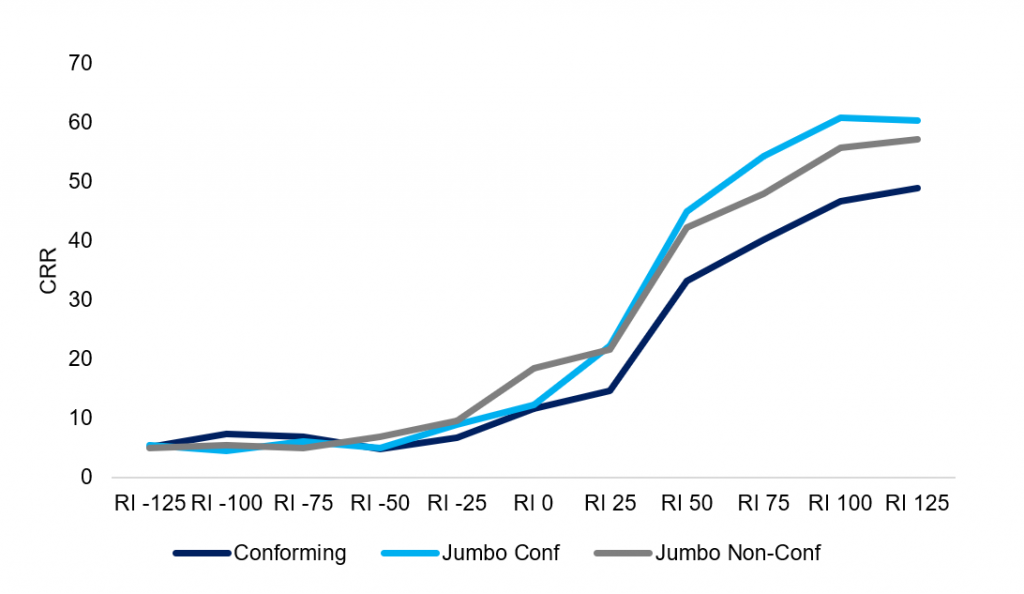
Source: CoreLogic, Intex, Amherst Pierpont – SATO adjusted, observations exclusive to fixed-rate loans
Turning to occupancy, loans backed by investment properties in private-label trusts continue to, by and large, prepay slower than those backed by owner occupied or second homes, although those differences vary somewhat materially after controlling for loan size. The most pronounced differences in prepayment rates given the same amount of SATO adjusted refinancing incentive exists in investor loans with non-conforming balance and that difference decreases as loan size decreases with the caveat that there is a small population of loans with non-jumbo conforming balances securitized in the outstanding universe of PLS trusts. Of loans with non-conforming balances and 100 bp of refinancing incentive, owner occupied loans have prepaid at 56 CRR while loans backed by investment properties have prepaid at roughly 32 CRR. In loans with jumbo conforming balances and the same 100 bp of refinancing incentive, owner occupied loans have paid at 62 CRR while investor loans have prepaid 20 CRR slower. While the difference between loans with conforming balances is just 3 CRR with owner occupied loans prepaying at 48 CRR and investor loans prepaying at 45 CRR.
Digging in on servicers
Controlling for loan size and looking first at servicers of non-conforming jumbo balance loans, which appear poised to make up a larger part of the private-label universe going forward, shows some pronounced differences in prepayment speeds for borrowers with the same amount of refinancing incentive. Simply controlling for loan size and incentive may not fully isolate the servicer effect as there are other factors away from loan size that may be contributing to a difference in prepayment rates. However, based on these simple controls, it does appear that certain servicers are exhibiting faster speeds. Given 100 bp of SATO adjusted incentive, loans serviced by Cenlar and Wells Fargo have prepaid the fastest while those serviced by First Republic and Nationstar have prepaid slower. (Exhibit 2)
Exhibit 2: Stacking up servicer speeds across non-conforming jumbo loans
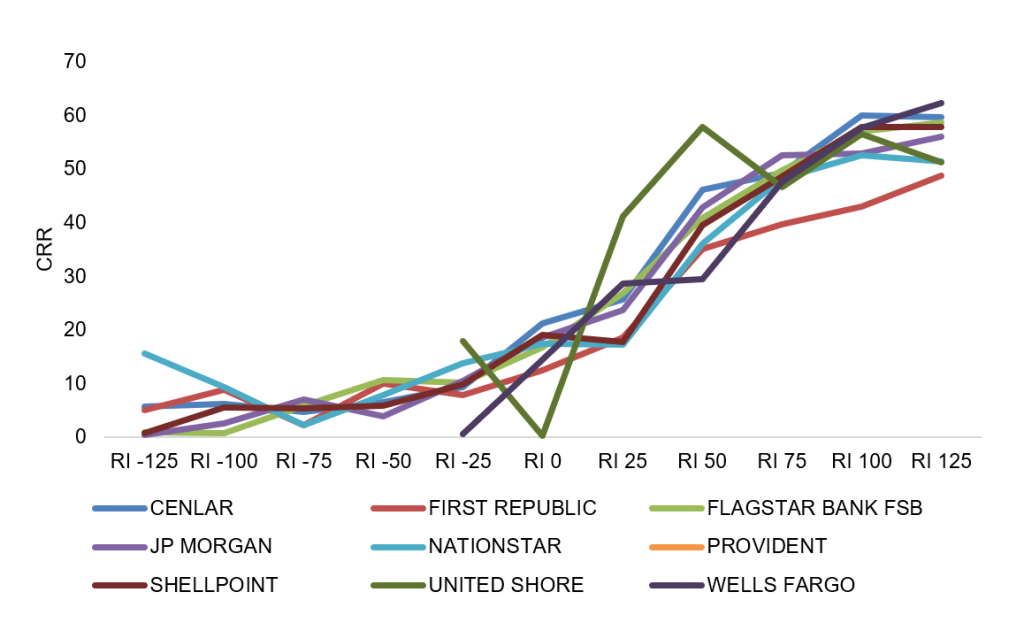
Source: CoreLogic, Intex, Amherst Pierpont – SATO adjusted, observations exclusive to fixed-rate loans
Loans with jumbo conforming balances exhibit some differences in servicer speeds as well. Given 100 bp of SATO adjusted incentive, Loans serviced by Provident and United Shore have prepaid substantially faster than the majority of the cohort while loans serviced by First Republic have prepaid substantially slower than most of the cohort. (Exhibit 3)
Exhibit 3: Stacking up servicer speeds across conforming jumbo loans
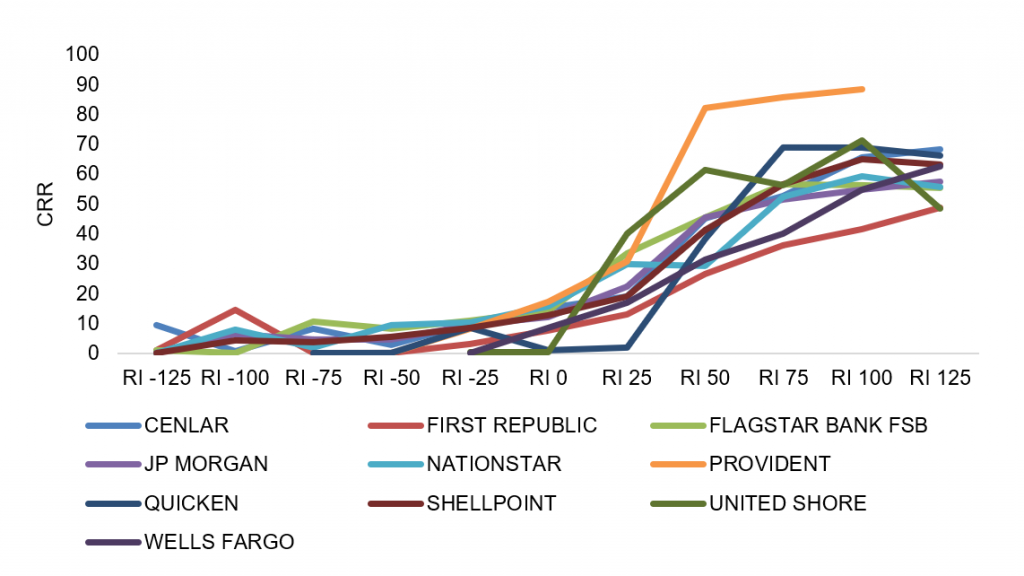
Source: CoreLogic, Intex, Amherst Pierpont – SATO adjusted, observations exclusive to fixed-rate loans
Narrowing the scope of the analysis to loans backed by investment properties shows some differences as well. With 100 bp of incentive loans serviced by United Shore and Shellpoint have exhibited speeds faster than the broader cohort and substantially faster than those serviced by First Republic and Nationstar. Controlling the population for only conforming balance investor loans in private-label trusts shows an even more pronounced difference. (Exhibit 4)
Exhibit 4: Stacking up servicer speeds across conforming investor loans
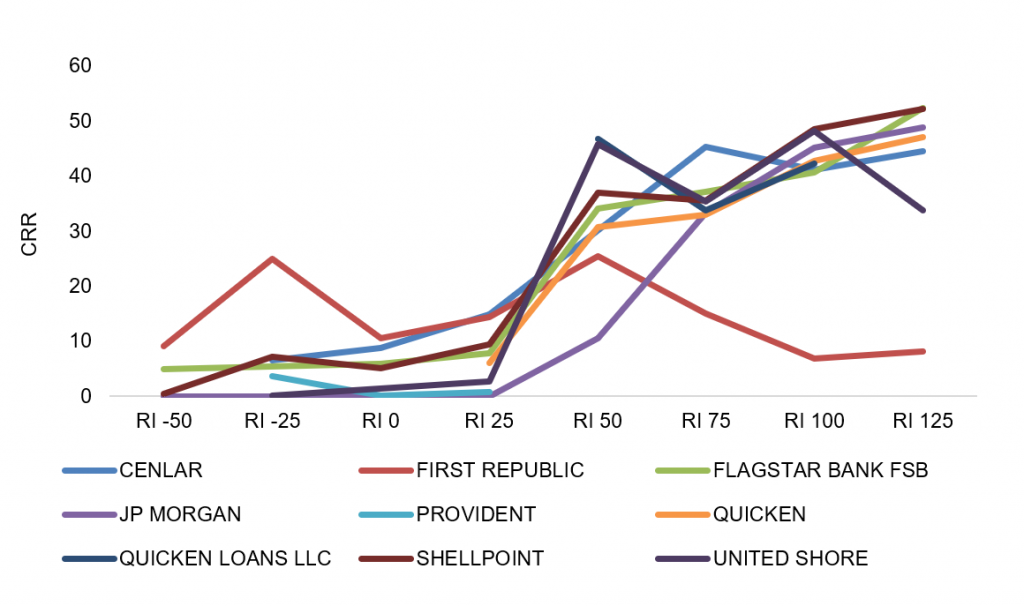
Source: CoreLogic, Intex, Amherst Pierpont – SATO adjusted, observations exclusive to fixed-rate loans
This material is intended only for institutional investors and does not carry all of the independence and disclosure standards of retail debt research reports. In the preparation of this material, the author may have consulted or otherwise discussed the matters referenced herein with one or more of SCM’s trading desks, any of which may have accumulated or otherwise taken a position, long or short, in any of the financial instruments discussed in or related to this material. Further, SCM may act as a market maker or principal dealer and may have proprietary interests that differ or conflict with the recipient hereof, in connection with any financial instrument discussed in or related to this material.
This message, including any attachments or links contained herein, is subject to important disclaimers, conditions, and disclosures regarding Electronic Communications, which you can find at https://portfolio-strategy.apsec.com/sancap-disclaimers-and-disclosures.
Important Disclaimers
Copyright © 2026 Santander US Capital Markets LLC and its affiliates (“SCM”). All rights reserved. SCM is a member of FINRA and SIPC. This material is intended for limited distribution to institutions only and is not publicly available. Any unauthorized use or disclosure is prohibited.
In making this material available, SCM (i) is not providing any advice to the recipient, including, without limitation, any advice as to investment, legal, accounting, tax and financial matters, (ii) is not acting as an advisor or fiduciary in respect of the recipient, (iii) is not making any predictions or projections and (iv) intends that any recipient to which SCM has provided this material is an “institutional investor” (as defined under applicable law and regulation, including FINRA Rule 4512 and that this material will not be disseminated, in whole or part, to any third party by the recipient.
The author of this material is an economist, desk strategist or trader. In the preparation of this material, the author may have consulted or otherwise discussed the matters referenced herein with one or more of SCM’s trading desks, any of which may have accumulated or otherwise taken a position, long or short, in any of the financial instruments discussed in or related to this material. Further, SCM or any of its affiliates may act as a market maker or principal dealer and may have proprietary interests that differ or conflict with the recipient hereof, in connection with any financial instrument discussed in or related to this material.
This material (i) has been prepared for information purposes only and does not constitute a solicitation or an offer to buy or sell any securities, related investments or other financial instruments, (ii) is neither research, a “research report” as commonly understood under the securities laws and regulations promulgated thereunder nor the product of a research department, (iii) or parts thereof may have been obtained from various sources, the reliability of which has not been verified and cannot be guaranteed by SCM, (iv) should not be reproduced or disclosed to any other person, without SCM’s prior consent and (v) is not intended for distribution in any jurisdiction in which its distribution would be prohibited.
In connection with this material, SCM (i) makes no representation or warranties as to the appropriateness or reliance for use in any transaction or as to the permissibility or legality of any financial instrument in any jurisdiction, (ii) believes the information in this material to be reliable, has not independently verified such information and makes no representation, express or implied, with regard to the accuracy or completeness of such information, (iii) accepts no responsibility or liability as to any reliance placed, or investment decision made, on the basis of such information by the recipient and (iv) does not undertake, and disclaims any duty to undertake, to update or to revise the information contained in this material.
Unless otherwise stated, the views, opinions, forecasts, valuations, or estimates contained in this material are those solely of the author, as of the date of publication of this material, and are subject to change without notice. The recipient of this material should make an independent evaluation of this information and make such other investigations as the recipient considers necessary (including obtaining independent financial advice), before transacting in any financial market or instrument discussed in or related to this material.
Important disclaimers for clients in the EU and UK
This publication has been prepared by Trading Desk Strategists within the Sales and Trading functions of Santander US Capital Markets LLC (“SanCap”), the US registered broker-dealer of Santander Corporate & Investment Banking. This communication is distributed in the EEA by Banco Santander S.A., a credit institution registered in Spain and authorised and regulated by the Bank of Spain and the CNMV. Any EEA recipient of this communication that would like to affect any transaction in any security or issuer discussed herein should do so with Banco Santander S.A. or any of its affiliates (together “Santander”). This communication has been distributed in the UK by Banco Santander, S.A.’s London branch, authorised by the Bank of Spain and subject to regulatory oversight on certain matters by the Financial Conduct Authority (FCA) and the Prudential Regulation Authority (PRA).
The publication is intended for exclusive use for Professional Clients and Eligible Counterparties as defined by MiFID II and is not intended for use by retail customers or for any persons or entities in any jurisdictions or country where such distribution or use would be contrary to local law or regulation.
This material is not a product of Santander´s Research Team and does not constitute independent investment research. This is a marketing communication and may contain ¨investment recommendations¨ as defined by the Market Abuse Regulation 596/2014 ("MAR"). This publication has not been prepared in accordance with legal requirements designed to promote the independence of research and is not subject to any prohibition on dealing ahead of the dissemination of investment research. The author, date and time of the production of this publication are as indicated herein.
This publication does not constitute investment advice and may not be relied upon to form an investment decision, nor should it be construed as any offer to sell or issue or invitation to purchase, acquire or subscribe for any instruments referred herein. The publication has been prepared in good faith and based on information Santander considers reliable as of the date of publication, but Santander does not guarantee or represent, express or implied, that such information is accurate or complete. All estimates, forecasts and opinions are current as at the date of this publication and are subject to change without notice. Unless otherwise indicated, Santander does not intend to update this publication. The views and commentary in this publication may not be objective or independent of the interests of the Trading and Sales functions of Santander, who may be active participants in the markets, investments or strategies referred to herein and/or may receive compensation from investment banking and non-investment banking services from entities mentioned herein. Santander may trade as principal, make a market or hold positions in instruments (or related derivatives) and/or hold financial interest in entities discussed herein. Santander may provide market commentary or trading strategies to other clients or engage in transactions which may differ from views expressed herein. Santander may have acted upon the contents of this publication prior to you having received it.
This publication is intended for the exclusive use of the recipient and must not be reproduced, redistributed or transmitted, in whole or in part, without Santander’s consent. The recipient agrees to keep confidential at all times information contained herein.


