The Big Idea
Check, please
This material is a Marketing Communication and does not constitute Independent Investment Research.
The Delta wave has put a drag on consumer demand since early summer, according to some analysis, but the degree is unclear. Some services are very sensitive to the ups and downs of the virus The August retail sales data, as well as high-frequency industry data, provide a check on the Delta wave drag hypothesis. Both sets of figures show restaurant spending held up well in August, suggesting the supposed drag on consumer spending this summer may turn out to be exaggerated.
Restaurant receipts
The Census Bureau’s monthly survey of retail sales covers a variety of retailers, all of whom sell goods. There are general merchandise stores like Wal-Mart and Target, clothing stores, home improvement outlets, gas stations, grocery stores, drug stores, and even nonstore retailers—mainly those who sell over the Internet. The only exception to the goods focus in the retail sales report is that the Census Bureau also collects data from restaurants.
In the current context, this is fortunate. The pandemic, by discouraging personal contact, led to consumers spending more on goods and less on services, especially in periods when the virus has gotten worse, heightening the risk of close contact with a lot of people. The restaurant component of retail sales offers a sneak peek into the fortunes of the services sector, which accounts for almost two-thirds of overall consumer spending. And it comes about two weeks before the broader consumption expenditures figures are released, usually around the end of each month.
Restaurants receipts had declined noticeably late last year, the last time that Covid cases and hospitalizations surged by as much as they have during the Delta wave. Two rounds of federal rebate tax checks, one in late December and another even larger round in March and April, and the ebbing of the virus allowed restaurant receipts to get back on a solid growth track this year. After explosive gains in January and March, coinciding with disbursal of the checks, restaurant receipts continued to post robust increases: 5.1% in April, 4.3% in May, 2.4% in June, and 1.3% in July. The July reading in nominal dollars was almost 9% higher than the pre-pandemic pace (Exhibit 1).
Exhibit 1: Restaurant receipts have surged
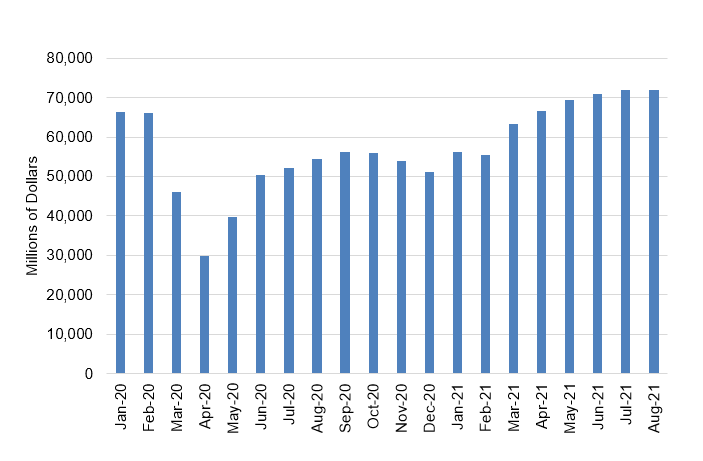
Source: Census Bureau, Amherst Pierpont Securities
There was widespread speculation that the Delta wave led to a substantial pullback in restaurant spending along with other types of service activity in August and likely September as well. I have to admit that I had penciled in a modest decline for restaurant receipts in my own retail sales forecast (about 2%). However, as it turns out, the Census Bureau reported that restaurant receipts were roughly flat last month. While this is not a stellar outcome, especially given the pace of inflation in the sector in recent months, it was considerably better than expected.
High-frequency data
Since the onset of the pandemic, economists have relied more than usual on high-frequency data, as economic activity has tended to move up and down in larger magnitudes and more quickly than in a normal economic environment. For the restaurant industry, the data that has drawn the most focus has been numbers from OpenTable measuring the quantity of seated diners in restaurants around the country. These figures are incredibly timely—daily with a single day’s lag—and are quite detailed, including national data for the U.S. and several other countries as well as state-by-state tallies.
OpenTable reports their data as daily percent changes compared to the corresponding day in 2019, to escape the distortions caused by the pandemic to last year’s figures. So, 2020 figures are year-over-year, but 2021 observations are compared with two years ago. Of course, daily data are subject to massive swings, as weather, floating holidays, and other factors can sharply impact the year-over-year comparisons for any given day. To smooth most of those fluctuations, I calculated 14-day moving averages for the OpenTable year-over-year comparisons (Exhibit 2).
Exhibit 2: OpenTable Seated Diners 2020-21 vs. 2019 Percent Change
(14-day moving average)
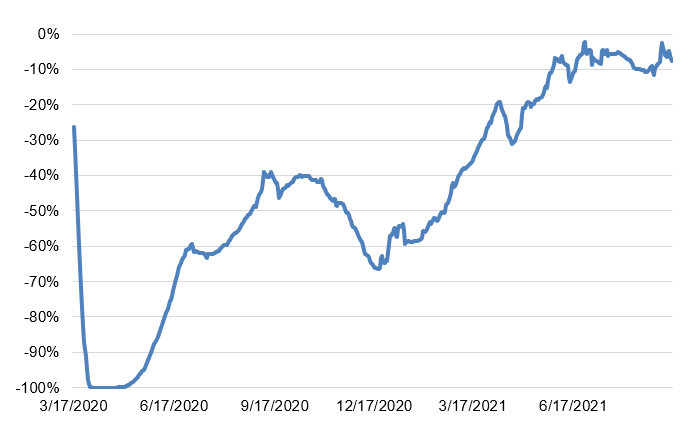
Source: OpenTable.
The OpenTable show that after a sharp recovery in the spring and summer of 2020 as lockdowns eased, the winter Covid surge and perhaps weather less conducive to outdoor dining led to a sharp pullback in restaurant diners, taking the year-over-year decline from around 40% all the way down to almost 70%. In contrast, the dip seen in August 2021 was just a few percentage points. It is also worth pointing out that the largest daily two-year declines recently came during the week that Hurricane Ida tore through Louisiana and then flooded much of the Mid-Atlantic coastal region.
I also created monthly averages of the 14-day moving averages. This measure is perhaps trailing to a degree, but it offers a bigger-picture view of the progress of restaurant diners, closer to being analogous to the monthly retail sales numbers. Exhibit 3 shows the monthly readings since the spring.
Exhibit 3: OpenTable Monthly Averages
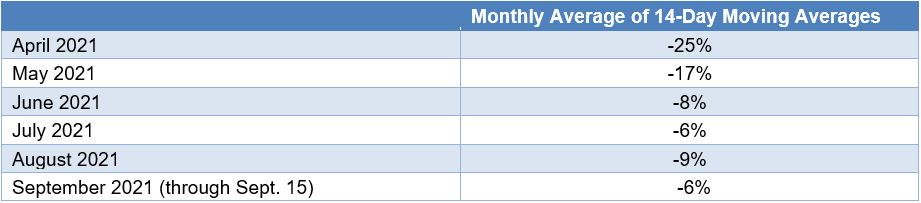
Source: OpenTable.
In the end, the number of restaurant diners softened marginally in August, likely due to a combination of Delta fears and the fleeting impact of Hurricane Ida. This is broadly consistent with the retail sales figures examined above. Remember that prices have been moving sharply higher, so that nominal dollars spent in August should be performing a little better than the number of diners.
The OpenTable data offer good news for September as well. The average over the first half of the month has ticked back up to -6%, in line with the July average. Of course, this is not a particularly robust result, but if this is as bad as it gets during the Delta wave, then the economy should be in good shape moving forward. If the number of restaurant diners in the midst of the Delta wave is steady, then, as the virus ebbs, I would anticipate that sales would be in a position to swing noticeably higher in the fall.
I would add one caveat as a qualifier: the Delta wave may have lead to a steeper drop in other types of services spending than for restaurants. Air travel comes to
mind as one plausible area that was hit harder in August. Nonetheless, the data on restaurant spending offers some comfort that any slowdown in activity as the virus flared up this summer will prove manageable.
This material is intended only for institutional investors and does not carry all of the independence and disclosure standards of retail debt research reports. In the preparation of this material, the author may have consulted or otherwise discussed the matters referenced herein with one or more of SCM’s trading desks, any of which may have accumulated or otherwise taken a position, long or short, in any of the financial instruments discussed in or related to this material. Further, SCM may act as a market maker or principal dealer and may have proprietary interests that differ or conflict with the recipient hereof, in connection with any financial instrument discussed in or related to this material.
This message, including any attachments or links contained herein, is subject to important disclaimers, conditions, and disclosures regarding Electronic Communications, which you can find at https://portfolio-strategy.apsec.com/sancap-disclaimers-and-disclosures.
Important Disclaimers
Copyright © 2026 Santander US Capital Markets LLC and its affiliates (“SCM”). All rights reserved. SCM is a member of FINRA and SIPC. This material is intended for limited distribution to institutions only and is not publicly available. Any unauthorized use or disclosure is prohibited.
In making this material available, SCM (i) is not providing any advice to the recipient, including, without limitation, any advice as to investment, legal, accounting, tax and financial matters, (ii) is not acting as an advisor or fiduciary in respect of the recipient, (iii) is not making any predictions or projections and (iv) intends that any recipient to which SCM has provided this material is an “institutional investor” (as defined under applicable law and regulation, including FINRA Rule 4512 and that this material will not be disseminated, in whole or part, to any third party by the recipient.
The author of this material is an economist, desk strategist or trader. In the preparation of this material, the author may have consulted or otherwise discussed the matters referenced herein with one or more of SCM’s trading desks, any of which may have accumulated or otherwise taken a position, long or short, in any of the financial instruments discussed in or related to this material. Further, SCM or any of its affiliates may act as a market maker or principal dealer and may have proprietary interests that differ or conflict with the recipient hereof, in connection with any financial instrument discussed in or related to this material.
This material (i) has been prepared for information purposes only and does not constitute a solicitation or an offer to buy or sell any securities, related investments or other financial instruments, (ii) is neither research, a “research report” as commonly understood under the securities laws and regulations promulgated thereunder nor the product of a research department, (iii) or parts thereof may have been obtained from various sources, the reliability of which has not been verified and cannot be guaranteed by SCM, (iv) should not be reproduced or disclosed to any other person, without SCM’s prior consent and (v) is not intended for distribution in any jurisdiction in which its distribution would be prohibited.
In connection with this material, SCM (i) makes no representation or warranties as to the appropriateness or reliance for use in any transaction or as to the permissibility or legality of any financial instrument in any jurisdiction, (ii) believes the information in this material to be reliable, has not independently verified such information and makes no representation, express or implied, with regard to the accuracy or completeness of such information, (iii) accepts no responsibility or liability as to any reliance placed, or investment decision made, on the basis of such information by the recipient and (iv) does not undertake, and disclaims any duty to undertake, to update or to revise the information contained in this material.
Unless otherwise stated, the views, opinions, forecasts, valuations, or estimates contained in this material are those solely of the author, as of the date of publication of this material, and are subject to change without notice. The recipient of this material should make an independent evaluation of this information and make such other investigations as the recipient considers necessary (including obtaining independent financial advice), before transacting in any financial market or instrument discussed in or related to this material.
Important disclaimers for clients in the EU and UK
This publication has been prepared by Trading Desk Strategists within the Sales and Trading functions of Santander US Capital Markets LLC (“SanCap”), the US registered broker-dealer of Santander Corporate & Investment Banking. This communication is distributed in the EEA by Banco Santander S.A., a credit institution registered in Spain and authorised and regulated by the Bank of Spain and the CNMV. Any EEA recipient of this communication that would like to affect any transaction in any security or issuer discussed herein should do so with Banco Santander S.A. or any of its affiliates (together “Santander”). This communication has been distributed in the UK by Banco Santander, S.A.’s London branch, authorised by the Bank of Spain and subject to regulatory oversight on certain matters by the Financial Conduct Authority (FCA) and the Prudential Regulation Authority (PRA).
The publication is intended for exclusive use for Professional Clients and Eligible Counterparties as defined by MiFID II and is not intended for use by retail customers or for any persons or entities in any jurisdictions or country where such distribution or use would be contrary to local law or regulation.
This material is not a product of Santander´s Research Team and does not constitute independent investment research. This is a marketing communication and may contain ¨investment recommendations¨ as defined by the Market Abuse Regulation 596/2014 ("MAR"). This publication has not been prepared in accordance with legal requirements designed to promote the independence of research and is not subject to any prohibition on dealing ahead of the dissemination of investment research. The author, date and time of the production of this publication are as indicated herein.
This publication does not constitute investment advice and may not be relied upon to form an investment decision, nor should it be construed as any offer to sell or issue or invitation to purchase, acquire or subscribe for any instruments referred herein. The publication has been prepared in good faith and based on information Santander considers reliable as of the date of publication, but Santander does not guarantee or represent, express or implied, that such information is accurate or complete. All estimates, forecasts and opinions are current as at the date of this publication and are subject to change without notice. Unless otherwise indicated, Santander does not intend to update this publication. The views and commentary in this publication may not be objective or independent of the interests of the Trading and Sales functions of Santander, who may be active participants in the markets, investments or strategies referred to herein and/or may receive compensation from investment banking and non-investment banking services from entities mentioned herein. Santander may trade as principal, make a market or hold positions in instruments (or related derivatives) and/or hold financial interest in entities discussed herein. Santander may provide market commentary or trading strategies to other clients or engage in transactions which may differ from views expressed herein. Santander may have acted upon the contents of this publication prior to you having received it.
This publication is intended for the exclusive use of the recipient and must not be reproduced, redistributed or transmitted, in whole or in part, without Santander’s consent. The recipient agrees to keep confidential at all times information contained herein.


