


The Big Idea
Banks keep building cash
Steven Abrahams | September 17, 2021
This document is intended for institutional investors and is not subject to all of the independence and disclosure standards applicable to debt research reports prepared for retail investors. This material does not constitute research.
Fed QE continues to push growth in bank assets and liabilities lately at more than double the average pace of the last five years. The securities portfolio is getting its fair share of the growth, which is good for the Treasury and agency MBS markets where banks play a big role. But the real star of the balance sheet is cash assets, which in August grew almost three times faster than bank deposits.
Bank asset balances since mid-June have been rising 1.31% every four weeks, with total liabilities up 1.39%. Both are multiples of the usual growth rate. Over the last years, asset growth over a given four weeks has averaged 0.50% with liability growth running at 0.53% (Exhibit 1). QE continues to put cash in the economy, much of which ends up on bank balance sheets and needs to get invested.
Exhibit 1: Elevated growth lately in bank assets and liabilities
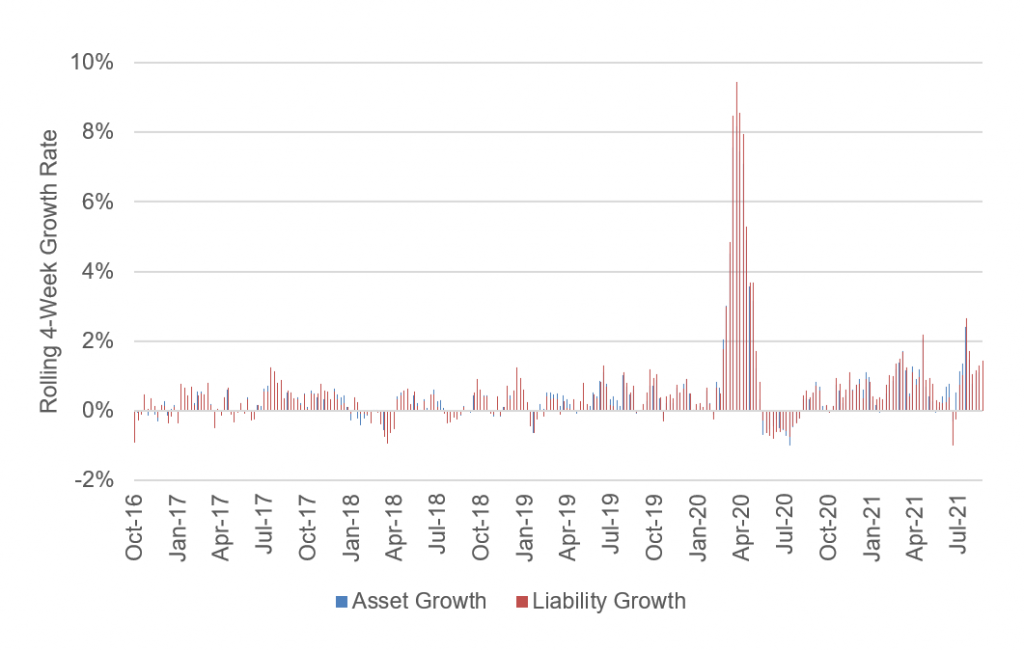
Source: Federal Reserve H.8, Amherst Pierpont Securities
August is a good example of banks’ latest response to deposit and liability growth. Deposits rose at an annualized seasonally adjusted rate of 14.9% with total liabilities up 17.5% (Exhibit 2). Proportional allocation would have pushed up balances across assets by roughly these amounts. But cash assets—primary cash on deposit at the Fed—rose 44.1%, loans in the fed funds market rose 16%, securities balances rose 12.3%, loans rose only 6.3% and other assets rose only 3.4%.
Exhibit 2: Bank asset growth in August went disproportionately to cash assets

Source: Federal Reserve H.8, Amherst Pierpont Securities
In the second quarter of this year, banks had been allocating out of cash assets and into securities, and it seemed likely that continued low loan demand and pressure for earnings would keep pushing that trend. So far in the third quarter, that is not the case.
Throughout QE, banks have worried that deposits coming onto the balance sheet because of excess system liquidity would also be quick to leave once policy tightened and short rates started to rise. That has made banks reluctant to deploy too much marginal liquidity in longer assets. Even though banks only earn 15 bp on deposits at the Fed, it is still substantially more than recent 7 bp to 8 bp yields on fed funds or the 5 bp available at the Fed’s reverse repo facility. Of course, it is substantially less than the yields in Treasury debt, agency MBS, and agency CMOs, but those assets expose the bank to interest rate mismatch.
With an announcement of Fed taper increasingly expected in November and a Fed hike priced into the OIS forward curve by the fourth quarter of 2022, banks look likely to remain cautious about a duration mismatch between assets and deposits. That should bias banks to grow the securities portfolio proportionally to total liabilities while growing cash assets faster.
Of course, absolute demand for securities should still remain strong. For example, banks now hold nearly $3 trillion of MBS prepaying at an estimated monthly rate of 2.3%. That generates reinvestment demand of more than $70 billion a month before investment of marginal new deposits.
* * *
The view in rates
After spending most days since mid-August around $1.1 trillion, Fed RRP balances posted a new record Friday of $1.22 trillion. RRP yields of 5 bp still top those on Treasury bills out to mid-October, and QE continues to add new cash to the financial system.
Settings on 3-month LIBOR have stayed around 12 bp lately and closed Friday at 12.2 bp. LIBOR clearly is trading with an eye on transition to other benchmarks by June 30, 2023. All interdealer swap trades will use SOFR by October 22, with dealers, banks and others urged to create no new LIBOR exposures after December 31 this year.
The 10-year note has finished the most recent session at 1.36%, up 2 bp from a week ago. Breakeven 10-year inflation is at 235 bp, down 5 bp from a week ago but still with its range since June. The 10-year real rate finished the week at negative 98 bp, up from negative 105 bp a week ago.
The Treasury yield curve has finished its most recent session with 2s10s at 114, nearly unchanged on the week, and 5s30s at 104 bp, flatter on the week by 8 bp.
The view in spreads
The bullish case for credit and the bearish case for MBS continues. Corporate and structured credit has held spread through most of the year despite the steady approach of Fed tapering. MBS, on the other hand, has widened steadily since the end of May. The difference is likely in the composition in demand across the sectors. The biggest buyers of credit include money managers, international investors and insurers while the only net buyers of MBS during pandemic have been the Fed and banks. Credit buyers continue to have investment demand. Demand from Fed and banks should soften as taper begins, and wider spreads since May arguably anticipate that weaker demand. Once the Fed shows it hand on the timing and pace of taper, the market should be able to fully price the softening in demand and spreads should stabilize.
The view in credit
Credit fundamentals continue to strengthen. The consumer balance sheet now shows some of the lowest debt service on record as a percentage of disposal income. That reflects both low rates and government support during pandemic. Rising home prices and rising stock prices have both added to consumer net worth, also now at a record although not equally distributed across households. Consumers are also liquid, with near record amounts of cash in the bank. Corporations also have been improving their balance sheets in general, lowering debt costs and improving liquidity. Strong credit fundamentals may explain some of the relative stable spreads.