


By the Numbers
The sound and fury around investor loans
Brian Landy, CFA, Chris Helwig and Mary Beth Fisher, PhD | August 25, 2021
This material is a Marketing Communication and does not constitute Independent Investment Research.
There has been plenty of sound and fury around investor loans in 2021, and some observers have started to wonder if some fundamental change is afoot. First Fannie Mae and Freddie Mac capped the volume of investors loans they would buy. And this summer a series of private MBS have come to market featuring investor loans eligible for agency MBS. The single-family rental market also has been robust, and some observers have asked if the rental market in general is undergoing a significant shift.
If there is a significant shift, it is not working its way into most of the key data yet. The absolute amount of investor debt is probably up with a rise in residential mortgage debt in general. Still, we went out asking the questions and getting the answers.
Q: Are we seeing a surge in rental housing?
Basically no, but it’s a little complicated. The rented share of US housing between 2Q2020 and 2Q2021 has surged from roughly 32% toward 35% (Exhibit 1). But that surge should be taken with at least a couple of grains of salt. Absent the sharp drop in the rented share during pandemic, the rented share of homes is basically back to the level just before pandemic and still below the peak of mid-2016.
Exhibit 1: The rented share of occupied US housing is still below its 2016 peak
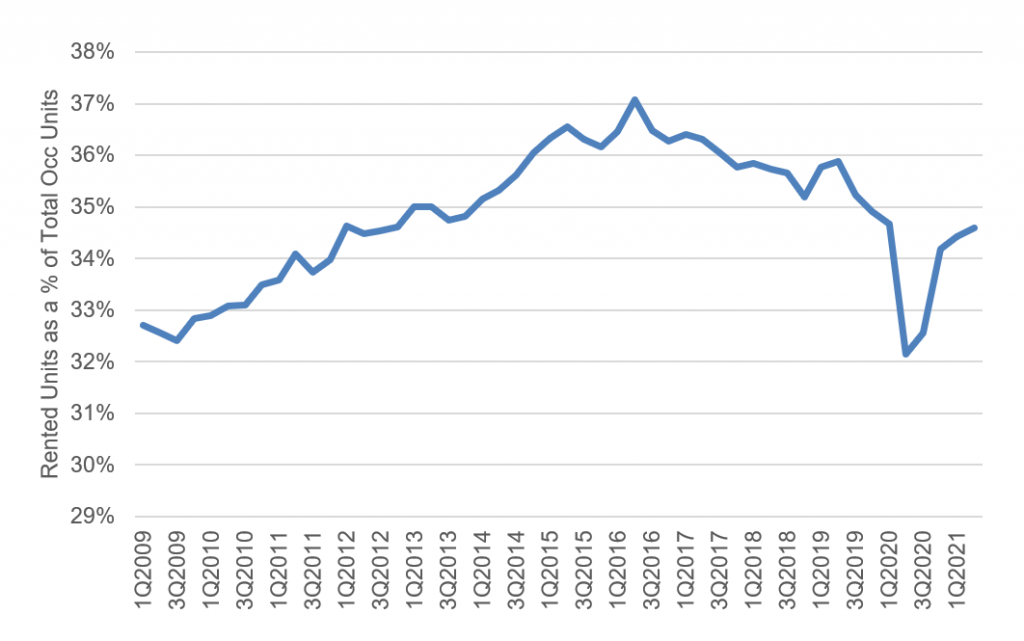
Source: US Census, Amherst Pierpont Securities
The trouble with the apparent surge is that the quality of US Census Bureau data used to estimate rented and owned homes suffered during pandemic. Normally the Census sends people out to check households that do not respond to the bureau’s quarterly Housing Vacancy Survey. The person sees if the unit is vacant or occupied, rented or owned. Last year, as explained by the Census in detail, the bureau stopped in-person visits. That led to a drop in the estimated vacancy rate and a spike in households. Estimated homeownership also jumped as renters seemed less likely to answer the survey than owners. Nobody could go house-to-house to figure it out.
At this point, the Census has largely fixed the problem. It put people back in the field in July, although not in all areas, and has continued to expand coverage and develop survey adjustments.
Putting pandemic aside, however, there is no obvious surge from pre-pandemic levels in the rental share of housing.
Q: Are we seeing a surge in the absolute number of rental units?
No, again. Of course, it is possible that the absolute number of rental units could rise even though the rental share could hold steady or even decline. That could happen if the overall number of housing units surged. But the numbers show otherwise. The Census data shows a plunge in rented units during pandemic, but that is likely due to the aforementioned problems with data collection. The most recent figures show 43,644 rented units, only 511 more than prepandemic and still slightly below earlier peaks (Exhibit 2).
Exhibit 2: The total number of rented units is just below its peak
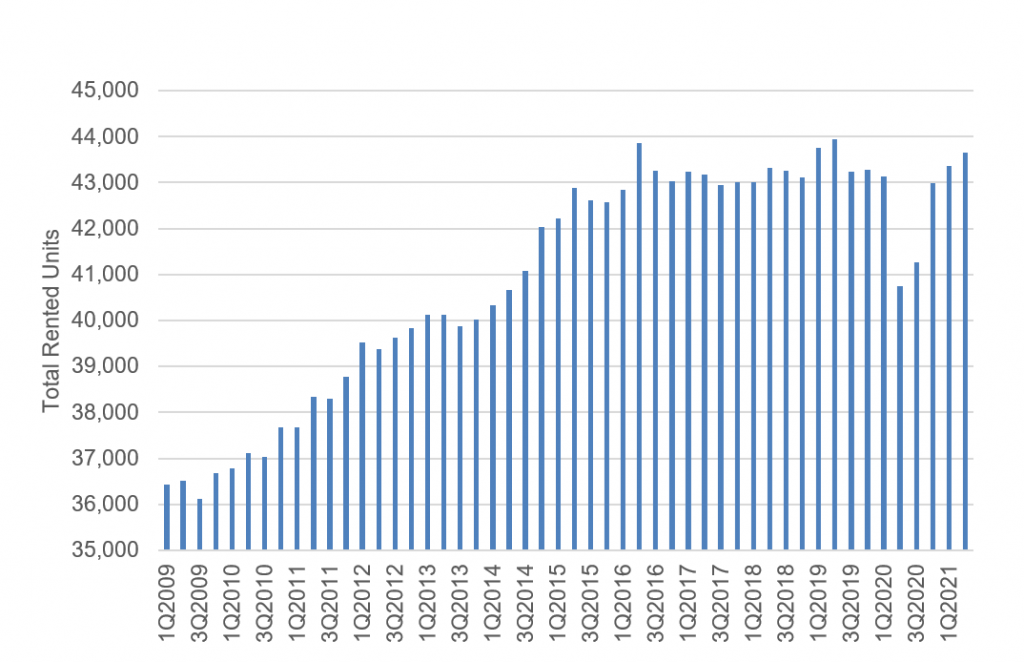
Source: US Census, Amherst Pierpont Securities
Q: Could we be seeing a surge in the financing of rented units?
Not in the single-family securitization markets so far. Fannie Mae and Freddie Mac have securitized investor loans for years. Those loans as a share of total GSE residential loans climbed back above their prepandemic level earlier this year, although the share still stood below early 2019 levels (Exhibit 3). The Federal Housing Finance Agency in March announced caps on securitization of investors loans from Fannie Mae and Freddie Mac, and the share has since plunged.
Exhibit 3: The investor loan share of GSE volume rebounded before FHFA caps
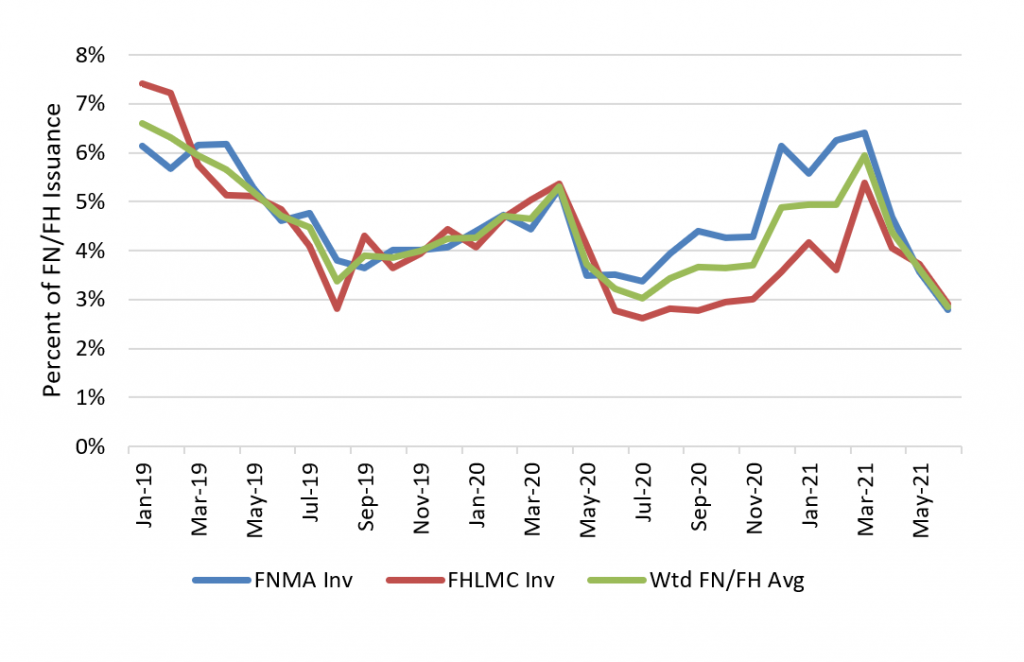
Source: eMBS, Amherst Pierpont Securities
After the FHFA announced caps on investor loans, originators rushed to figure out what to do with loans in the pipeline or loans that could be made in the future. One obvious possibility was to securitize the loans through private MBS. In the private market, both non-QM shelves and prime shelves have often included investor loans. Non-QM investor loans often get underwritten to the projected rental income on the property, prime investor loans often get underwritten to the creditworthiness of the investor.
Despite the possibility of using private MBS to replace agency securitization, the data through June show no clear signs of that. The investor share of private non-QM and prime securitizations has gone up this year from 2020 levels, but it is roughly in line with prepandemic levels (Exhibit 4). In fact, the investor share of loans in non-QM and prime deals has been trending lower this year.
Exhibit 4: Investor loans in private non-QM and prime MBS have returned to prepandemic levels
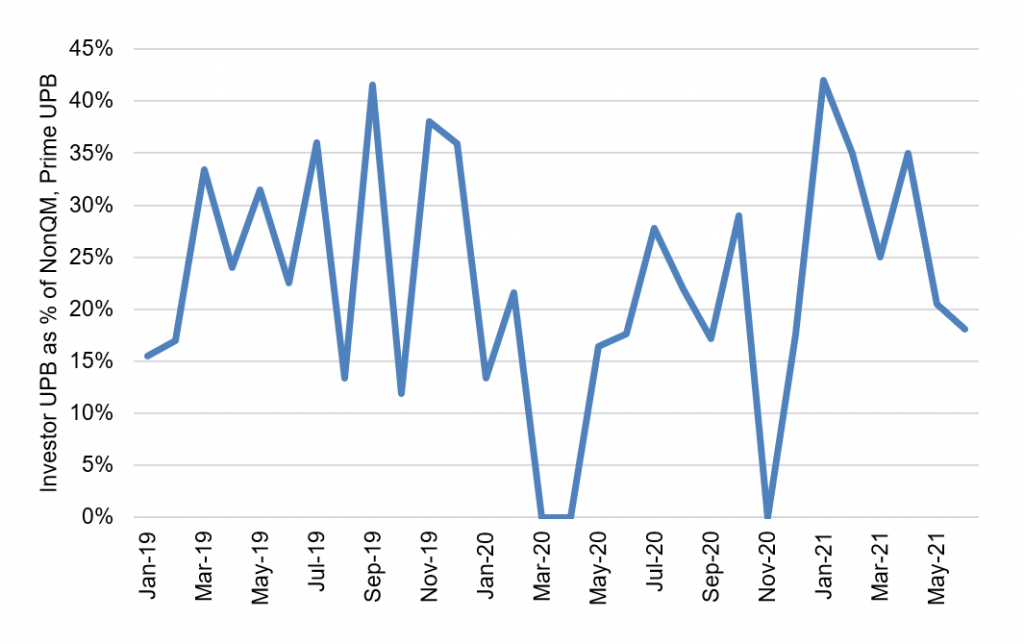
Source: Intex, Amherst Pierpont Securities
It is possible that July, August and the rest of 2021 will see private securitization of loans sitting temporarily in trading books or on bank balance sheets. We will have to wait and see.
It is also possible that the absolute amount of investor debt is rising even though investor share is not. From the end of 2019, the Federal Reserve’s Z.1 report shows total 1- to 4-family residential debt up $592 billion or 5.3%. With share investor share of originations declining, that leaves investor balances up less than that.
Q: Could a surge in investor financing be happening through bank loan portfolios?
Doubtful, but hard to say for sure. Domestic banks have seen $1.5 trillion in deposit growth during the last 12 months, creating demand for assets to pair against rising liabilities. Despite this, the Federal Reserve’s H.8 report shows bank holdings of residential mortgage loans have risen year-to-date by just $22 billion and year-over-year have declined by slightly more than $30 billion.
Negative net bank demand for mortgage loans may be a function of several factors. First, an overall drawdown in credit availability during the peak of the pandemic likely tightened the credit box for most US balance sheet lenders. And coupled with fast prepayment speeds, tighter credit likely left banks unable to replace existing portfolio balances. Secondly, if banks assign a relatively short duration to recent new deposits, they may be reluctant to pair relatively illiquid loans against those deposits. Banks have bought hundreds of billions of dollars of MBS, but securities are relatively liquid. While mortgage credit is no longer tightening, the liquidity mismatch may continue to be a headwind to bank demand for any kind of residential mortgage loan.
Of course, it is possible that banks have reallocated to investor loans even as overall balances fell. Current available data do not distinguish investor from owner-occupied loans. And investors loans should be on equal footing with owner-occupied loans for regulatory and risk-based capital. This possibility will have to wait until Home Mortgage Disclosure Act data for 2021 becomes available next year.
Q: Could a surge in financing of rented units be happening through multifamily loan originations?
Single-family investor loans and multifamily loans do not overlap, the former used to finance 1-4 family homes the later used to finance 5+ family homes. But a general rise in financing of rental units could be happening through the multifamily mortgage market.
Commercial bank loans backed by multifamily properties show a fairly steady rise in holdings over the past several years (Exhibit 5). After remaining relatively steady during 2020, there has been a bit of a swell in holdings this year starting the first week of June.
Exhibit 5: Commercial bank assets secured by multifamily properties
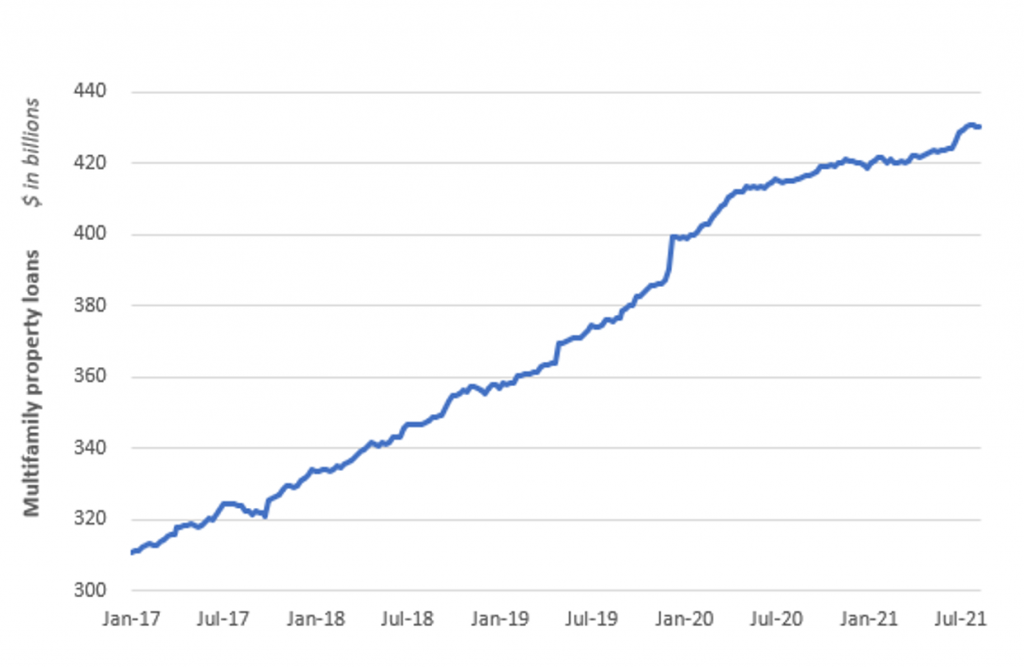
Source: Federal Reserve H.8 data, Amherst Pierpont Securities
The patterns in Fannie Mae and Freddie Mac multifamily debt issuance show no clear sign of a surge, although Ginnie Mae issuance has picked up. Combined conventional multifamily issuance peaked in November of 2020 and has tailed off so far in 2021. That’s partially due to lower interest rates in the latter half of 2020 and partly due to a clear seasonal effect—the conventional agencies tend to backload some issuance into the latter half of the year. But issuance of Ginnie Mae project loans has been climbing steadily since early 2020.
Exhibit 6: A small surge in Ginnie Mae multifamily financing
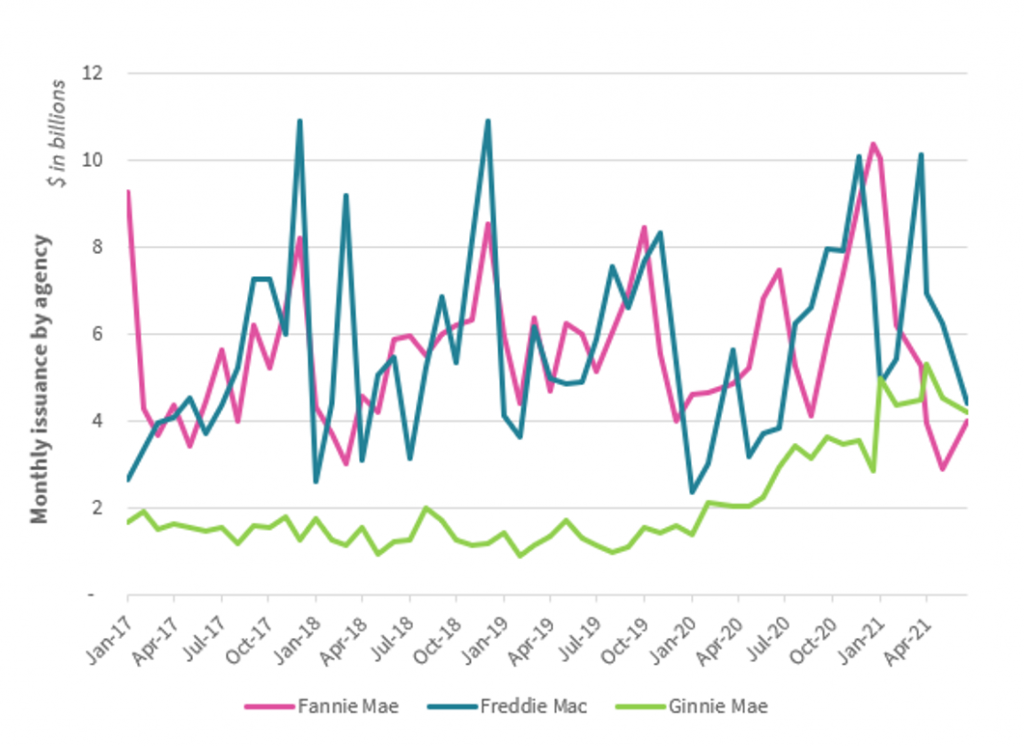
Source: Fannie Mae, Freddie Mac, Ginnie Mae, Amherst Pierpont Securities
Banks may be taking some business from Fannie Mae and Freddie Mac. Their multifamily caps were lowered from $80 billion each in 2020 to $70 billion each in 2021. It’s likely that the $10 billion increase in bank multifamily loans year-to-date is partially driven by the $10 billion lowering of the multifamily caps for each GSE.