


The Long and Short
Retailers’ earnings recap: strong results, with upside left in off-price
Meredith Contente | August 20, 2021
This material is a Marketing Communication and does not constitute Independent Investment Research.
Retailers’ results reported thus far have mostly exceeded expectations as the economic rebound in the U.S has provided for strong demand. While retailers are witnessing increased traffic in stores, digital shopping also continues to grow. Same-day options such as buy online/pick-up in store (BOPUS) are resonating with consumers for the ease of both purchase and pick-up and the lack of need for minimum spend to reach free shipping. While the digital transformation is here to stay, off-price retailers have proven that the consumer enjoys the thrill of the hunt in a brick and mortar store. Retail spreads have rebounded with the broader corporate IG market, and while most names seem hard pressed to rally any further, there is still value in off-price retailer ROST. ROST remains in a net cash position and continues to post margins that are over 400 bp higher than its closest peer. ROST spreads could collapse, with fair value roughly 15 bp behind TJX.
Exhibit 1. Retail 7-year to 10-year Curve
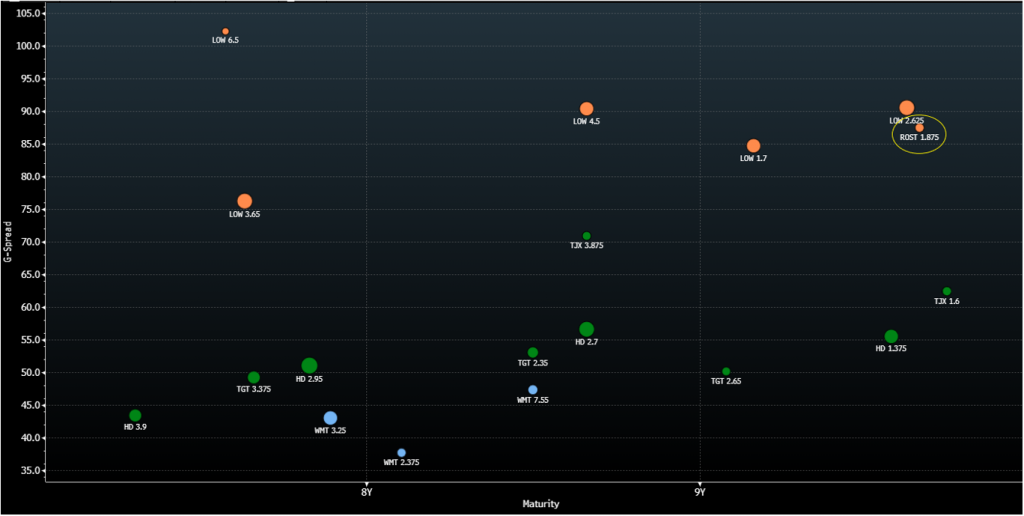
Source: Bloomberg TRACE; APS
Mass Merchants
Walmart Inc. (WMT – Aa2/AA/AA)
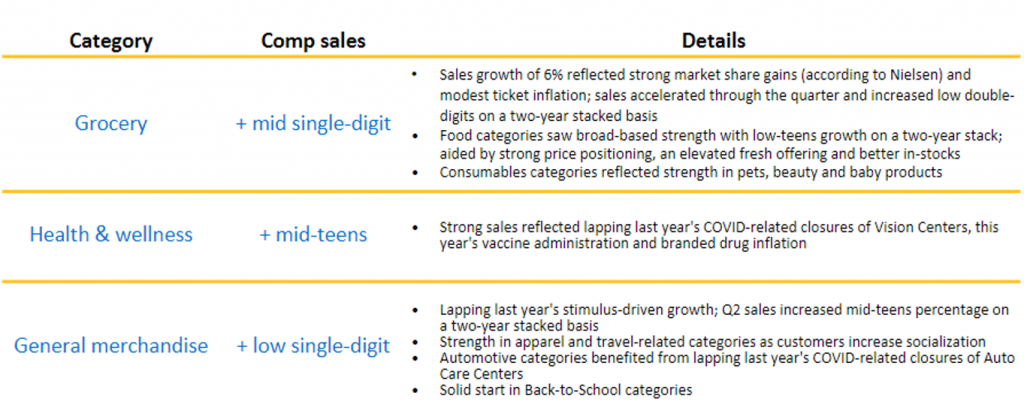
WMT witnessed another strong quarter (both in store and online) with U.S. comp sales (ex-fuel) up 5.2%, which came in ahead of estimates of 3.5%. Additionally, eCommerce sales remain on track to hit management’s $75 billion target by year-end. The adjusted operating margin also expanded 50 bp year-over-year (to 5.2%). Growth was largely fueled by strong underlying business trends due to the rebound in the U.S. economy and stimulus spending. Comp sales increased per month in the quarter, with July being the strongest month. Management noted that they effectively grew market share in the grocery business as comp transactions were up 6.1% year-over-year. Grocery benefitted from a shift back to in person shopping. Grocery sales also accelerated throughout the quarter due to modest ticket inflation and better inventory management with a greater percentage of in-stock items.
Exhibit 2. WMT U.S. Comp Sales
Source: WMT 2Q21 Earnings Presentation
General merchandise volumes increased 150 bp sequentially as WMT has stepped up its capex spend to focus on supply chain management as well as investments in private label offerings. Fulfillment centers will have more capacity and automation to help keep stores appropriately stocked. WMT has also been focused on launching more private brands with a focus on the healthcare and pet categories. They are now offering a new insulin product, which saves customers 75% off the cash price of branded insulin.
Guidance was increased for a second time this year with management now expecting consolidated net sales to be slightly positive (ex fx) versus previous expectations for a decline in the low single digits. U.S. comp sales (ex-fuel) are now expected to be in the 5%-6% range, up from an increase in the low single digit range. Consolidated operating income should also be up in the 9%-11.5% range (ex fx), which is up from previous guidance of an increase in the mid-single digit range. WMT’s strong balance sheet continues to improve as the company ended the quarter with close to $23 billion of cash on hand, up from $17 billion in the year ago-period. Additionally, total debt has declined by approximately $9 billion over the same time period. We estimate that lease-adjusted leverage now stands at 1.6x, which is down a half turn from the year-ago period. WMT repurchased $5.2 billion of shares year-to-date, which represents about 25% of its $20 billion authorization. With a strong balance sheet underscored by a large cash balance, we expect management to be focused on directing free cash flow to shareholder remuneration.
Target Corp. (TGT – A2/A/A)
TGT’s comparable sales growth of 8.9% was on top of record 24.3% growth in the year-ago period. Management noted that comp sales growth was driven mostly by increased store traffic, with store comp sales growth of 8.7%. Digital growth was up 10% with most customers looking for same day services (order pick/drive up). BOPUS, as well as in store shopping, led to 95% of TGT’s sales in the quarter being fulfilled by stores. This helps the gross margin as it saves on shipping expenses. However, TGT still witnessed a 50 bp decline in the gross margin (to 30.4%) as higher merchandise and freight costs could not be fully offset by the favorable fulfillment mix. TGT effectively managed SG&A costs which helped the operating margin to only decline 20 bp year-over-year.
Exhibit 3. TGT Traffic Fuels Growth
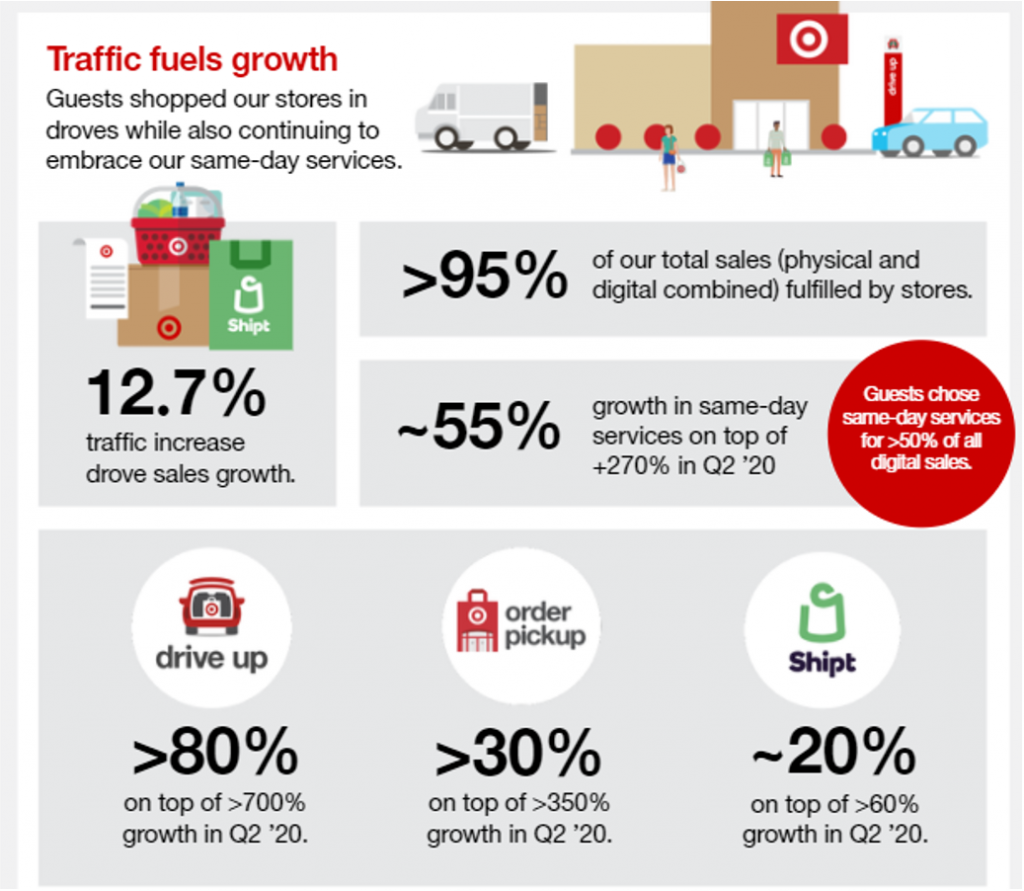
Source: TGT 2Q21 Earnings Presentation
As with its peer WMT, TGT is also carrying a higher cash balance than normal as it ended the quarter with $7.4 billion of cash on hand. TGT repurchased $1.5 billion of shares in the quarter, leaving them with $1.8 billion left of repurchase authorization. TGT announced a new $15 billion share repurchase authorization, which we expect will be utilized over time to help bring down the cash balance to more historical levels (~$2 billion area), while being mindful of maintaining its mid-single-A debt ratings. We estimate that lease adjusted leverage is below that of WMT at approximately 1.3x.
Home Improvement Retailers
Home Depot Inc. (HD – A2/A/A)
HD posted record quarterly sales of $41 billion with consolidated comp sales up 4.5% as demand across business lines remains strong. Management noted that they witnessed positive sales comps every week despite extremely tough comps from the year-ago period. Disruptions in the supply chain continue to be an issue, and in-stocks are not at a level that HD would like them to be at, but HD continues to partner with vendors to prioritize key SKUs and high demand categories. A close eye on SG&A helped HD to post an improvement of 20 bp to the operating margin (to 16.2%) as increased lumber prices and freight costs negatively impacted COGS/sales by 80 bp. Management noted that as the consumer returns to pre-COVID purchase patterns, they have witnessed a decline in do-it-yourself (DIY) demand and an increase in Pro demand.
HD’s cash position has decreased significantly since the highs witnessed during the height of the pandemic as the company ended the quarter with $4.6 billion of cash on hand. This was down from $14 billion in the year-ago period and $8 billion at year end. While HD has repaid $1.4 billion of debt in 1H21, they have spent close to $7 billion on share repurchases over the same time period. HD ended the quarter with lease adjusted leverage at roughly 1.7x, which is down from 2.0x at year-end.
Lowe’s Companies Inc. (LOW – Baa1/BBB+)
LOW has had a bit more wood to chop than its peer HD as margins continue to lag HD, as highlighted in Exhibit 4. Additionally, the company witnessed negative comp sales for the quarter which were down 1.6% on a consolidated basis and 2.2% in the U.S. The bright spot with sales was online, which witnessed 7% growth in the quarter, off 135% growth in the year-ago period. As with HD, LOW also witnessed a shift away from DIY to Pro and installation services as the consumer returns to pre-COVID purchase patterns. LOW has made some progress on the operating margin and witnessed an 80 bp expansion (to 15.3%).
LOW ended the quarter with lease-adjusted leverage of 2.1x which remains well below their stated target of 2.75x. Additionally, the cash position remains very strong, with $4.8 billion currently on hand. Given that leverage remains below management’s long-term target, we see little need for LOW to reduce debt further and expect to see an increase in shareholder remuneration. During the quarter, the company repurchased $3.1 billion of shares with management noting that they have $13.6 billion of authorization remaining under the share repurchase authorization. Management expects to execute a minimum of $9 billion of share repurchases in 2021. Given that $6.2 billion of share repurchases have been executed year-to-date, we may see LOW hit the $12 billion share repurchase mark for the full year.
Exhibit 4. HD vs. LOW Quarterly Operating Margin Trend (1Q18-2Q21)
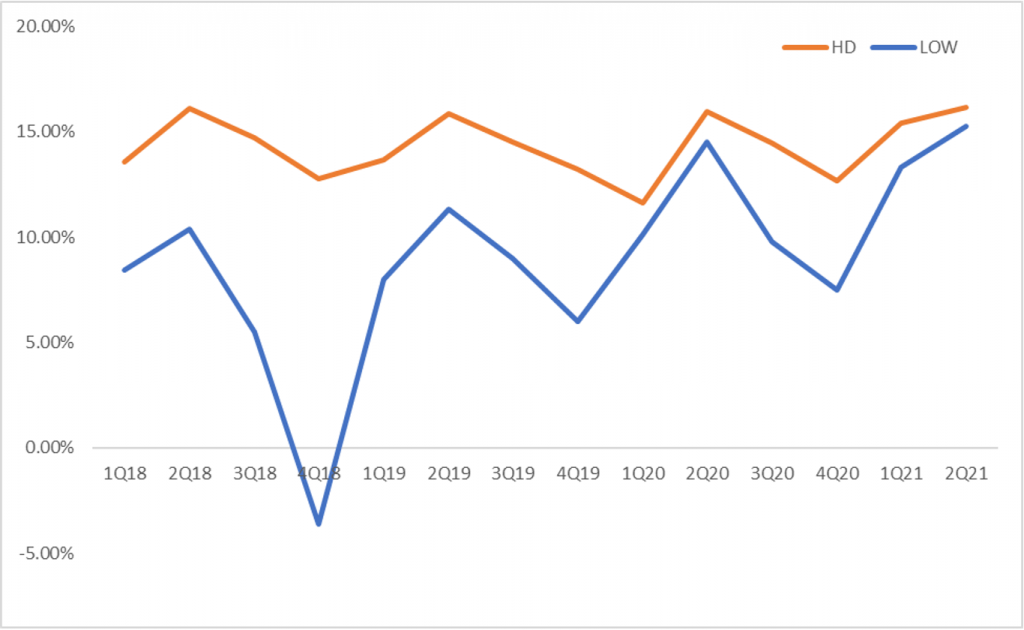
Source: HD & LOW 10Ks and 10Qs; APS
Off-Price Retailers
TJX Companies Inc. (TJX – A2/A)
TJX reported total sales for the quarter of $12.1 billion, which was up 81% from 2Q20 as stores were closed for 31% of the quarter last year due to COVID. TJX reported open-only comp sales of 20% with the greatest increase posted at the company’s HomeGoods stores, which witnessed comp sales growth of 36%. We note that the open-only sales comp is measured against the same period in FY19 to give a better idea on the underlying growth, since stores were closed for part of last year. That said, 2Q21 net sales were up nearly 24% from the pre-pandemic quarter (2Q19). TJX provided a list of store closures by region which showed no stores in the U.S. closed during the quarter. Internationally, 22% of stores in Canada were closed during the quarter and 18% in Australia while only 3% in Europe were closed.
Once TJX re-opened stores last year, they did run into some inventory problems, as most stores were low on inventory given the global shut down and the merchandise assortment was below management’s expectations. TJX ended the quarter with inventory of $5.1 billion which we note is more in line historically with the company’s previous 2Qs and up 36% from last year. Management believes product availability is excellent and they are well positioned in stores and online for back-to-school and throughout the fall.
After issuing debt to shore up liquidity during the pandemic, TJX executed make whole calls in June to retire $2.75 billion of debt. This reduced annualized interest costs by over $90mm. Liquidity remains strong as TJX ended the quarter with $7.1 billion of cash on hand. While the company has returned to share repurchases, we note the level is well within the confines of free cash flow. TJX expects to repurchase between $1.25 billion-$1.50 billion of shares this year versus expectations of $2.5 billion in free cash flow. That said, we expect management to continue to be proactive in reducing debt further given the strong cash balance. Historically, TJX had maintained a net cash position (excluding leases) pre-pandemic.
Ross Stores Inc. (ROST – A2/BBB+)
ROST also witnessed strong sales growth in 2Q as comp sales were up 15% versus the same period in 2019. As with TJX, ROST is comparing to the 2019 quarter given that stores were closed for a portion of 2Q20. Management noted for 1H21, comp sales were up 14%. Management chalked up the strong performance to the assortment of great bargains coupled with government stimulus and increased vaccination rates. For the quarter, the operating margin improved to 14.1%, up from 13.7% in 2Q19.
While management began repurchasing shares this quarter, repurchases were minimal at $176mm, with a total of $650mm of stock expected to be repurchased for the entire year. We believe management will continue to focus on maintaining strong liquidity and repaying debt over shareholder remuneration given potential for additional risks associated with the COVID variants. ROST ended the quarter with cash and equivalents of $5.6 billion versus total debt of $2.5 billion, putting them in a net cash position of approximately $3.0 billion. While management increased full year guidance, with comp sales now expected to be up 10%-11% (up from 7%-9%) and EPS in the $4.20-$4.38 range (up from $3.93-$4.20), guidance issued for 3Q seemed conservative with EPS guidance coming in well below consensus. That said, any widening in the bonds based on 3Q EPS guidance would provide an attractive buying opportunity. However, we expect this credit to collapse closer to TJX given its strong balance sheet and best in class margin profile. ROST’s EBITDA margin was 15.9% on a LTM basis, versus 11.6% at TJX.