


The Big Idea
Pandemic, information and portfolio performance
Steven Abrahams | August 20, 2021
This document is intended for institutional investors and is not subject to all of the independence and disclosure standards applicable to debt research reports prepared for retail investors. This material does not constitute research.
Returns on actively managed fixed income portfolios have picked up substantially since the start of pandemic, and a change in the value of information may be behind it. Remote working, social distancing, less travel and entertainment, Zoom, Teams—all of it has limited the casual transfer of soft information that happens when people circulate. That should improve opportunities for investment teams set up to acquire and act on good information. And the clear improvement in performance of active fixed income funds since the start of pandemic suggests that is the case.
Returns on the largest active fixed income mutual funds since March 2020 have gone from running slightly below the aggregate US market index to running slightly above (Exhibit 1). From January 2019 through February 2020, funds now controlling more than two-thirds of active US fixed income AUM underperformed the Bloomberg Barclays US Aggregate Bond Index by an average of 1.7 bp a day. In March 2020, funds underperformed by an average of 13 bp a day. But since March 2020, those same funds have outperformed by an average of more than 1.5 bp a day. (Details behind these calculations follow in an appendix to this note.)
Exhibit 1: Active manager performance has improved since March 2020

Source: Bloomberg, Amherst Pierpont Securities
Pandemic has also increased the differences between fund returns. From January 2019 through February 2020, returns across the largest funds showed an average volatility or standard deviation of 7.8 bp a day (Exhibit 2). In March 2020, return volatility across funds spiked to 43 bp a day. And since March 2020, volatility has run at an average of 8.9 bp a day.
Exhibit 2: Volatility of performance across managers has since March 2020
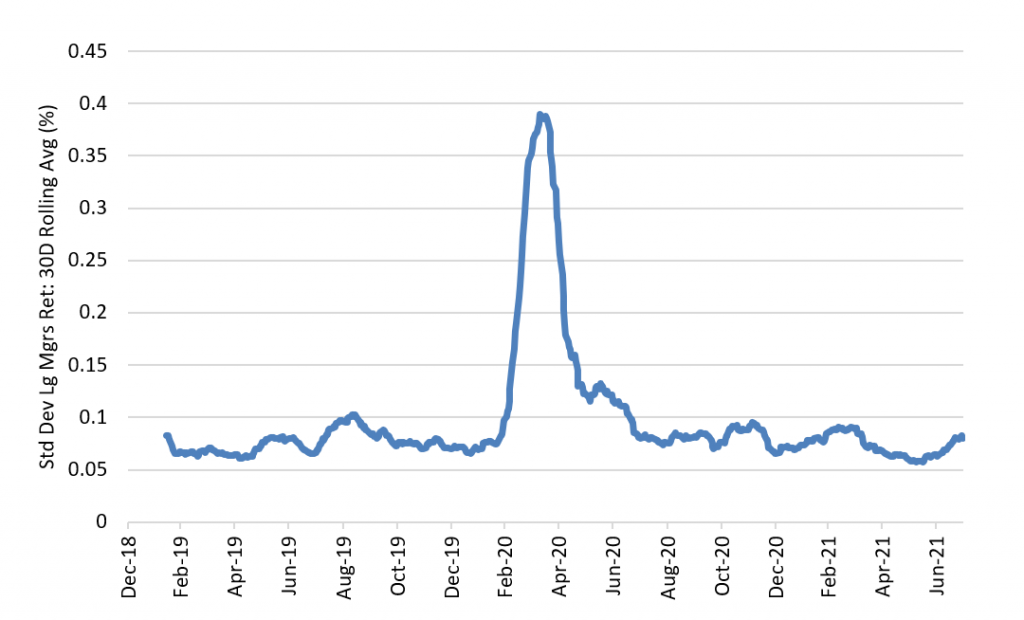
Source: Bloomberg, Amherst Pierpont Securities
Both improved ability of active managers to beat a passive index and the greater dispersion of returns across managers is consistent with a market where information has become more valuable. Pandemic has broken up many casual chains of information. Information that can fit in a database or go out over the Internet still flows easily, but soft information generally does not—things such as preferences, priorities, impressions, trust and other intangibles. That can make investment decisions more difficult, especially in complex assets or highly uncertain markets. Soft information becomes expensive to collect but more valuable in interpreting the environment. Unfortunately, there is no ready market for gauging change in information value over time. Active portfolio performance offers a proxy.
Most things an active manager does to get advantage over passive benchmarks and peers entails some element of proprietary information. Most relative value analysis, most efforts to invest outside a market index and most investments in new or niche assets run on better information than peers’. The latest active fund returns suggest either more of that information is available, or the market is offering more opportunities for investor to use it, or both. That should bias active funds toward higher returns. It should also create larger differences in returns across funds since sources and uses of proprietary information will differ.
Returns on active mutual funds are not alone in signaling a rally in the value of information. Returns on fixed income hedge funds have sharply outpaced the return on the Bloomberg/Barclays index since March 2020. The index has posted 3.70%. The HFRI asset-backed index is up 20%, the credit index up 26.8% and the corporate index up 29.4%. It is the fastest pace of outperformance for these indices in more than a decade (Exhibit 3).
Exhibit 3: Fixed income hedge funds have also outperformed the broad market

Source: Bloomberg, Amherst Pierpont Securities
Information can be an important competitive advantage for hedge funds. Regulations allow hedge funds to hold much more concentrated positions in certain assets than mutual funds, where regulatory diversification and liquidity requirements limit asset concentrations. Hedge funds consequently can get a much bigger bang from proprietary information on a particular asset class because it can be applied to a larger share of the portfolio. Other elements of a hedge fund platform can magnify information advantage, including leverage and the ability to short sell or hedge assets.
Although large mutual funds’ excess returns in recent months have dropped back to pre-pandemic levels, results since March 2020 still argue for a good return on information. The approaching Fed taper opens new doors. Forbearance and foreclosure moratoriums should eventually end, households and corporations supported by a steady flow of Fed liquidity will have to adapt to less of it and policy change looks likely in mortgage finance and elsewhere.
The market should continue favoring investors that develop and apply proprietary information. And it should continue favoring assets that require that information, including deep credit, private or less liquid assets and complex assets, among others.
Appendix: Benchmarking active manager performance
The analysis of active mutual fund performance selected from the 25 largest US open-ended fixed income mutual funds that use the Bloomberg/Barclays US Aggregate Bond Index as a primary benchmark. Only 22 had daily return data retrievable on Bloomberg. These 22 funds as of August 16, 2021, held $1.08 trillion, or 67.4% of AUM in the 261 funds that met screening criteria.
For each fund, the analysis retrieved daily returns from December 31, 2018, through July 30, 2021. On each date, the analysis calculated a simple average return over the 22 funds and a standard deviation of returns. Analysis using returns weighted by AUM were not significantly different, so the analysis stayed with simple unweighted returns and standard deviations.
On each date, the analysis calculated the difference between the average return on the selected funds and the return on the Bloomberg/Barclays US Aggregate Bond Index. This became the key measure of performance.
The analysis created variables to capture three time periods: (i) December 31, 2018, to February 28, 2020, (ii) March 1, 2020, to March 31, 2020, and (iii) April 1, 2020 to July 30, 2021. These captured pre-pandemic returns, returns in the month the pandemic unfolded and the Fed responded and returns afterwards.
Regression of performance differences on these variables produced coefficients significant at the 5% or lower threshold, and regression of daily volatility on these variables also produced coefficients significant at the 5% or lower threshold.
* * *
The view in rates
Fed RRP balances closed Friday at a new record $1.11 trillion, up $61 billion from a week ago. At 5 bp, the rate on the RRP is still attractive relative to other forms of repo and beats the yield on T-bills out to mid-October.
Settings on 3-month LIBOR have edged up slightly to close Friday at around 13 bp, still within basis points of the lowest setting ever. LIBOR has started pricing in the transition to SOFR. Most interdealer swap trades will use SOFR by October at the latest, with regulators urging no new LIBOR exposures after the end of this year. LIBOR officially sunsets on June 30, 2023.
The 10-year note has finished the most recent session at 1.25%, down 3 bp on the week. Despite newly released FOMC minutes showing consensus for taper sometime this year, rates have not moved higher. Breakeven 10-year inflation is at 226 bp, down on the week by 12 bp. The 10-year real rate finished the week at negative 101 bp, up 9 bp on the week. So far, lower expectations for inflation have more than offset higher expected real rates.
The Treasury yield curve has finished its most recent session with 2s10s at 103 bp, 3 bp flatter than a week ago. The 5s30s curve has finished at 109 bp, flatter by 7 bp.
The view in spreads
Credit spreads have softened a little further in the last week. Benchmark investment grade cash spreads now stand around 95 bp, wider by 5 bp from the end of May. Demand from mutual funds, international portfolios and insurers looks healthy. Low rates should continue supporting corporate balance sheet strength. Ratios of EBITDA to interest expense are in the middle of the range despite high ratios of debt to EBITDA. Investor demand for yield should keep spreads relatively tight. A strong economy should help credit spreads, but relative value flows at money managers could still soften credit spreads if MBS gets wide enough.
MBS is finishing Friday again at its widest levels since March. The prospect of Fed tapering and heavy net supply should keep weighing on MBS spreads until the Fed shows its hand and the market can price the impact. The market has already priced additional risk of soft demand and steady supply, with the nominal spread of par 30-year MBS to the 7.5-year Treasury at 77 bp, wider from the end of May by 15 bp. Spreads look vulnerable to going still wider as the Fed likely leans into tapering or tapering-and-hiking faster than its 2013-to-2015 cycle.
The view in credit
Fundamental credit looks strong and generally continues to improve, helped by Covid reopening and low rates. However, some credits will have to slowly adjust as the Fed slows the flow of liquidity into the market. Consumers continue to look strong with equities and real estate higher and still historically low. Consumers have not added much debt. Corporate balance sheets have taken on more leverage, although mitigated by strong cash balances and low interest costs. EBITDA-to-interest-expense is at healthy levels. Strong economic growth in 2021 and 2022 should lift most EBITDA and continue easing credit concerns. Eventually, rising interest expense in 2023 should compete with EBITDA growth. Fundamental credit should hinge on whether the Fed can orchestrate a soft landing as it starts to tighten financial conditions.