The Big Idea
Here’s the one thing you need to understand CLO loan risk
Steven Abrahams | August 20, 2021
This document is intended for institutional investors and is not subject to all of the independence and disclosure standards applicable to debt research reports prepared for retail investors.
When it comes to the risk a CLO manager takes in a loan portfolio, the market is awash in numbers. Weighted average spread, rating, price, liquidity, loan size, the count of ‘CCC’ and defaulted loans, the issuer and industry concentrations, the manager’s trading strategy and the list goes on. It is hard to compare all these numbers across portfolios. It is harder to do the job even within a single portfolio across time. But if investors had to pick only a single number for measuring loan portfolio risk, there is a simple and compelling solution.
Investors in many other asset classes—equities, fixed income, alternative assets and beyond—routinely measure portfolio risk by comparing it to risk in a broad reference market. In the case of a portfolio of leveraged loans, the natural reference market is the broad market in leveraged loans. The S&P/LSTA Leveraged Loan Index is the natural candidate. And the single, summary measure of risk is the portfolio beta.
Beta captures the volatility of returns relative to a broad market index. A portfolio that matches index returns—posting a 1% gain on average when the index posts a 1% gain and posting a 1% loss when the index posts a 1% loss—would have a beta of 1.0. A portfolio with twice the volatility—posting a 2% gain when the index posts a 1% gain and posting a 2% loss when the index posts a 1% loss—would have a beta of 2.0. A portfolio with half the volatility would have a beta of 0.5. And since the beta uses the full return history of the portfolio, it reflects the amount of risk not just in one period but over the life of the deal.
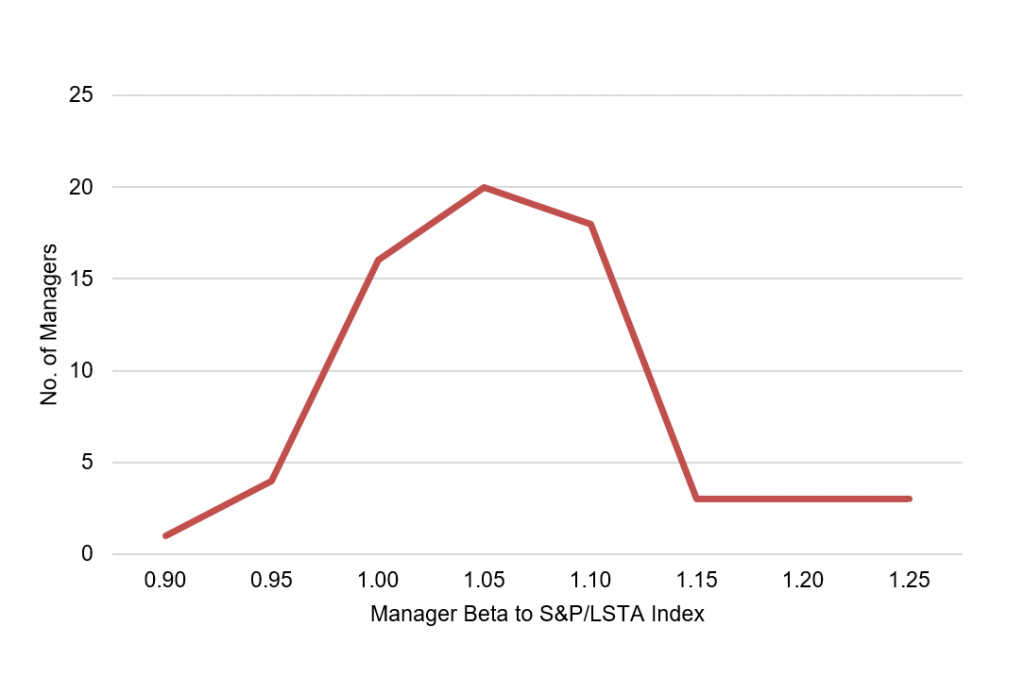
The average CLO portfolio through July showed an average beta of 1.03 and ranged between 0.90 and 1.25 (Exhibit 1). In other words, the average portfolio rises and falls at 103% of the magnitude of the broad market, while some portfolios rock back and forth at only 90% and others rocket back and forth at up to 125%.
Exhibit 1: CLO portfolio beta averages 1.03 but ranges from 0.90 to 1.25

Source: Amherst Pierpont Securities
To see why beta can capture much of the blizzard of numbers that surround portfolio comparisons, it helps to calculate beta for a series of portfolios with clearly different levels of risk. An exercise of this sort could include portfolios with credit quality that falls clearly from high to low. For example:
- Only ‘BB’ loans, among the highest credit quality in the market
- Only the 100 largest loans, among the most liquid
- Middle market loans, among the least liquid
- Only ‘B’ loans, lower in credit quality
- Only second lien loans, lower still in credit quality
- Only ‘CCC’ loans, among the lowest in credit quality
As credit quality falls and risk rises, beta should rise, too. After all, the price of leveraged loans largely reflects the changing views of credit embedded in spreads. In bullish markets, weaker credits should rise faster than average. In bearish markets, weaker credit should fall faster. Liquidity, a separate risk, is more complex. Illiquid assets trade infrequently, and their observed price tends to change less frequently. That typically reduces the beta of illiquid assets
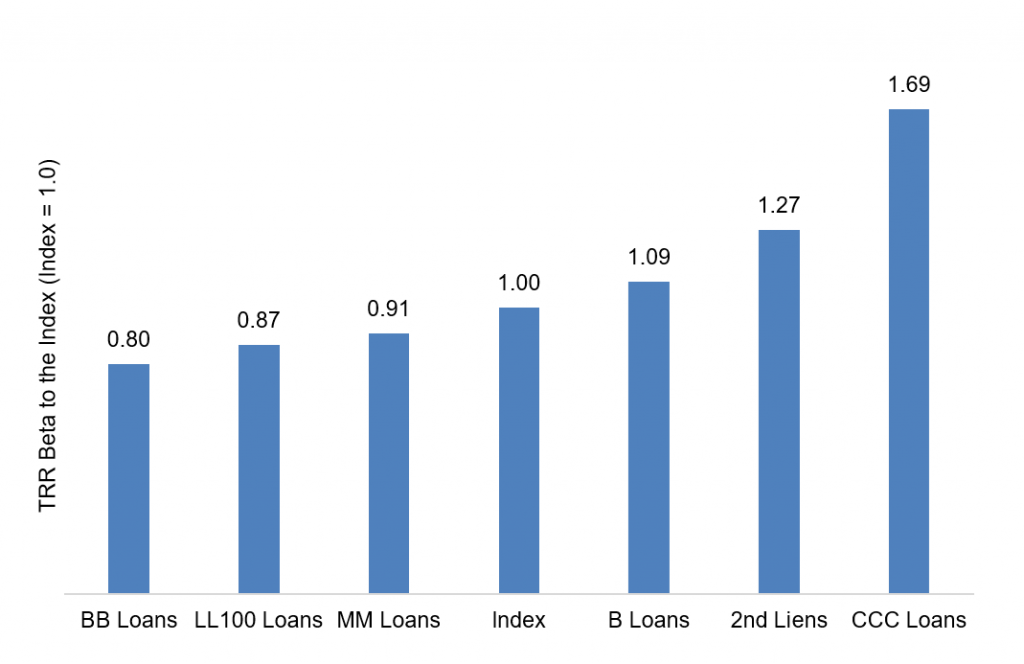
Taking each portfolio of the type outlined and calculating beta against the S&P/LSTA Leveraged Loan Total Return Index recovers an intuitive ordering of risk (Exhibit 2):
- ‘BB’ loans show the lowest beta of 0.80
- The 100 largest and most liquid loans show a beta of 0.87
- Middle market loans show a beta of 0.91
- ‘B’ loans show a beta of 1.09
- Second liens show a beta of 1.27
- ‘CCC’ loans show a beta of 1.69
Exhibit 2: Separate loan portfolios show beta that align with risk

Note: Calculated based on monthly returns from January 2011 to July 2021.
Source: LCD, Amherst Pierpont Securities
Any CLO portfolio beta is simply a mix of the betas of the underlying loans, weighted by the market value of the loan exposures. A portfolio with 50% of market value in ‘BB’ and 50% ‘B’, for example, would have a beta of 50% of 0.80 and 50% of 1.09, or 0.945.
Portfolio beta neatly summarizes the risk in a portfolio relative to a broad market, and that holds even if the risk of the broad market is changing over time. The leveraged loan market over the last few years has seen average loan rating decline, for instance. If a CLO loan portfolio’s rating declined more slowly than the market, beta could drop. If it declined faster, beta could rise.
Beta has clear implications for CLO equity through its impact on NAV volatility. In a CLO with 10 points of equity and a portfolio beta of 1.0, for example, a 0.5% drop in the broad market should reduce equity NAV by half a point or 5%. In an identical structure with a portfolio beta of 2.0, however, the same drop in the broad market would reduce NAV by one point or 10%. As beta goes, so goes equity NAV. Higher beta means more NAV volatility.
Beta also has clear implications for CLO debt through its impact on equity. In any corporate structure, equity volatility affects debt spreads. The equity class can effectively turn in the keys to the company if loan value declines far enough, putting the loan portfolio to debtholders at a strike price equal to the par value of debt. The debt classes are short put options to equity. As a practical matter, this is only likely to happen in a CLO well after the end of reinvestment. But it shapes debt spreads throughout the life of the deal. All else equal, the more volatile the equity value, the wider the fair spread on debt. Equity volatility has the most impact on spreads in the most subordinate debt and decreasing impact as debt becomes more senior.
Seasoned students of CLO loan portfolios may have good intuition for much of the information that beta reflects. But for other investors rudderless in a sea of CLO statistics, beta may be the one number everyone needs to know.


