The Big Idea
Managers chase a hot loan market through July
This material is a Marketing Communication and does not constitute Independent Investment Research.
The race between the average CLO manager and the broad market in leveraged loans came right down to the wire for the three months ending in July, but the market leaned across the tape one risk-adjusted basis point ahead. The market has rewarded risk well since March 2020, and the average CLO portfolio now carries a little extra. Most managers still struggle to find other ways to add return. But holding smaller, less liquid loans has been one way to get ahead.
Finishing just behind the index
After accounting for managers’ reporting dates, the S&P/LSTA Total Return Index delivered 1.33% over the three reporting periods ending in July. The average loan portfolio for managers with five or more active deals had a beta to the index of 1.03, reflecting slightly more risk than the index itself. With that beta, the average portfolio should have printed 1.37%. But the average portfolio instead gained 1.36%, finishing behind the index by 1 bp.
Managers showed the usual range of risk profiles and excess return. Manager betas ranged from 0.90 to 1.25, indicating volatility of portfolio returns ranging between 90% and 125% of the broad index (Exhibit 1A). After multiplying index returns by each manager’s beta and looking at any return left over, excess return ranged from negative 40 bp to positive 55 bp or more (Exhibit 1B).
Exhibit 1A: Manager average beta through July ranged between 0.90 and 1.25
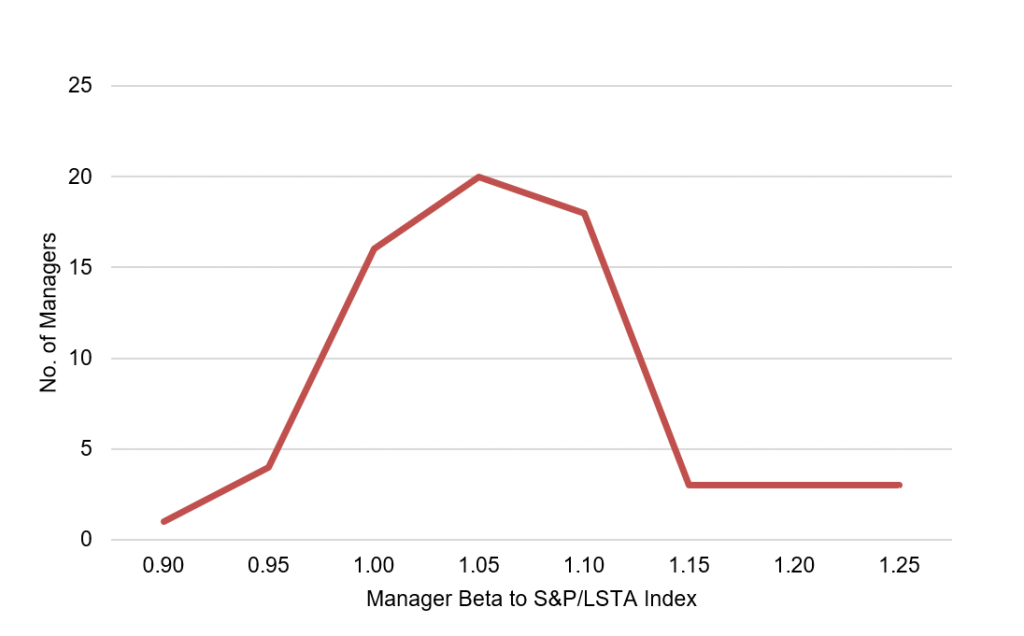
Note: Manager beta calculated based on active deals with at least 18 months of accurate data. Where no beta can be calculated, the analysis uses the average beta across each manager’s active deals weighted by the average deal principal. Results for managers with five or more active deals only.
Source: Amherst Pierpont Securities
Exhibit 1B: Manager average excess return ranged from (0.40%) to 0.55%
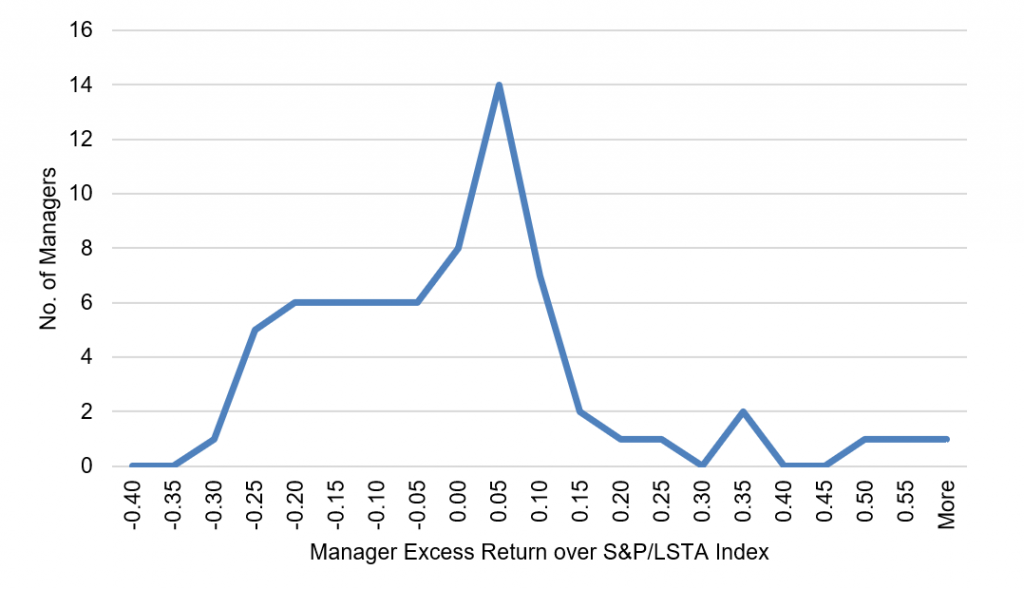
Note: Manager alpha or excess return calculated by multiplying index returns over the deal reporting period by deal beta and subtracting the result from realized returns. Results for managers with five or more active deals only.
Source: Amherst Pierpont Securities
Chasing a hot market
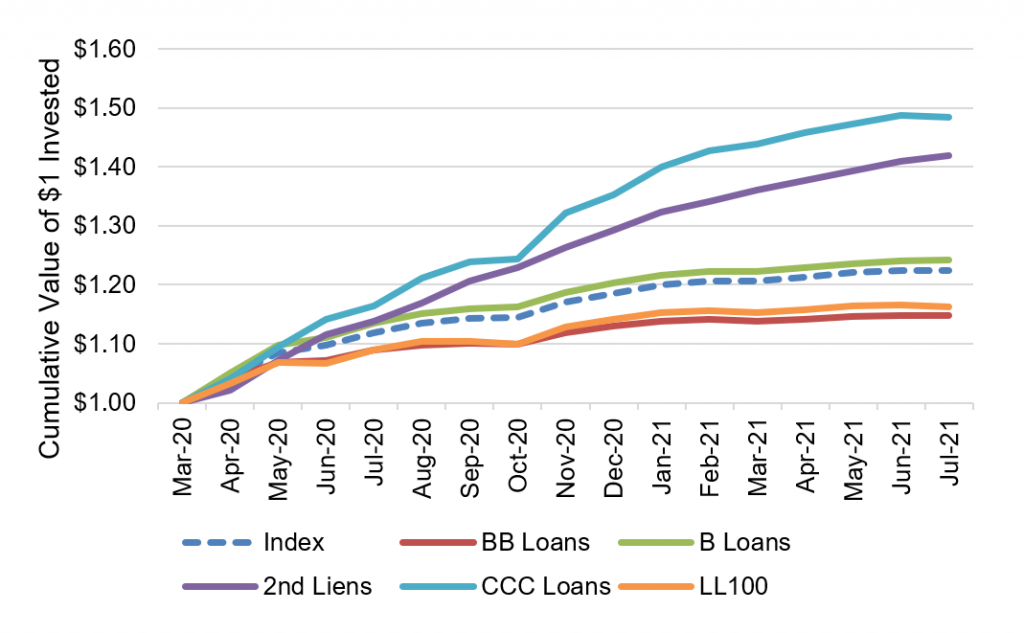
Managers have had to chase a market since March 2020 where taking risk has earned better returns than the index. The index through July has delivered a cumulative 22.5%, but returns have varied on either side depending on risk (Exhibit 2). ‘BB’ loans, which are safer than an index that now averages a ‘B’ credit, have returned a cumulative 14.7%. The 100 largest leveraged loans, which are more liquid than the average index loan, have returned a cumulative 16.3%. ‘B’ loans have generated a cumulative 24.1%, second liens a cumulative 41.9% and ‘CCC’ loans a cumulative 48.4%.
Exhibit 2: With risk has come cumulative return since March 2020
Source: LCD, Amherst Pierpont Securities
Correlates of success
Although there is no single formula for success, managers generating returns beyond those predicted by beta alone have tended to show a few noticeable characteristics:
- Relatively low beta, or lower return volatility than the broad market
- Relatively high weighted average rating factor and weighted average spread
- Relatively low bid depth
This pattern points to portfolios overweight smaller, less liquid loans. These loans tend to show less price sensitivity, lowering their return volatility and their beta to the broad market. Rating agency criteria also tend to penalize loans backed by smaller facilities, raising their WARF and WAS. Issuers of smaller loans tend to have more product concentration, client concentration or both, often warranting a lower rating. But some CLO managers specialize in these loans, arguing that the issuers may still have sound balance sheets with relatively strong margins and relatively low leverage. Good diversification across smaller issuers can mitigate much of the idiosyncratic risk.
Among the 30 managers that beat the index for the three months ending in July, eight or 27% showed average bid depth below the 20th percentile. Of the 38 managers that matched or lost to the index, only five or 13% showed bid depth below the 20th percentile. Names in the Top 30 with lower bid depth included Anchorage (2 percentile), Credit Suisse (20 percentile), Denali (19 percentile), Golub (14 percentile), Guggenheim (12 percentile), Marathon (11 percentile), Napier Park (16 percentile) and ZAIS (8 percentile),
Through July, the Top 5 managers delivering the most excess return included Canyon, ZAIS, Symphony, Anchorage and KKR. The full list of managers finishing ahead of the index is below (Exhibit 3).
Exhibit 3: CLO loan portfolio performance for the three reporting periods ending July 2021
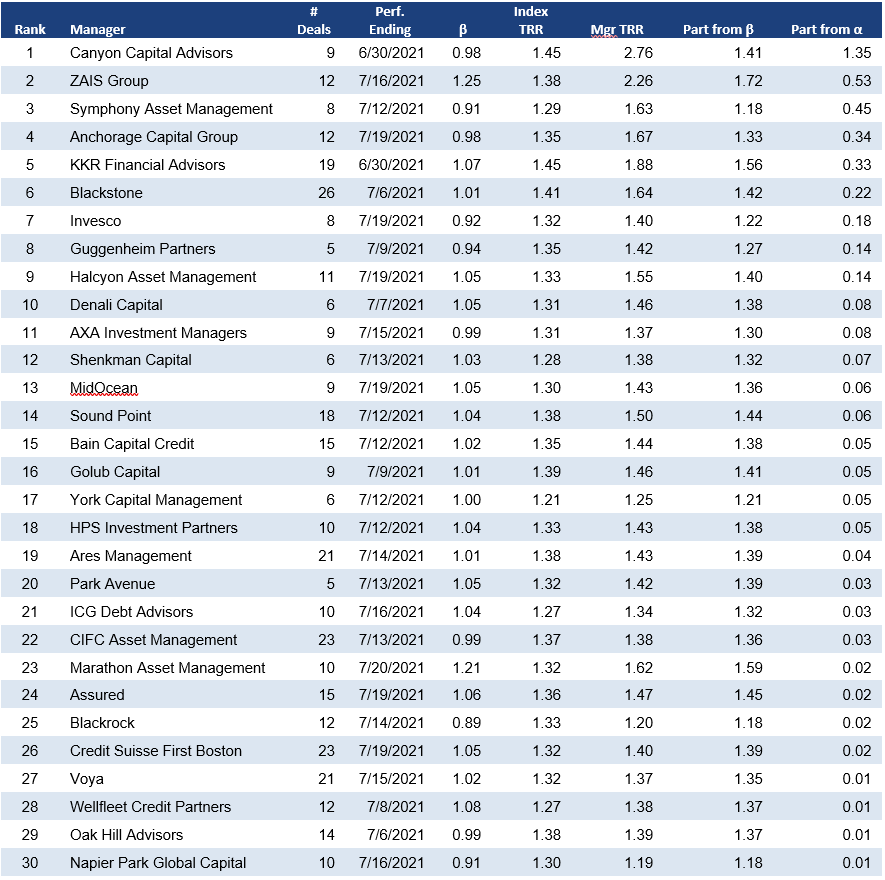
Note: Performance for managers with five or more deals tracked by APS. Performance attribution starts with calculated total return on the leveraged loan portfolio held in each CLO for the 3-month reporting period ending on the indicated date. CLOs, even with a single manager platform, may vary in reporting period. The analysis matches performance in each period to performance over the identical period in the S&P/LSTA Leveraged Loan Index. Where a deal has at least 18 months of performance history since pricing and no apparent errors in cash flow data, the analysis calculates a deal beta. The deal beta is multiplied by the index return to predict deal return attributable to broad market performance. Where no beta can be calculated, the analysis uses the average beta across each manager’s active deals weighted by the average deal principal
Source: Amherst Pierpont Securities
This material is intended only for institutional investors and does not carry all of the independence and disclosure standards of retail debt research reports. In the preparation of this material, the author may have consulted or otherwise discussed the matters referenced herein with one or more of SCM’s trading desks, any of which may have accumulated or otherwise taken a position, long or short, in any of the financial instruments discussed in or related to this material. Further, SCM may act as a market maker or principal dealer and may have proprietary interests that differ or conflict with the recipient hereof, in connection with any financial instrument discussed in or related to this material.
This message, including any attachments or links contained herein, is subject to important disclaimers, conditions, and disclosures regarding Electronic Communications, which you can find at https://portfolio-strategy.apsec.com/sancap-disclaimers-and-disclosures.
Important Disclaimers
Copyright © 2026 Santander US Capital Markets LLC and its affiliates (“SCM”). All rights reserved. SCM is a member of FINRA and SIPC. This material is intended for limited distribution to institutions only and is not publicly available. Any unauthorized use or disclosure is prohibited.
In making this material available, SCM (i) is not providing any advice to the recipient, including, without limitation, any advice as to investment, legal, accounting, tax and financial matters, (ii) is not acting as an advisor or fiduciary in respect of the recipient, (iii) is not making any predictions or projections and (iv) intends that any recipient to which SCM has provided this material is an “institutional investor” (as defined under applicable law and regulation, including FINRA Rule 4512 and that this material will not be disseminated, in whole or part, to any third party by the recipient.
The author of this material is an economist, desk strategist or trader. In the preparation of this material, the author may have consulted or otherwise discussed the matters referenced herein with one or more of SCM’s trading desks, any of which may have accumulated or otherwise taken a position, long or short, in any of the financial instruments discussed in or related to this material. Further, SCM or any of its affiliates may act as a market maker or principal dealer and may have proprietary interests that differ or conflict with the recipient hereof, in connection with any financial instrument discussed in or related to this material.
This material (i) has been prepared for information purposes only and does not constitute a solicitation or an offer to buy or sell any securities, related investments or other financial instruments, (ii) is neither research, a “research report” as commonly understood under the securities laws and regulations promulgated thereunder nor the product of a research department, (iii) or parts thereof may have been obtained from various sources, the reliability of which has not been verified and cannot be guaranteed by SCM, (iv) should not be reproduced or disclosed to any other person, without SCM’s prior consent and (v) is not intended for distribution in any jurisdiction in which its distribution would be prohibited.
In connection with this material, SCM (i) makes no representation or warranties as to the appropriateness or reliance for use in any transaction or as to the permissibility or legality of any financial instrument in any jurisdiction, (ii) believes the information in this material to be reliable, has not independently verified such information and makes no representation, express or implied, with regard to the accuracy or completeness of such information, (iii) accepts no responsibility or liability as to any reliance placed, or investment decision made, on the basis of such information by the recipient and (iv) does not undertake, and disclaims any duty to undertake, to update or to revise the information contained in this material.
Unless otherwise stated, the views, opinions, forecasts, valuations, or estimates contained in this material are those solely of the author, as of the date of publication of this material, and are subject to change without notice. The recipient of this material should make an independent evaluation of this information and make such other investigations as the recipient considers necessary (including obtaining independent financial advice), before transacting in any financial market or instrument discussed in or related to this material.
Important disclaimers for clients in the EU and UK
This publication has been prepared by Trading Desk Strategists within the Sales and Trading functions of Santander US Capital Markets LLC (“SanCap”), the US registered broker-dealer of Santander Corporate & Investment Banking. This communication is distributed in the EEA by Banco Santander S.A., a credit institution registered in Spain and authorised and regulated by the Bank of Spain and the CNMV. Any EEA recipient of this communication that would like to affect any transaction in any security or issuer discussed herein should do so with Banco Santander S.A. or any of its affiliates (together “Santander”). This communication has been distributed in the UK by Banco Santander, S.A.’s London branch, authorised by the Bank of Spain and subject to regulatory oversight on certain matters by the Financial Conduct Authority (FCA) and the Prudential Regulation Authority (PRA).
The publication is intended for exclusive use for Professional Clients and Eligible Counterparties as defined by MiFID II and is not intended for use by retail customers or for any persons or entities in any jurisdictions or country where such distribution or use would be contrary to local law or regulation.
This material is not a product of Santander´s Research Team and does not constitute independent investment research. This is a marketing communication and may contain ¨investment recommendations¨ as defined by the Market Abuse Regulation 596/2014 ("MAR"). This publication has not been prepared in accordance with legal requirements designed to promote the independence of research and is not subject to any prohibition on dealing ahead of the dissemination of investment research. The author, date and time of the production of this publication are as indicated herein.
This publication does not constitute investment advice and may not be relied upon to form an investment decision, nor should it be construed as any offer to sell or issue or invitation to purchase, acquire or subscribe for any instruments referred herein. The publication has been prepared in good faith and based on information Santander considers reliable as of the date of publication, but Santander does not guarantee or represent, express or implied, that such information is accurate or complete. All estimates, forecasts and opinions are current as at the date of this publication and are subject to change without notice. Unless otherwise indicated, Santander does not intend to update this publication. The views and commentary in this publication may not be objective or independent of the interests of the Trading and Sales functions of Santander, who may be active participants in the markets, investments or strategies referred to herein and/or may receive compensation from investment banking and non-investment banking services from entities mentioned herein. Santander may trade as principal, make a market or hold positions in instruments (or related derivatives) and/or hold financial interest in entities discussed herein. Santander may provide market commentary or trading strategies to other clients or engage in transactions which may differ from views expressed herein. Santander may have acted upon the contents of this publication prior to you having received it.
This publication is intended for the exclusive use of the recipient and must not be reproduced, redistributed or transmitted, in whole or in part, without Santander’s consent. The recipient agrees to keep confidential at all times information contained herein.


