


The Big Idea
The risk in a riskless rate
Steven Abrahams | August 6, 2021
This material is a Marketing Communication and does not constitute Independent Investment Research.
The shift from LIBOR to SOFR has accelerated in the last few weeks and brought new attention to a subtle difference between the rates. LIBOR has often reflected a credit premium, especially during crisis, while SOFR is a riskless rate. The difference may be small in most markets, but in crisis it stands to reshape the way investors hedge and price risk assets. The shift from risk to a riskless rate should seep into pricing as more assets lean into the transition.
The risk and the riskless
LIBOR and SOFR are supposed to be different by design, starting with the depth and liquidity of the transactions used to set the rates. As the Alternative Reference Rate Committee pointed out in a March 2018 report, the median daily volume of transactions then used to set 3-month LIBOR was less than $1 billion with the setting on many days based on less than $500 million in trades. By comparison, the volume of transactions used to set SOFR on an average day in July this year was $889 billion. The higher volume should make SOFR a more accurate measure of the cost of borrowing and less subject to market manipulation.
But the rates also differ by design on credit. LIBOR has always represented the rate where banks can get unsecured wholesale term loans. SOFR represents the median rate for overnight repo against Treasury debt. LIBOR consequently reflects the credit of banks submitting rates to the LIBOR panel. SOFR represents the rate for an effectively riskless collateralized loan.
In practice, the difference in LIBOR and SOFR credit shows up in the markets. March of 2020 offers a striking example. LIBOR rates declined from late February into mid-March as the Fed cut the funds target on March 3 from between 1.50% and 1.75% to between 1.00% and 1.25% and as Covid affected broad parts of the US and global economy. When the Fed lowered target rates on March 15 to between 0% and 0.25% and broad parts of the US economy started shutting down, LIBOR reversed course and went up. SOFR, on the other hand, declined with target fed funds and went to 0.01% by mid-March. At the end of March, 3-month LIBOR stood at 145 bp and SOFR stood at 1 bp (Exhibit 1).
Exhibit 1: LIBOR went up in March 2020 while SOFR went down
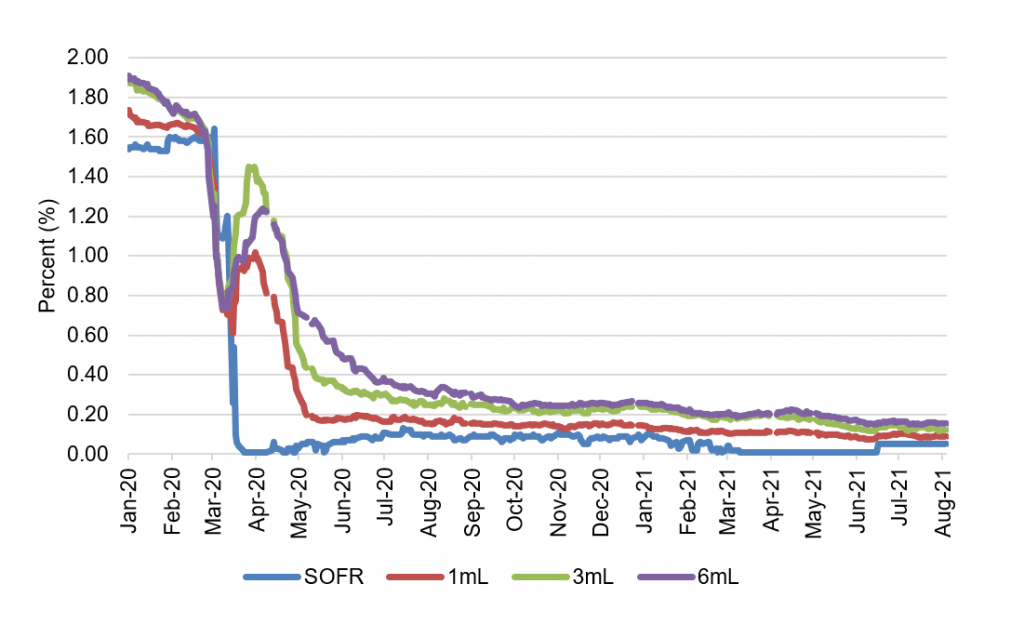
Source: Bloomberg, Amherst Pierpont Securities
The gap that opened between LIBOR and SOFR was not the first time a risk rate and a riskless rate parted ways in a crisis. Gaps between 1-month LIBOR and 1-month Treasury bill rates, for instance, have been muted for more than a decade as low rates in general have put a cap on the potential differences (Exhibit 2). But from mid-2005 through mid-2007 when all rates were higher, gaps of more than 50 bp opened frequently. And from mid-2007 into early 2009, gaps of more than 100 bp opened frequently. The gap reflects market opinion about differences between bank and US government ability to fund and make good on debt obligations.
Exhibit 2: 1-month LIBOR and T-bills have repeatedly parted ways this century
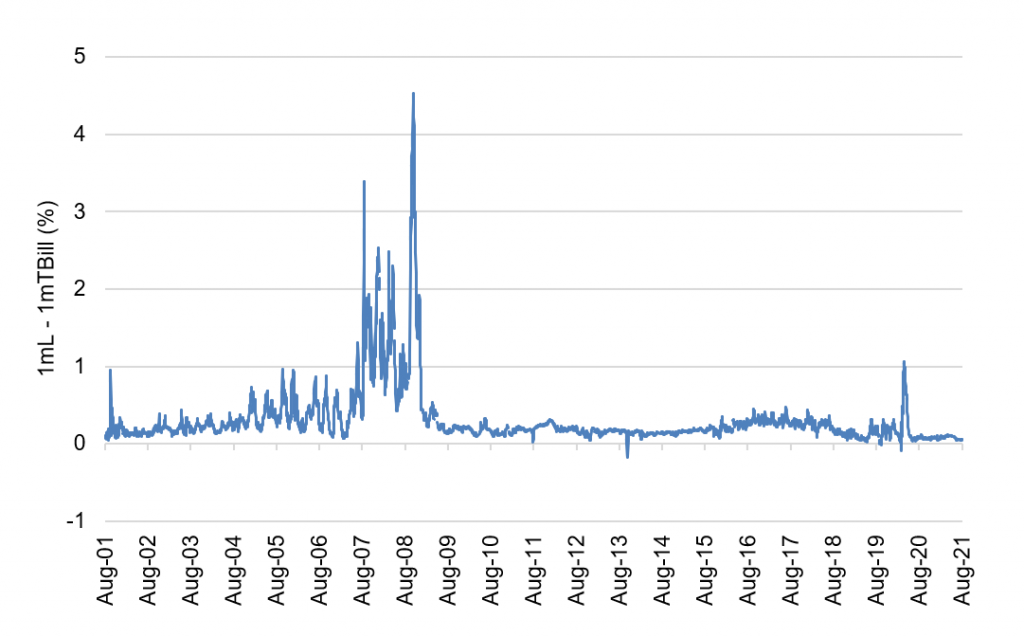
Source: Bloomberg, Amherst Pierpont Securities
The process for transitioning from LIBOR to SOFR recognizes the difference between the rates and builds in a fixed spread added to SOFR to try to compensate for the difference. The spread is calculated as the median difference between SOFR and various LIBOR term rates for the five years ending this year on March 5. But that only captures the fair spread over that 5-year term. The fair spread in future 5-year terms may be different.
The cost of hedging in a crisis
The difference between a risk and a riskless rate should work its way into pricing the interest rate swaps often used to hedge risk assets, and that could change the cost and efficiency of hedging. In an orderly market, a risk asset such as MBS trades with a high correlation to both LIBOR swap rates and Treasury rates. The difference between the correlation of MBS to swap rates, or example, is only slightly different than the correlation of MBS to Treasury rates. For example, from early 2001 through early 2007 and again from 2010 into early 2020, the daily change in the par 30-year MBS rate and the daily change in 10-year swap and Treasury rates routinely correlated above 0.90. The difference between the swap and Treasury correlation was always less than 0.10 (Exhibit 3). After the bursting of the Internet bubble in 2001 and the Great Financial Crisis of 2008 and again with Covid in the spring of 2020, the correlation between both MBS and swap rates and MBS and Treasury rates both deteriorated. The running 30-day correlation between daily changes in MBS and other rates dropped below 0.50. However, the correlation with changing swap rates routinely ran 0.10 or more above the correlation with changing Treasury rates. In crisis, a swap referencing a risk rate became a better hedge.
Exhibit 3: In crisis, swap rates correlate better with MBS than Treasury rates
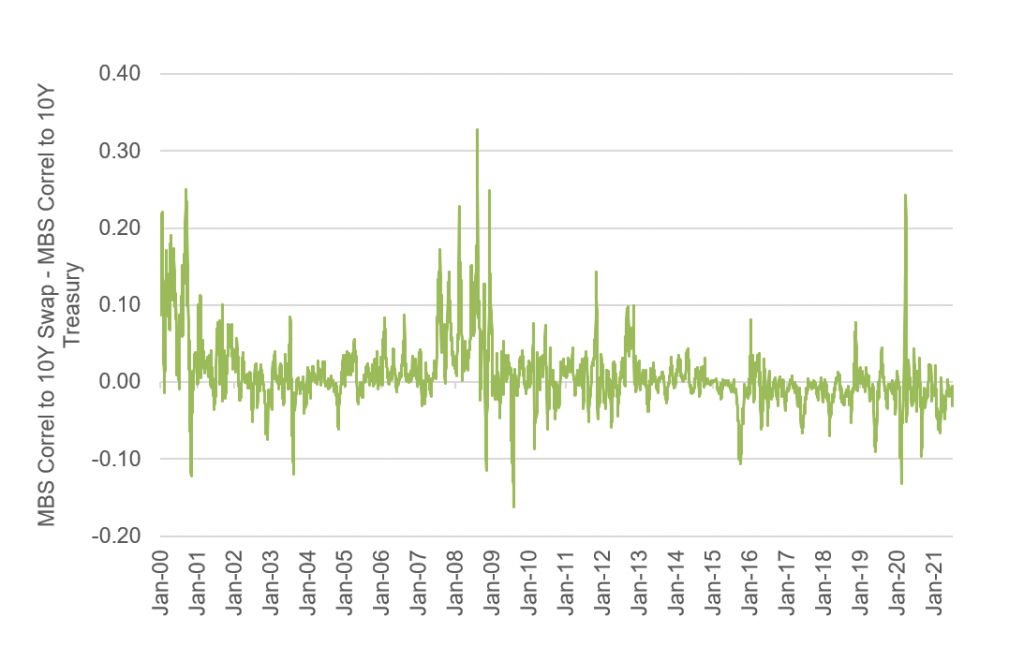
Note: Data shows the difference between (i) the rolling 30-day correlation between daily changes in the par 30Y MBS rate and daily changes in the 10Y swap rate and (ii) the rolling 30-day correlation between daily changes in the par 30Y MBS rate and daily changes in the 10Y Treasury rate. A positive number means the swap rate is more correlated to MBS than the Treasury rate is, a negative number means the Treasury rate is more correlated.
Source: Bloomberg, Amherst Pierpont Securities.
The slightly better correlation between MBS and LIBOR swap rates suggests swap rates include a shared risk premium with MBS. The shared risk premium makes LIBOR swaps a better hedge for MBS in a crisis and slightly lowers the cost and P&L volatility of hedging. In practice, many portfolios hedging interest rate risk in MBS or corporate or structured credit have long used mainly LIBOR swaps rather than Treasury instruments. A switch to SOFR swaps, however, should make results much closer to hedging with Treasury debt.
The cost of repricing in a crisis
The arguably more interesting implication of a riskless reference rate is for the repricing of floating-rate risk assets in a crisis. Imagine, as a hypothetical, that a bank issued two tranches of floating-rate debt in January 2020 identical in all ways except the reference rate. One tranche would float off 3-month LIBOR the other off SOFR. Each tranche would have a different fixed margin over the index to account for the issuers’ unique credit and average differences in the index setting. In all likelihood, the initial coupons would be relatively close together if not identical. By the end of March 2020, however, the difference between the LIBOR coupon and the SOFR coupon would increase by 144 bp, reflecting the different directions of the two rates in the first month of the Covid crisis. The LIBOR rate would capture the market’s view of the fair risk premium for lending to banks, and that tranche should be closest to par. The SOFR rate would miss the fair risk premium, and the market would have to adjust by pushing the price of that tranche well below the LIBOR tranche. The SOFR index, in other words, has added price volatility to the risk asset.
Fannie Mae, Freddie Mac, many large banks and some corporations have issued SOFR debt where the index will likely move with riskless rates in the next crisis. If these and other borrowers can continue issuing debt where the interest cost will likely go down in the next crisis, the appeal is obvious. After the end of this year, the Alternative Reference Rate Committee wants to end all new floating-rate debt tied to LIBOR. The question is whether investors will let issuers get the benefit of SOFR without charging for it. Current protocol sets the fixed spread between 3-month LIBOR and SOFR at 26.161 bp. A borrower issuing at a spread of 50 bp over 3-month LIBOR, for instance, should be able to issue at an all-in spread of 76.161 bp over SOFR. But the fair spread will depend on whether investors expect credit during the life of the debt to be more or less volatile than it was for the five years ending March 5.
From the perspective of investors, the likely higher price volatility of SOFR debt should require compensation. Investors drawn to floating-rate debt in hopes it will stay close to par may be especially sensitive to the new price risk. To the extent the market sees the fair price of lending to various issuers as higher than the riskless rate, the price of the risk debt will have to adjust over time as risk premiums shift. In a LIBOR instrument, much of that risk premium would get reflected in the reference index and the coupon. In a SOFR instrument, price will have to reflect the premium.
Some issuers and investors have focused on the hedging and pricing challenges of a SOFR world and offered credit-sensitive reference rates such as Ameribor or BSBY as alternatives. But so far, ARRC has made the campaign for a deep and liquid SOFR market its highest priority for weaning the market from LIBOR and has given little airtime to these alternatives.
Government agencies and the largest banks and corporations have led the way in issuing SOFR-indexed debt, but the transition from LIBOR to SOFR is moving quickly. ARRC wants to end all new LIBOR exposure by the end of this year, and all existing LIBOR exposures are scheduled to switch to SOFR or other fallback rates by June 30, 2023, less than two years from now. Through the transition, weaker corporate and structured credits may choose to fund in a SOFR market, and many legacy assets may transition from LIBOR to SOFR. In most markets, the difference between the old and new worlds will likely be hard to detect. But in a crisis, the difference should be very clear. The clock is ticking. Investors have to determine if the potential price volatility of a SOFR world requires any new risk premiums beyond the fixed spreads already baked in.
* * *
The view in rates
Fed RRP balances closed Friday at $952 billion, down from last week’s record $1.04 trillion. The Treasury General Account at the Fed still holds $42 billion more in funds than the Treasury’s $450 billion target at the end of July, but the heavy flow of cash into Fed RRP since the end of March is likely over.
Settings on 3-month LIBOR have remained steady over the last week at around 12.5 bp, still near the lowest setting ever. The flow of QE into the front end should go through 2022, so rates should stay low through next year.
The 10-year note has finished the most recent session at 1.29%, up 6 bp on the week. Strong July payrolls have given rates a boost. Breakeven 10-year inflation is at 236 bp, down on the week by 4 bp. The 10-year real rate finished the week at negative 106 bp, up 11 bp on the week. The market is starting to anticipate tapering and some end to the steady flow of Fed liquidity, helping lift real rates.
The Treasury yield curve has finished its most recent session with 2s10s at 109 bp, 5 bp steeper than a week ago. The 5s30s curve has finished at 117 bp, flatter by 2 bp.
The view in spreads
Credit spreads continue to hold their ground. Benchmark investment grade cash spreads are only wider by 1 bp from the end of May and should continue to outperform. Demand from mutual funds, international portfolios and insurers looks healthy. Low rates should continue supporting corporate balance sheet strength. Ratios of EBITDA to interest expense are in the middle of the range despite high ratios of debt to EBITDA. Investor demand for yield should keep spreads relatively tight. A strong economy should help credit spreads, but relative value flows at money managers could still soften credit spreads if MBS gets wide enough.
The prospect of Fed tapering and heavy net supply should keep weighing on MBS spreads until the Fed shows its hand and the market can price the impact. The market has already priced additional risk of soft demand and steady supply, with the nominal spread of par 30-year MBS to the 7.5-year Treasury at 74 bp, wider from the end of May by 12 bp. Spreads look vulnerable to going still wider as the Fed likely leans into tapering or tapering-and-hiking faster than its 2013-to-2015 cycle.
The view in credit
Fundamental credit looks strong and generally continues to improve, helped by Covid reopening and low rates. Consumers finished the first quarter of 2021 with net worth up $5 trillion. The second quarter should add to consumer net worth with equities and real estate higher and rates even lower. Consumers have not added much debt. Corporate balance sheets have taken on more leverage, although mitigated by strong cash balances and low interest costs. EBITDA-to-interest-expense is at healthy levels. Strong economic growth in 2021 and 2022 should lift most EBITDA and continue easing credit concerns. Eventually, rising interest expense in 2023 should compete with EBITDA growth. Fundamental credit should hinge on whether the Fed can orchestrate a soft landing as it starts to tighten financial conditions.