The Long and Short
IG corps widened in July as Treasuries rallied
This material is a Marketing Communication and does not constitute Independent Investment Research.
The Bloomberg Barclays investment grade corporate bond index widened by 6 bp of OAS in July as credit sold off modestly on a net basis amid renewed Covid concerns, although spreads firmed up as the month came to a close. The resulting excess return was -0.48%, which offset the month’s US Treasury rally to generate a 1.37% total return for the index. IG spreads have moved tighter in early August, fueled by pressure on yields and the steady stream of positive earnings reports for the second quarter of 2021.
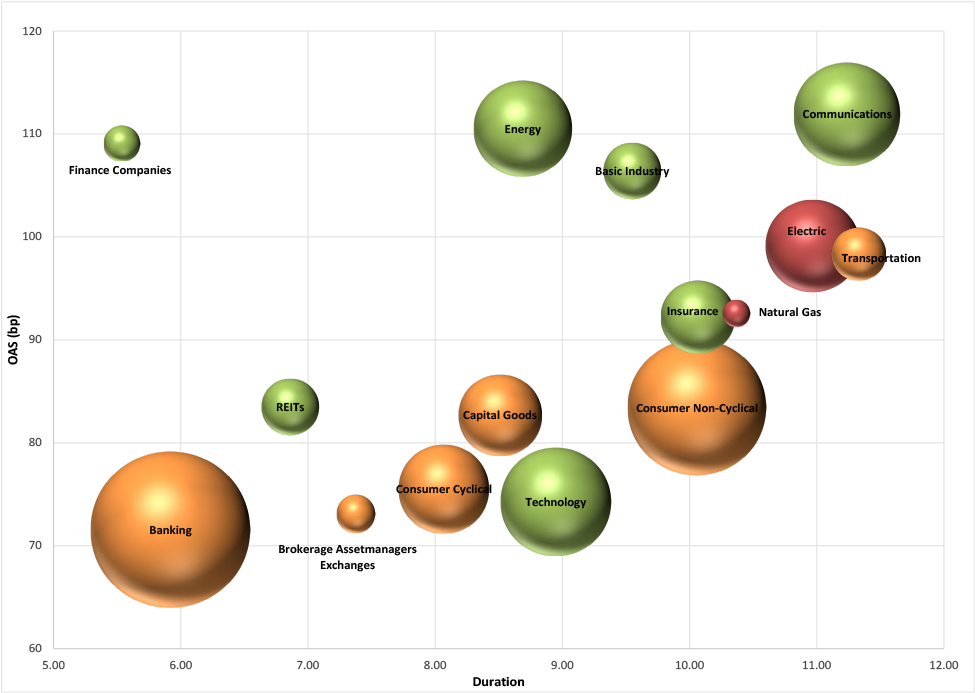
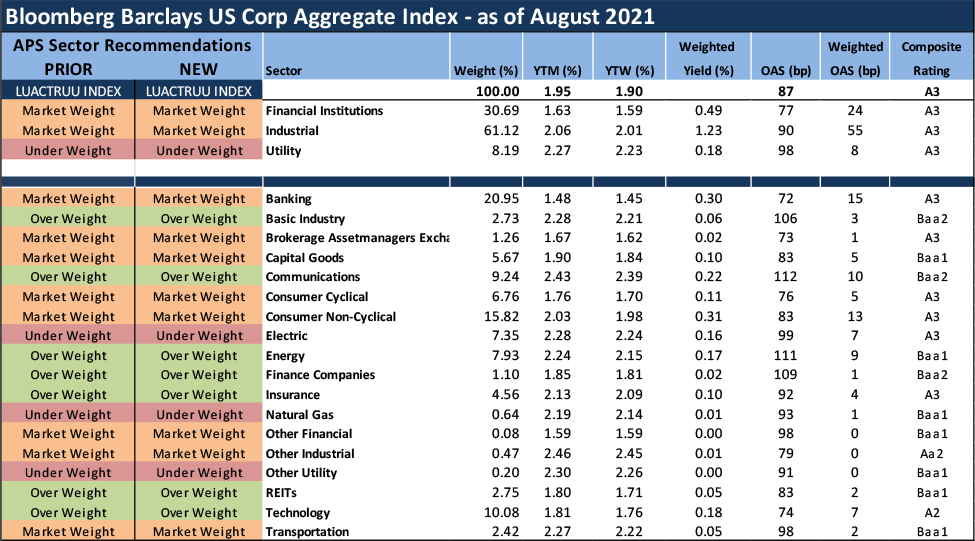
We have no changes to our sector weighting views this month. Our current positions reflect our expectations for a more rapid global economic recovery throughout 2021 than the market is currently anticipating. Exhibits 1 and 2 provide a summary of how APS expects sectors within the IG Index to perform for the next several months on an excess return basis (total return net of commensurate UST return). These weightings serve as a proxy for how we recommend that portfolio managers should position their holdings relative to the broad IG corporate bond market.
Exhibit 1 and 2. APS Sector Recommendations for August 2021
Source: Amherst Pierpont Securities, Bloomberg/Barclays US Corp Index
Color = recommendation: Green – Overweight, Red – Underweight, Yellow – Marketweight
Size = Market Value within the IG Index
Source: Amherst Pierpont Securities, Bloomberg/Barclays US Corp Index
After providing the top performance in the Index last month, communications (-0.77% excess return) dropped to the bottom, registering the single worst sector performance in July by excess return. Weakness in Discovery (DISCA: Baa3/BBB-/BBB-) resulting from the fallout of the Warner Media transaction continued to be a drag on overall sector performance, though few names were spared in the monthly sell-off for TMT. Also among the worst performing sectors were technology (-0.74%), transportation (-0.61%), energy (-0.60%) and consumer cyclical (-0.50%). REITs (0.06%) provided the top performance by sector, and one of the few segments within the Index to close the month in positive territory. Other sectors that proved resistant to the modest shake-out in credit were mostly financial. Those included finance companies (0.01%), brokers/asset managers (-0.25%), banking (-0.35%) and basic industry (-0.42%).
IG corporate bond new issue volume for the seasonally slow month of July exceeded expectations with $98.6 billion pricing throughout the month. That was enough to deliver a 35% increase over the prior year period. The monthly total was bolstered by the US money center banks issuing larger than expected debt deals after their second quarter earnings blackout periods ended, as well as sizable debt launches of $6.5 billion from Apple (AAPL: Aa1/AA+) and $4.75 billion from Dell Technologies (DELL: Baa3/BBB-/BBB-*+). High yield volume continued to outpace the prior year as the segment delivered its largest volume for the month of July on record. The market is anticipating similar IG volume for August. Early on, issuers appear to be bringing deals aggressively, taking advantage of current demand rather than waiting around for the typical seasonal deluge of issuance that follows in early September.
Exhibit 3. Supply Recap – IG issuers exceed July expectations
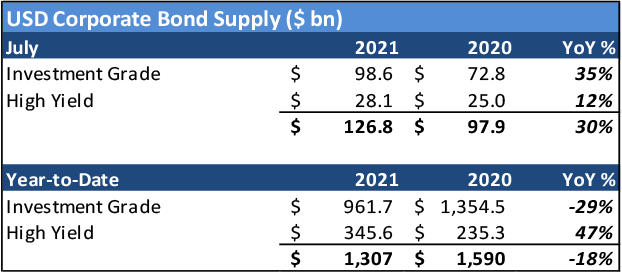
Source: Bloomberg LP
Exhibit 4. REITs and FinCos top the list while Communications underperforms
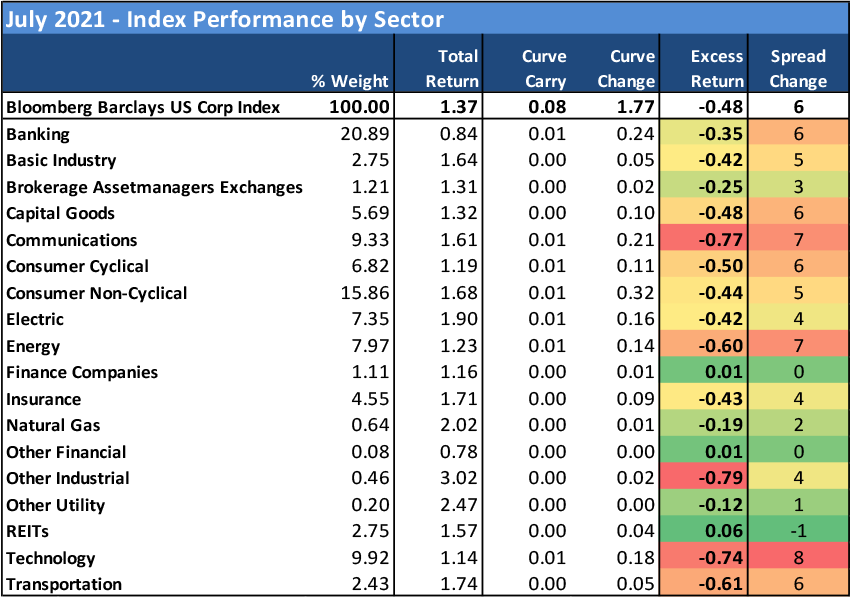
Source: Bloomberg Barclays US Corp Index
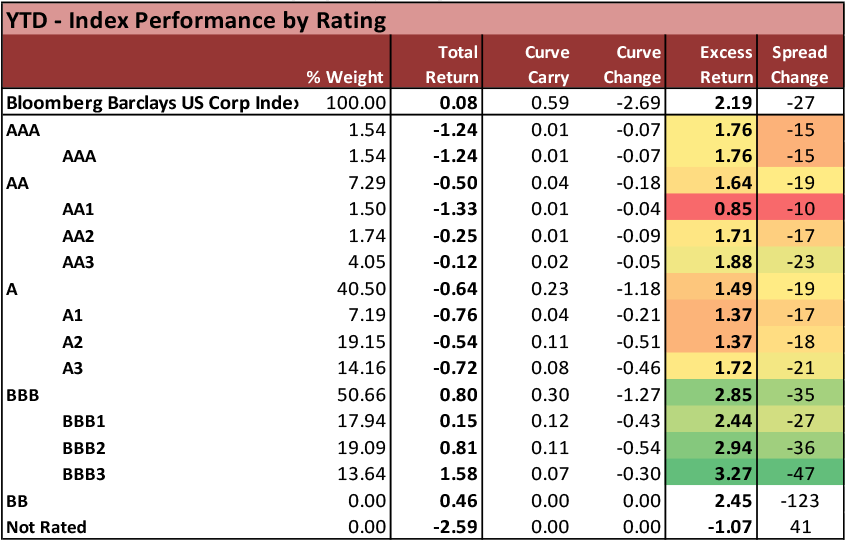
Exhibit 5. Investors favored BBB ratings despite the back-up in credit in July
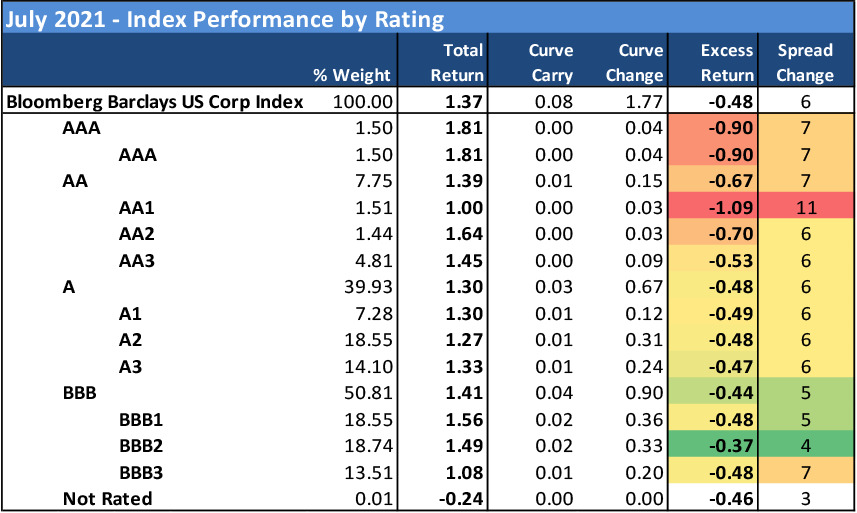
Source: Bloomberg Barclays US Corp Index
Exhibit 6. Long-dated corporate paper underperformed as treasuries rallied in the long-end
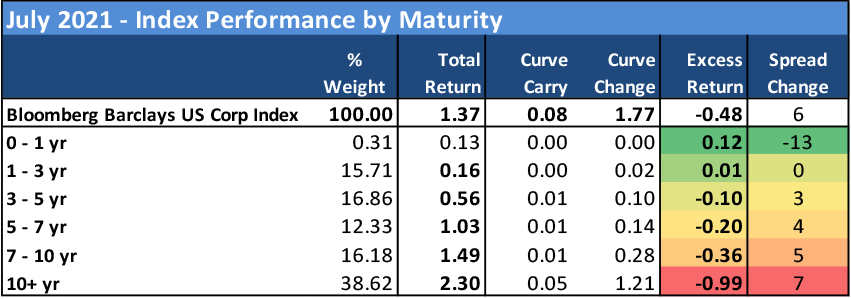
Source: Bloomberg Barclays US Corp Index
Exhibit 7. Mixed bag with some REITs returning to the top of the list, Airlines dropped to the bottom on renewed Covid concerns
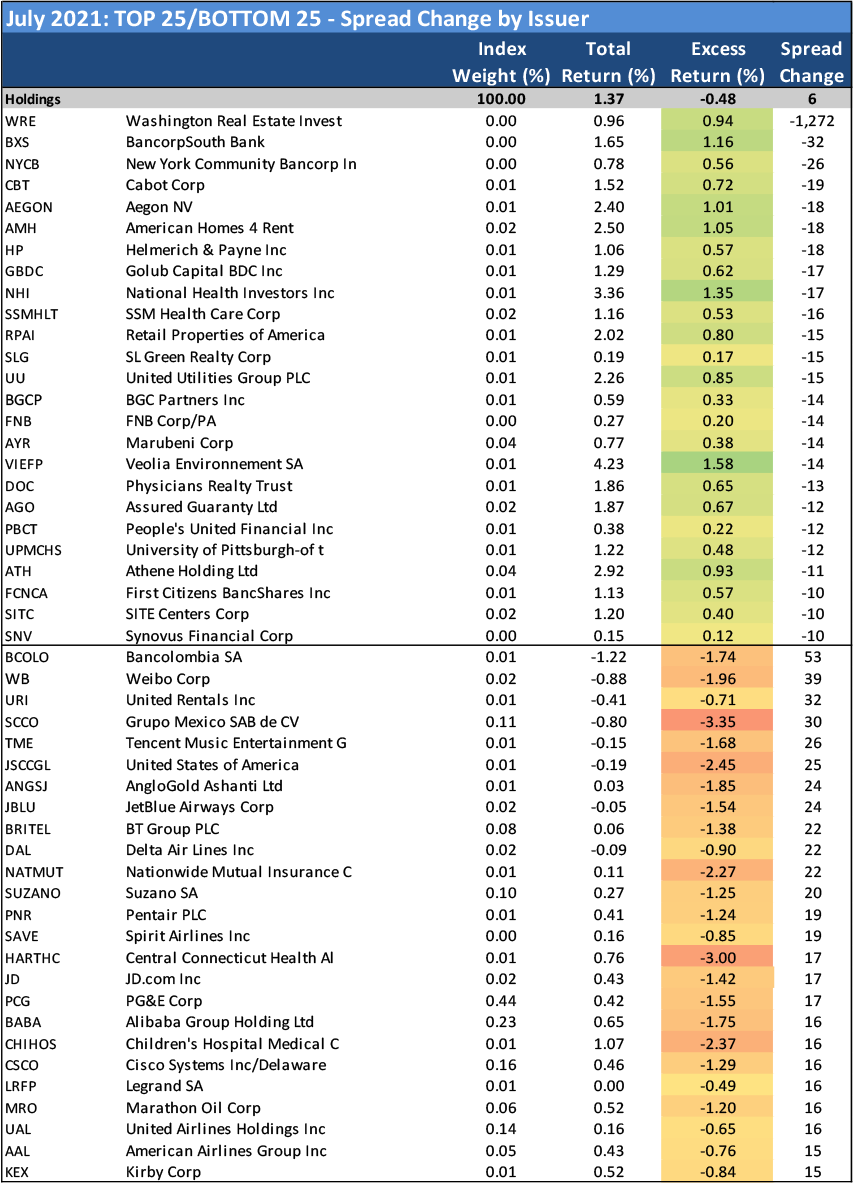
Source: Bloomberg Barclays US Corp Index
Year-to-Date Index Performances
Exhibit 8. Energy and Finance Cos have remained the prominent trades YTD
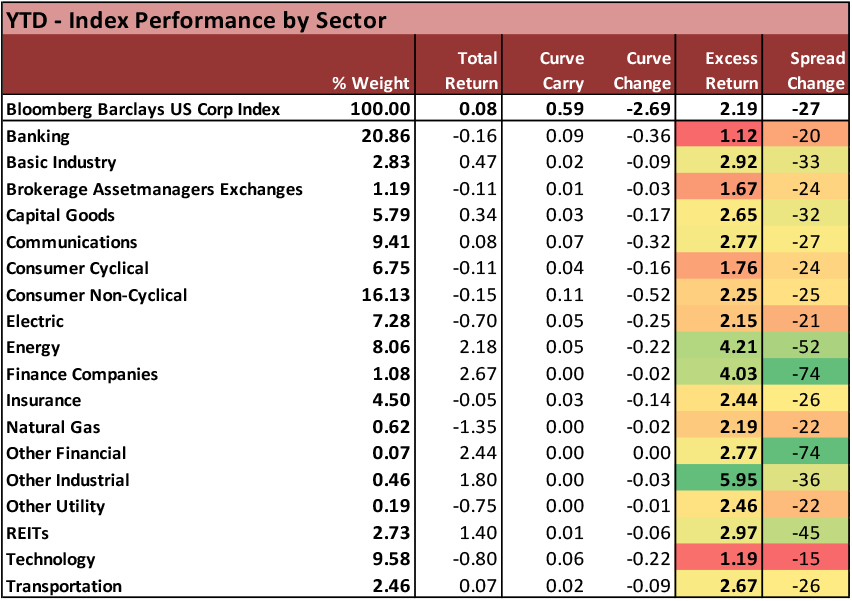
Source: Bloomberg Barclays US Corp Index
Exhibit 9. Investors still seeking higher yielding, lower rated credits YTD
Source: Bloomberg Barclays US Corp Index
Exhibit 10. Corporate investors still targeting long-end of the curve even as 10- and 30-year treasuries have been gradually recovering since March peaks
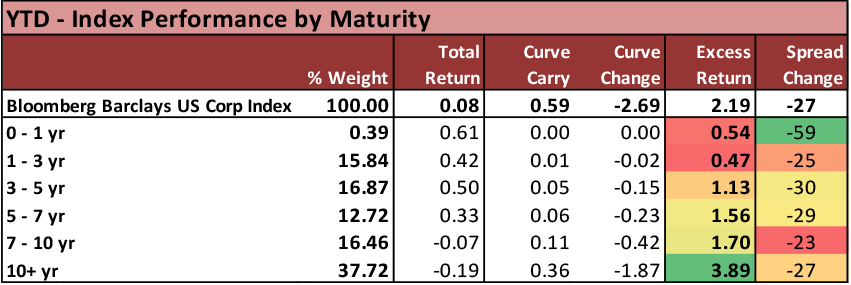
Source: Bloomberg Barclays US Corp Index
Exhibit 11. Airline credits and BDCs remain among the top credit trades of 2021 (despite the recent back-up in the former)
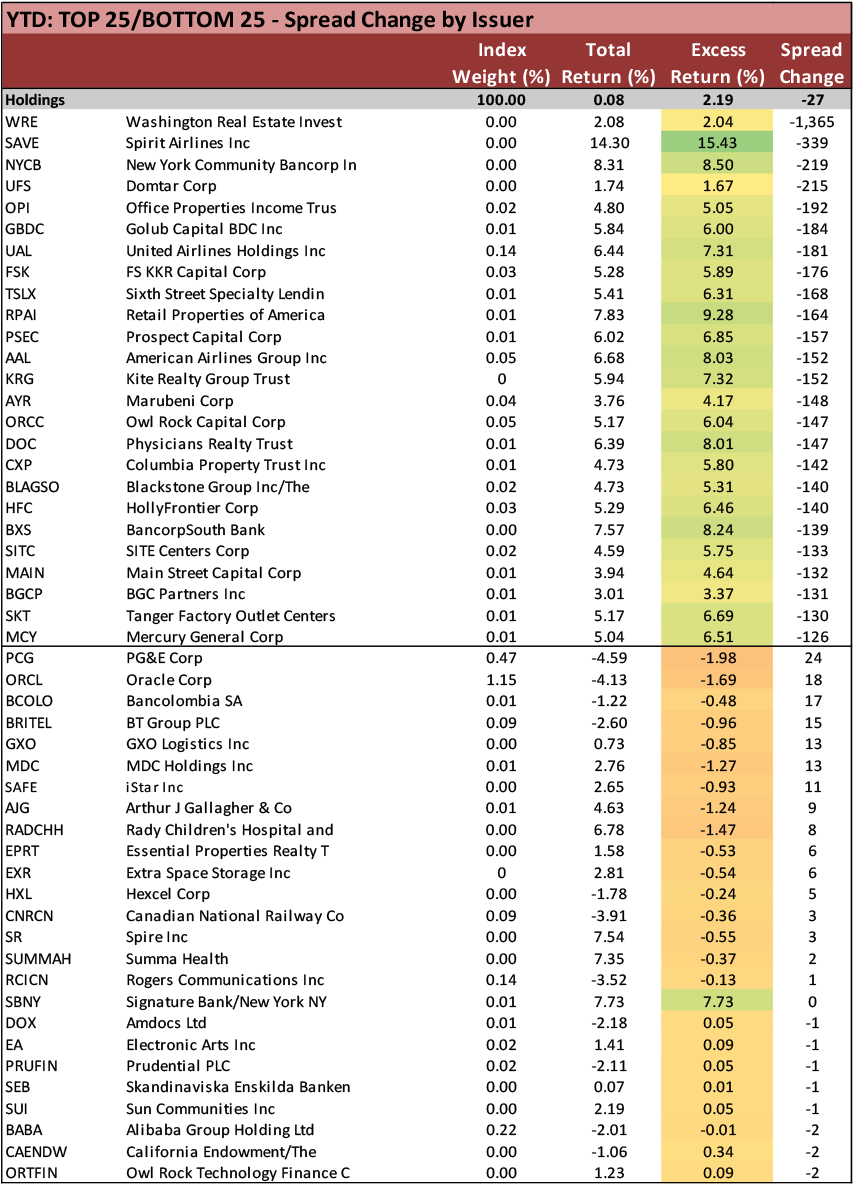
Source: Bloomberg Barclays US Corp Index
This material is intended only for institutional investors and does not carry all of the independence and disclosure standards of retail debt research reports. In the preparation of this material, the author may have consulted or otherwise discussed the matters referenced herein with one or more of SCM’s trading desks, any of which may have accumulated or otherwise taken a position, long or short, in any of the financial instruments discussed in or related to this material. Further, SCM may act as a market maker or principal dealer and may have proprietary interests that differ or conflict with the recipient hereof, in connection with any financial instrument discussed in or related to this material.
This message, including any attachments or links contained herein, is subject to important disclaimers, conditions, and disclosures regarding Electronic Communications, which you can find at https://portfolio-strategy.apsec.com/sancap-disclaimers-and-disclosures.
Important Disclaimers
Copyright © 2026 Santander US Capital Markets LLC and its affiliates (“SCM”). All rights reserved. SCM is a member of FINRA and SIPC. This material is intended for limited distribution to institutions only and is not publicly available. Any unauthorized use or disclosure is prohibited.
In making this material available, SCM (i) is not providing any advice to the recipient, including, without limitation, any advice as to investment, legal, accounting, tax and financial matters, (ii) is not acting as an advisor or fiduciary in respect of the recipient, (iii) is not making any predictions or projections and (iv) intends that any recipient to which SCM has provided this material is an “institutional investor” (as defined under applicable law and regulation, including FINRA Rule 4512 and that this material will not be disseminated, in whole or part, to any third party by the recipient.
The author of this material is an economist, desk strategist or trader. In the preparation of this material, the author may have consulted or otherwise discussed the matters referenced herein with one or more of SCM’s trading desks, any of which may have accumulated or otherwise taken a position, long or short, in any of the financial instruments discussed in or related to this material. Further, SCM or any of its affiliates may act as a market maker or principal dealer and may have proprietary interests that differ or conflict with the recipient hereof, in connection with any financial instrument discussed in or related to this material.
This material (i) has been prepared for information purposes only and does not constitute a solicitation or an offer to buy or sell any securities, related investments or other financial instruments, (ii) is neither research, a “research report” as commonly understood under the securities laws and regulations promulgated thereunder nor the product of a research department, (iii) or parts thereof may have been obtained from various sources, the reliability of which has not been verified and cannot be guaranteed by SCM, (iv) should not be reproduced or disclosed to any other person, without SCM’s prior consent and (v) is not intended for distribution in any jurisdiction in which its distribution would be prohibited.
In connection with this material, SCM (i) makes no representation or warranties as to the appropriateness or reliance for use in any transaction or as to the permissibility or legality of any financial instrument in any jurisdiction, (ii) believes the information in this material to be reliable, has not independently verified such information and makes no representation, express or implied, with regard to the accuracy or completeness of such information, (iii) accepts no responsibility or liability as to any reliance placed, or investment decision made, on the basis of such information by the recipient and (iv) does not undertake, and disclaims any duty to undertake, to update or to revise the information contained in this material.
Unless otherwise stated, the views, opinions, forecasts, valuations, or estimates contained in this material are those solely of the author, as of the date of publication of this material, and are subject to change without notice. The recipient of this material should make an independent evaluation of this information and make such other investigations as the recipient considers necessary (including obtaining independent financial advice), before transacting in any financial market or instrument discussed in or related to this material.
Important disclaimers for clients in the EU and UK
This publication has been prepared by Trading Desk Strategists within the Sales and Trading functions of Santander US Capital Markets LLC (“SanCap”), the US registered broker-dealer of Santander Corporate & Investment Banking. This communication is distributed in the EEA by Banco Santander S.A., a credit institution registered in Spain and authorised and regulated by the Bank of Spain and the CNMV. Any EEA recipient of this communication that would like to affect any transaction in any security or issuer discussed herein should do so with Banco Santander S.A. or any of its affiliates (together “Santander”). This communication has been distributed in the UK by Banco Santander, S.A.’s London branch, authorised by the Bank of Spain and subject to regulatory oversight on certain matters by the Financial Conduct Authority (FCA) and the Prudential Regulation Authority (PRA).
The publication is intended for exclusive use for Professional Clients and Eligible Counterparties as defined by MiFID II and is not intended for use by retail customers or for any persons or entities in any jurisdictions or country where such distribution or use would be contrary to local law or regulation.
This material is not a product of Santander´s Research Team and does not constitute independent investment research. This is a marketing communication and may contain ¨investment recommendations¨ as defined by the Market Abuse Regulation 596/2014 ("MAR"). This publication has not been prepared in accordance with legal requirements designed to promote the independence of research and is not subject to any prohibition on dealing ahead of the dissemination of investment research. The author, date and time of the production of this publication are as indicated herein.
This publication does not constitute investment advice and may not be relied upon to form an investment decision, nor should it be construed as any offer to sell or issue or invitation to purchase, acquire or subscribe for any instruments referred herein. The publication has been prepared in good faith and based on information Santander considers reliable as of the date of publication, but Santander does not guarantee or represent, express or implied, that such information is accurate or complete. All estimates, forecasts and opinions are current as at the date of this publication and are subject to change without notice. Unless otherwise indicated, Santander does not intend to update this publication. The views and commentary in this publication may not be objective or independent of the interests of the Trading and Sales functions of Santander, who may be active participants in the markets, investments or strategies referred to herein and/or may receive compensation from investment banking and non-investment banking services from entities mentioned herein. Santander may trade as principal, make a market or hold positions in instruments (or related derivatives) and/or hold financial interest in entities discussed herein. Santander may provide market commentary or trading strategies to other clients or engage in transactions which may differ from views expressed herein. Santander may have acted upon the contents of this publication prior to you having received it.
This publication is intended for the exclusive use of the recipient and must not be reproduced, redistributed or transmitted, in whole or in part, without Santander’s consent. The recipient agrees to keep confidential at all times information contained herein.


