The Big Idea
The real real in rates
This material is a Marketing Communication and does not constitute Independent Investment Research.
The US rates market continues to defy expectations at least for readers of the drumbeat of headlines about inflation. Inflation is throwing its biggest party in more than a decade, and there is a robust debate about how long it will last. It seems difficult then to understand how the 10-year note within the last week could trade briefly below 1.13%. But the market has priced more to liquidity than inflation since rates peaked this year in April. To turn the trend to lower rates around, the market has to believe the Fed will start slowing and eventually reverse the flow of liquidity or that growth beyond 2023 will soak it up or both.
From the peak of 10-year rates at the end of March to their levels this week, almost all the movement has come not from repricing of inflation but from repricing of real rates (Exhibit 1). The 10-year rate has dropped more than 45 bp since March, but only 4 bp came from a shift down in implied inflation. The rest came from a repricing of real rates more than 41 bp lower. In the rate volatility of the last week, most of the action again came not in breakeven rates but in real rates.
Exhibit 1: Almost all the drop in 10-year rates since March has been in real rates
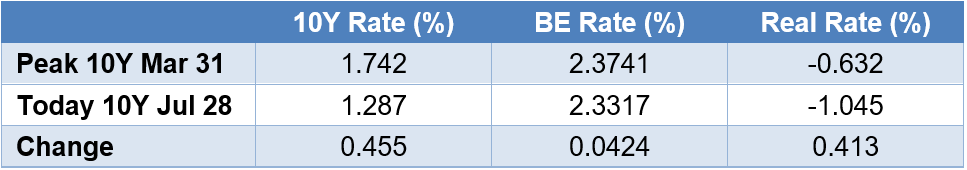
Source: Bloomberg, Amherst Pierpont Securities
Real rates reflect market expectations about the clearing price for money—the rate where the offered supply of funding clears against the demand to borrow. Real rates today, at negative 107 bp, are near their lowest level since at least the 1990s (Exhibit 2). It is worth noting the 10-year real rate last approached current levels in the spring of 2013, shortly before the Fed signaled it eventually would taper QE and consequently triggered the taper tantrum. Arguably in 2013, the market believed a steady flow of Fed liquidity and weak prospects for growth would leave the market awash in cash and real rates low for a decade.
Exhibit 2: US 10-year real rates have neared record lows
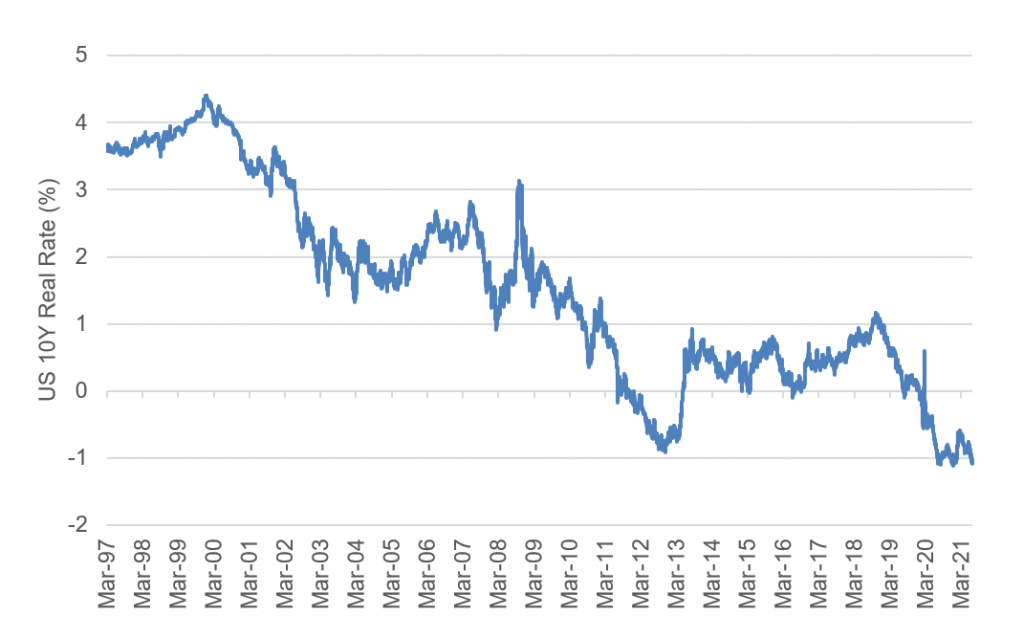
Source: Bloomberg, Amherst Pierpont Securities
It may not be déjà vu all over again, but investors have grounds to expect that the supply of funds will outstrip demand to borrow. In particular:
- Massive liquidity. The Fed and global central banks have poured liquidity into the financial system on a completely new scale during Covid and arguably conditioned the system to expect high levels of liquidity in the future. Bank regulators also seem inclined to support a system with high levels of reserves, and that was true even before Covid following the September 2019 stresses in repo markets. It will likely take years to draw down reserves. Preferences for higher bank reserves come on top of the case made by former Fed Chair Bernanke for a global savings glut, with central banks outside the US holding high balances of currency reserves. The glut may have moderated, but it has not gone away. Consumers have saved more in the last year, but it is too early to make the case that will persist.
- Potential low growth and low investment demand. It is hard to separate expected growth from investment demand; growth can draw out investment demand and investment demand can drive growth. But we have seen both run below historic averages leading up to Covid. US labor force growth has been low and slipped further during Covid, and productivity has run low, too. Over the next few years, productivity growth may even run below the roughly 1% average of the last decade as many low-productivity jobs in retail and travel return. Labor force and productivity are the gears of GDP, and both have turned slowly. Levels of capital investment have generally dropped. We may see a rebound in capital investment as economies reopen, but it is unclear investment will go beyond niches left open by Covid.
For rates to go higher, the market will have to expect Fed liquidity to moderate or reverse, growth to drive up demand to borrow or both. That will require some artful policy. The Fed can begin to taper and eventually raise rates, but it has to do that in a way that sustains expectations of sufficient growth afterwards. That will likely take some persuading. The Fed in several episodes has raised rates to the point of tipping the economy into recession. The rates market has a long memory.
In the meantime, it remains a heavy lift for rates to rise back to their peaks of earlier this year until the Fed shows its hand on the timing and pace of tapering. Investors that need yield will have to keep using the levers available: taking prepayment or call risk, taking credit risk, taking liquidity risk or taking some combination of all of the above.
* * *
The view in rates
Fed RRP balances closed Friday above $877 billion. And with the Treasury General Account at the Fed still holding $225 billion more in funds than the Treasury’s $450 billion target at the end of June, more cash will likely flow into the money markets and end up posted to the RRP.
Settings on 3-month LIBOR closed the week at 12.5 bp, still within basis points of the lowest setting ever. There is only minimal credit premium in the front end of the market. Fed tapering should keep cash pouring into the front end into the second half of 2022, so money market rates look likely to remain low into 2022, as well.
The 10-year note has finished the most recent session at 1.28%, down 1 bp on the week after dipping as low as 1.13% during the week. Breakeven 10-year inflation is at 235 bp, up on the week by 1 bp. The 10-year real rate finished the week at negative 107 bp, down 2 bp on the week. As noted earlier, real rates are driving the market.
The Treasury yield curve has finished its most recent session with 2s10s at 108 bp, 1 bp steeper than a week ago. The 5s30s curve has finished at 120 bp, steeper by 5 bp.
The view in spreads
Bearish on MBS, more bullish on corporate and structured credit. The prospect of Fed tapering and heavy net supply should keep weighing on MBS spreads until the Fed shows its hand and the market can price the impact. The market has already priced additional risk of soft demand and steady supply, with the nominal spread of par 30-year MBS to the 7.5-year Treasury at 73 bp, wider from the end of May by 11 bp. Spreads look vulnerable to going still wider as the Fed likely leans into tapering or tapering-and-hiking faster than its 2013-to-2015 cycle.
In credit, benchmark investment grade cash spreads have widened only 2 bp from the end of May and should continue to outperform MBS. Demand from mutual funds, international portfolios and insurers looks healthy. Low rates should continue supporting corporate balance sheet strength. Ratios of EBITDA to interest expense are in the middle of the range despite high ratios of debt to EBITDA. Investor demand for yield should keep spreads relatively tight. A strong economy should help credit spreads, but relative value flows at money managers could still soften credit spreads if MBS gets wide enough.
The view in credit
Fundamental credit generally looks good, helped by Covid reopening and low rates. Consumers finished the first quarter of 2021 with net worth up $5 trillion. Aggregate savings jumped again as did home values and investment portfolios. Consumers have not added much debt. Corporate balance sheets have taken on more leverage, although mitigated by strong cash balances and low interest costs. EBITDA-to-interest-expense is at healthy levels. Strong economic growth in 2021 and 2022 should lift most EBITDA and continue easing credit concerns. Eventually, rising interest expense in 2023 should compete with EBITDA growth. Fundamental credit should hinge on whether the Fed can orchestrate a soft landing as it starts to tighten financial conditions.
This material is intended only for institutional investors and does not carry all of the independence and disclosure standards of retail debt research reports. In the preparation of this material, the author may have consulted or otherwise discussed the matters referenced herein with one or more of SCM’s trading desks, any of which may have accumulated or otherwise taken a position, long or short, in any of the financial instruments discussed in or related to this material. Further, SCM may act as a market maker or principal dealer and may have proprietary interests that differ or conflict with the recipient hereof, in connection with any financial instrument discussed in or related to this material.
This message, including any attachments or links contained herein, is subject to important disclaimers, conditions, and disclosures regarding Electronic Communications, which you can find at https://portfolio-strategy.apsec.com/sancap-disclaimers-and-disclosures.
Important Disclaimers
Copyright © 2026 Santander US Capital Markets LLC and its affiliates (“SCM”). All rights reserved. SCM is a member of FINRA and SIPC. This material is intended for limited distribution to institutions only and is not publicly available. Any unauthorized use or disclosure is prohibited.
In making this material available, SCM (i) is not providing any advice to the recipient, including, without limitation, any advice as to investment, legal, accounting, tax and financial matters, (ii) is not acting as an advisor or fiduciary in respect of the recipient, (iii) is not making any predictions or projections and (iv) intends that any recipient to which SCM has provided this material is an “institutional investor” (as defined under applicable law and regulation, including FINRA Rule 4512 and that this material will not be disseminated, in whole or part, to any third party by the recipient.
The author of this material is an economist, desk strategist or trader. In the preparation of this material, the author may have consulted or otherwise discussed the matters referenced herein with one or more of SCM’s trading desks, any of which may have accumulated or otherwise taken a position, long or short, in any of the financial instruments discussed in or related to this material. Further, SCM or any of its affiliates may act as a market maker or principal dealer and may have proprietary interests that differ or conflict with the recipient hereof, in connection with any financial instrument discussed in or related to this material.
This material (i) has been prepared for information purposes only and does not constitute a solicitation or an offer to buy or sell any securities, related investments or other financial instruments, (ii) is neither research, a “research report” as commonly understood under the securities laws and regulations promulgated thereunder nor the product of a research department, (iii) or parts thereof may have been obtained from various sources, the reliability of which has not been verified and cannot be guaranteed by SCM, (iv) should not be reproduced or disclosed to any other person, without SCM’s prior consent and (v) is not intended for distribution in any jurisdiction in which its distribution would be prohibited.
In connection with this material, SCM (i) makes no representation or warranties as to the appropriateness or reliance for use in any transaction or as to the permissibility or legality of any financial instrument in any jurisdiction, (ii) believes the information in this material to be reliable, has not independently verified such information and makes no representation, express or implied, with regard to the accuracy or completeness of such information, (iii) accepts no responsibility or liability as to any reliance placed, or investment decision made, on the basis of such information by the recipient and (iv) does not undertake, and disclaims any duty to undertake, to update or to revise the information contained in this material.
Unless otherwise stated, the views, opinions, forecasts, valuations, or estimates contained in this material are those solely of the author, as of the date of publication of this material, and are subject to change without notice. The recipient of this material should make an independent evaluation of this information and make such other investigations as the recipient considers necessary (including obtaining independent financial advice), before transacting in any financial market or instrument discussed in or related to this material.
Important disclaimers for clients in the EU and UK
This publication has been prepared by Trading Desk Strategists within the Sales and Trading functions of Santander US Capital Markets LLC (“SanCap”), the US registered broker-dealer of Santander Corporate & Investment Banking. This communication is distributed in the EEA by Banco Santander S.A., a credit institution registered in Spain and authorised and regulated by the Bank of Spain and the CNMV. Any EEA recipient of this communication that would like to affect any transaction in any security or issuer discussed herein should do so with Banco Santander S.A. or any of its affiliates (together “Santander”). This communication has been distributed in the UK by Banco Santander, S.A.’s London branch, authorised by the Bank of Spain and subject to regulatory oversight on certain matters by the Financial Conduct Authority (FCA) and the Prudential Regulation Authority (PRA).
The publication is intended for exclusive use for Professional Clients and Eligible Counterparties as defined by MiFID II and is not intended for use by retail customers or for any persons or entities in any jurisdictions or country where such distribution or use would be contrary to local law or regulation.
This material is not a product of Santander´s Research Team and does not constitute independent investment research. This is a marketing communication and may contain ¨investment recommendations¨ as defined by the Market Abuse Regulation 596/2014 ("MAR"). This publication has not been prepared in accordance with legal requirements designed to promote the independence of research and is not subject to any prohibition on dealing ahead of the dissemination of investment research. The author, date and time of the production of this publication are as indicated herein.
This publication does not constitute investment advice and may not be relied upon to form an investment decision, nor should it be construed as any offer to sell or issue or invitation to purchase, acquire or subscribe for any instruments referred herein. The publication has been prepared in good faith and based on information Santander considers reliable as of the date of publication, but Santander does not guarantee or represent, express or implied, that such information is accurate or complete. All estimates, forecasts and opinions are current as at the date of this publication and are subject to change without notice. Unless otherwise indicated, Santander does not intend to update this publication. The views and commentary in this publication may not be objective or independent of the interests of the Trading and Sales functions of Santander, who may be active participants in the markets, investments or strategies referred to herein and/or may receive compensation from investment banking and non-investment banking services from entities mentioned herein. Santander may trade as principal, make a market or hold positions in instruments (or related derivatives) and/or hold financial interest in entities discussed herein. Santander may provide market commentary or trading strategies to other clients or engage in transactions which may differ from views expressed herein. Santander may have acted upon the contents of this publication prior to you having received it.
This publication is intended for the exclusive use of the recipient and must not be reproduced, redistributed or transmitted, in whole or in part, without Santander’s consent. The recipient agrees to keep confidential at all times information contained herein.


