By the Numbers
Stacking up servicer behavior across mortgage credit
This material is a Marketing Communication and does not constitute Independent Investment Research.
As borrowers in RMBS trusts rolled into forbearance last year, it became increasingly apparent that treatment of these loans would vary across servicers and across different types of mortgage credit. And now as these forbearance plans have begun to expire, differences in servicer treatment of loans exiting forbearance have started becoming clear as loans roll back to performing or towards foreclosure.
Unlike servicers of Fannie Mae, Freddie Mac and Ginnie Mae loans, servicers of loans in private-label trusts have significantly more latitude in the treatment of loans in forbearance. The duration of forbearance terms, extension of those terms, classification of borrowers in payment forbearance to trustees and advancing policies have diverged significantly across servicers. Some of the key differences across servicers have been whether they have reported a borrower as delinquent while in forbearance or employed capitalization modifications and continued to mark the borrower as current. And even in the case where the borrower is marked as delinquent, there are noticeable differences in the amount of loans where the servicer makes a full advance of principal, interest, taxes and insurance to the trust.
Breaking down the non-QM sector
Looking at recent roll rates broken down by servicer shows that across the June remittance cycle, migration of loans out of late-stage delinquency varied somewhat meaningfully across different servicers of non-QM loans. Some servicers saw a relatively large population of previously seriously delinquent loans roll to back to current while others saw an outsized population of loans begin to roll towards foreclosure. Loans rolling back to current require further examination as those loans may be marked as current as a result of different types of borrower or servicer action. Loans may be marked as current as a result of a borrower self-curing, having their payment capitalized or by receiving a permanent loan modification, all of which will have different implications for future cash flow available to the trust.
An analysis of roll rates on previous seriously delinquent loans across major non-QM servicers shows that servicers like Nationstar and Shellpoint saw meaningful amounts of previously delinquent loans roll back to current while others like Fay and SPS saw relatively outsized amounts of loans roll to foreclosure. Admittedly, looking at a 1-month roll rate creates a small population of observations. However, it may provide valuable insight to how different servicers may treat the larger population of loans still in forbearance (Exhibit 1).
Exhibit 1: Tracking delinquency rolls across non-QM servicers
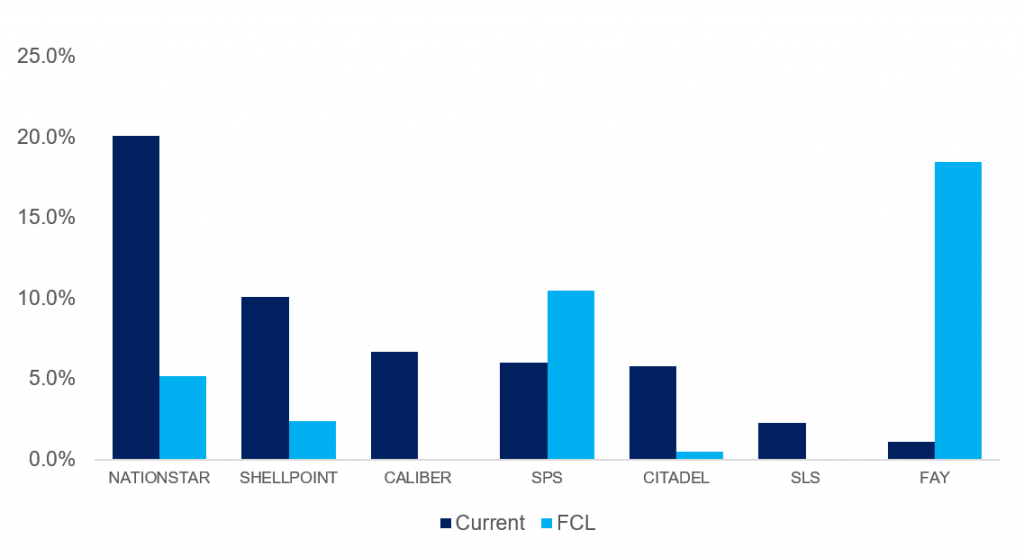
Source: CoreLogic, Intex, Amherst Pierpont Analysis is exclusive to June remittance based on loans that were 90 days or more past due in May remittance cycle
A further analysis of borrower or servicer actions that caused loans to roll back to current pay status shows somewhat meaningful disparities across servicers, Breaking loans into four buckets; self-cure, capitalization modification, rate modification or other modification shows that some servicers had relatively large amounts of loans self-cure while others relied on some type of modification to re-perform borrowers. Nationstar saw the largest percentage of previously delinquent loans roll back to current in June as over 20% of those delinquencies rolled back to current last month. More than half of those loans, or 13% self-cured while an additional 1.5% received a capitalization modification and another 5.5% were reperformed using another form of modification. (Exhibit 2)
Exhibit 2: Breaking down borrower and servicer behavior on delinquency cures
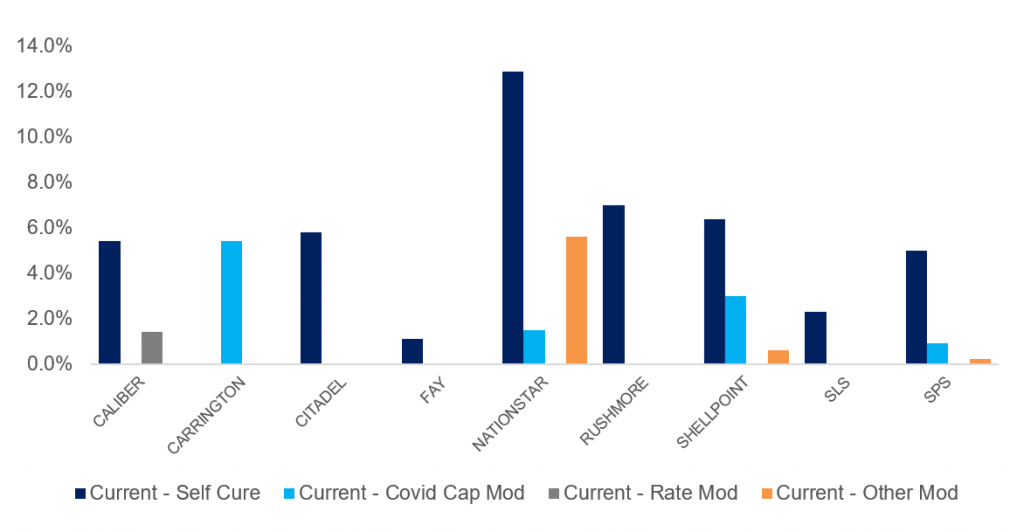
Source: CoreLogic, Intex, Amherst Pierpont Analysis is exclusive to June remittance based on loans that were 90 days or more past due in May remittance cycle
Breaking down the NPL/RPL sector
Applying the same framework to the RPL sector shows that some servicers stood out with regards to the amount of loans that cured or transitioned to foreclosure as well. In terms of servicers that saw outsized amounts of loans cure in the June remittance cycle, Citi, SPS, Ocwen and Shellpoint all saw relatively large percentages of loans roll from seriously delinquent to current last month as loans serviced by Citi experienced a 14% cure rate while loans serviced by SPS, Ocwen and Shellpoint saw cure rates between 8% and 9%. Conversely, Fay Loan Servicing and PHH saw relatively large amounts of loans roll to foreclosure. (Exhibit 3)
Exhibit 3: Stacking up cure and foreclosure rolls across RPLs
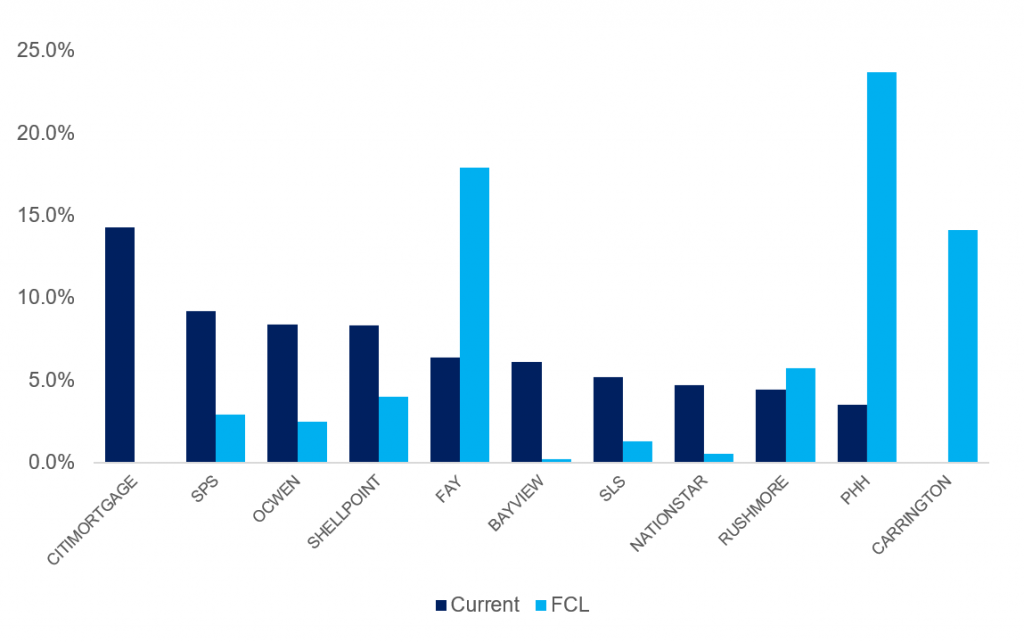
Source: CoreLogic, Intex, Amherst Pierpont Analysis is exclusive to June remittance based on loans that were 90 days or more past due in May remittance cycle
Digging in on what’s driving cure rates across the RPL sector shows that like the non-QM sector, the servicer with the largest amounts of loans curing was fueled in no small part by self-cure borrowers as more than half of re-performing loans serviced by Citi were self-cure borrowers. Looking across the gamut of servicers that saw relatively large amounts of loans cure last month, cure rates across Shellpoint serviced loans were a result of equal parts self-cures and capitalization modifications, while SPS relied primarily on capitalization modifications to re-perform borrowers and Ocwen primarily employed other forms of modifications. (Exhibit 4)
Exhibit 4: Digging in on drivers of cure rates in RPLs
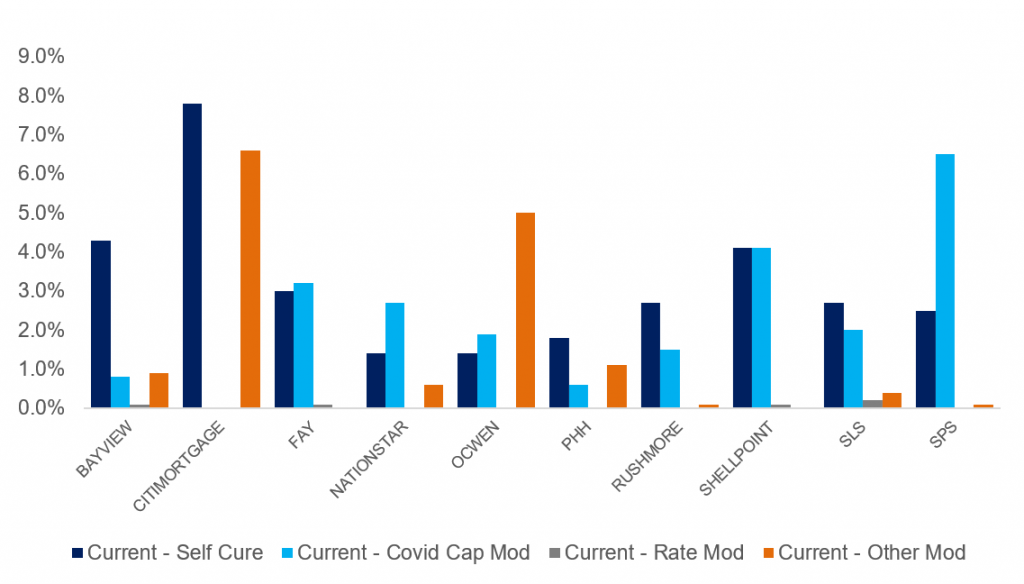
Source: CoreLogic, Intex, Amherst Pierpont Analysis is exclusive to June remittance based on loans that were 90 days or more past due in May remittance cycle
Breaking down prime 2.0
Nominal delinquency rates in prime 2.0 are substantially lower than those exhibited in other cohorts, and as a result borrower and servicer behavior is likely particularly relevant to investors in thinner, more structurally levered subordinate cash flows where transition rates and the drivers of those rates may have outsized impact on those bonds. Given the relatively pristine nature of prime borrowers, cure rates across servicers were by and large much higher than those witnessed in the non-QM and RPL cohorts. Additionally, rolls to foreclosure from late-stage delinquency were almost non-existent in prime collateral last month irrespective of servicer. (Exhibit 5)
Exhibit 5: Prime 2.0 collateral exhibited elevated cure rates in June
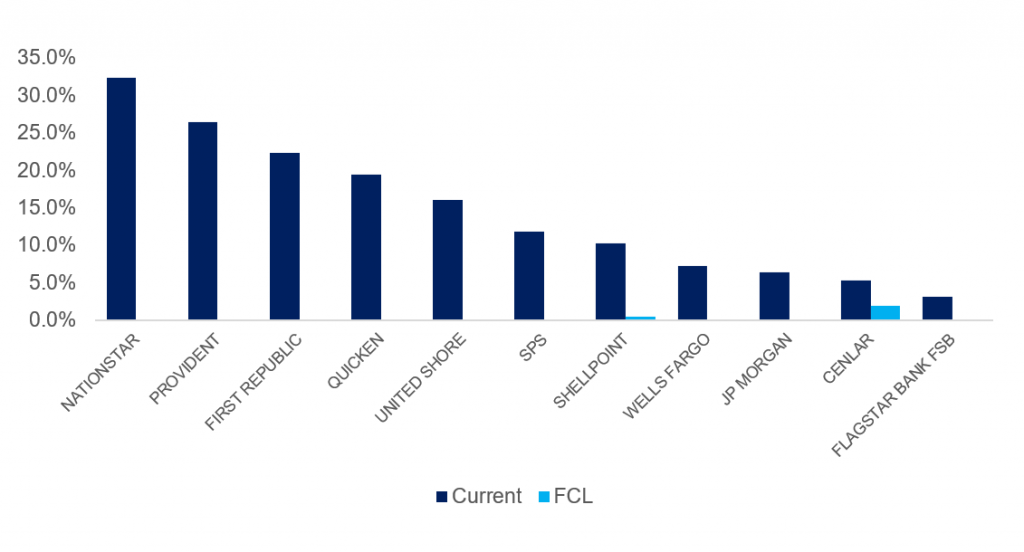
Source: CoreLogic, Intex, Amherst Pierpont Analysis is exclusive to June remittance based on loans that were 90 days or more past due in May remittance cycle
Of servicers that saw the largest amounts of loans transition from seriously delinquent to current, those transitions were almost exclusively driven by borrowers exiting forbearance and re-performing without a modification. Prime servicers like Nationstar, Provident, First Republic and Quicken all saw 100% of re-performing borrowers self-cure last month. Other servicers like Cenlar and SPS relied on roughly an even split of self-cures and capitalization modifications to return borrowers to current while United Shore relied solely on alternative forms of modification to get borrowers back to current status (Exhibit 6)
Exhibit 6: Self-cures drive re-performance in prime 2.0
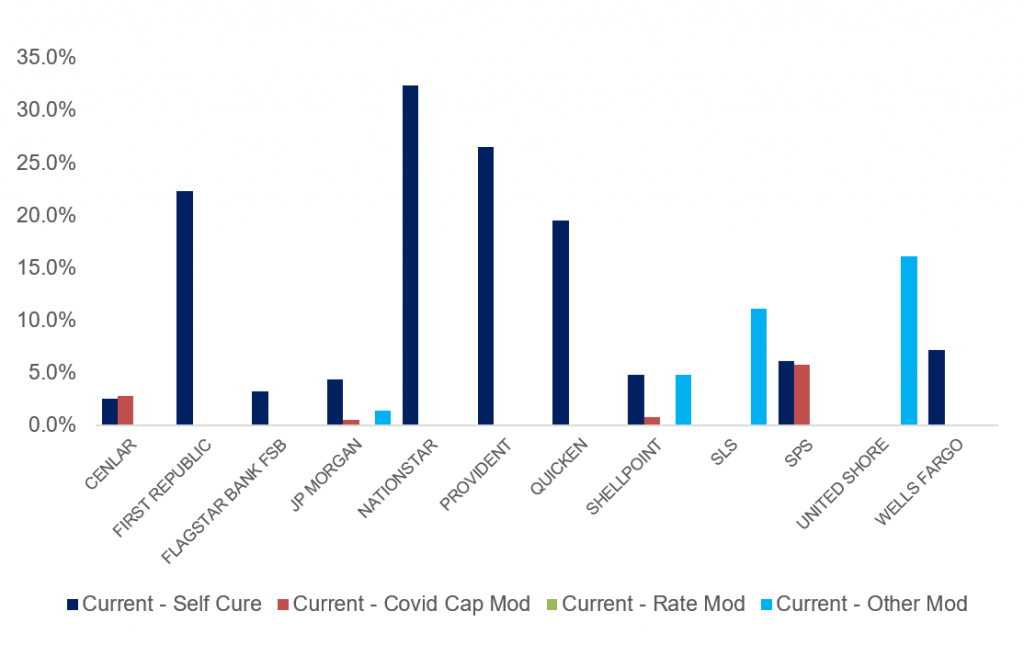
Source: CoreLogic, Intex, Amherst Pierpont Analysis is exclusive to June remittance based on loans that were 90 days or more past due in May remittance cycle
This material is intended only for institutional investors and does not carry all of the independence and disclosure standards of retail debt research reports. In the preparation of this material, the author may have consulted or otherwise discussed the matters referenced herein with one or more of SCM’s trading desks, any of which may have accumulated or otherwise taken a position, long or short, in any of the financial instruments discussed in or related to this material. Further, SCM may act as a market maker or principal dealer and may have proprietary interests that differ or conflict with the recipient hereof, in connection with any financial instrument discussed in or related to this material.
This message, including any attachments or links contained herein, is subject to important disclaimers, conditions, and disclosures regarding Electronic Communications, which you can find at https://portfolio-strategy.apsec.com/sancap-disclaimers-and-disclosures.
Important Disclaimers
Copyright © 2026 Santander US Capital Markets LLC and its affiliates (“SCM”). All rights reserved. SCM is a member of FINRA and SIPC. This material is intended for limited distribution to institutions only and is not publicly available. Any unauthorized use or disclosure is prohibited.
In making this material available, SCM (i) is not providing any advice to the recipient, including, without limitation, any advice as to investment, legal, accounting, tax and financial matters, (ii) is not acting as an advisor or fiduciary in respect of the recipient, (iii) is not making any predictions or projections and (iv) intends that any recipient to which SCM has provided this material is an “institutional investor” (as defined under applicable law and regulation, including FINRA Rule 4512 and that this material will not be disseminated, in whole or part, to any third party by the recipient.
The author of this material is an economist, desk strategist or trader. In the preparation of this material, the author may have consulted or otherwise discussed the matters referenced herein with one or more of SCM’s trading desks, any of which may have accumulated or otherwise taken a position, long or short, in any of the financial instruments discussed in or related to this material. Further, SCM or any of its affiliates may act as a market maker or principal dealer and may have proprietary interests that differ or conflict with the recipient hereof, in connection with any financial instrument discussed in or related to this material.
This material (i) has been prepared for information purposes only and does not constitute a solicitation or an offer to buy or sell any securities, related investments or other financial instruments, (ii) is neither research, a “research report” as commonly understood under the securities laws and regulations promulgated thereunder nor the product of a research department, (iii) or parts thereof may have been obtained from various sources, the reliability of which has not been verified and cannot be guaranteed by SCM, (iv) should not be reproduced or disclosed to any other person, without SCM’s prior consent and (v) is not intended for distribution in any jurisdiction in which its distribution would be prohibited.
In connection with this material, SCM (i) makes no representation or warranties as to the appropriateness or reliance for use in any transaction or as to the permissibility or legality of any financial instrument in any jurisdiction, (ii) believes the information in this material to be reliable, has not independently verified such information and makes no representation, express or implied, with regard to the accuracy or completeness of such information, (iii) accepts no responsibility or liability as to any reliance placed, or investment decision made, on the basis of such information by the recipient and (iv) does not undertake, and disclaims any duty to undertake, to update or to revise the information contained in this material.
Unless otherwise stated, the views, opinions, forecasts, valuations, or estimates contained in this material are those solely of the author, as of the date of publication of this material, and are subject to change without notice. The recipient of this material should make an independent evaluation of this information and make such other investigations as the recipient considers necessary (including obtaining independent financial advice), before transacting in any financial market or instrument discussed in or related to this material.
Important disclaimers for clients in the EU and UK
This publication has been prepared by Trading Desk Strategists within the Sales and Trading functions of Santander US Capital Markets LLC (“SanCap”), the US registered broker-dealer of Santander Corporate & Investment Banking. This communication is distributed in the EEA by Banco Santander S.A., a credit institution registered in Spain and authorised and regulated by the Bank of Spain and the CNMV. Any EEA recipient of this communication that would like to affect any transaction in any security or issuer discussed herein should do so with Banco Santander S.A. or any of its affiliates (together “Santander”). This communication has been distributed in the UK by Banco Santander, S.A.’s London branch, authorised by the Bank of Spain and subject to regulatory oversight on certain matters by the Financial Conduct Authority (FCA) and the Prudential Regulation Authority (PRA).
The publication is intended for exclusive use for Professional Clients and Eligible Counterparties as defined by MiFID II and is not intended for use by retail customers or for any persons or entities in any jurisdictions or country where such distribution or use would be contrary to local law or regulation.
This material is not a product of Santander´s Research Team and does not constitute independent investment research. This is a marketing communication and may contain ¨investment recommendations¨ as defined by the Market Abuse Regulation 596/2014 ("MAR"). This publication has not been prepared in accordance with legal requirements designed to promote the independence of research and is not subject to any prohibition on dealing ahead of the dissemination of investment research. The author, date and time of the production of this publication are as indicated herein.
This publication does not constitute investment advice and may not be relied upon to form an investment decision, nor should it be construed as any offer to sell or issue or invitation to purchase, acquire or subscribe for any instruments referred herein. The publication has been prepared in good faith and based on information Santander considers reliable as of the date of publication, but Santander does not guarantee or represent, express or implied, that such information is accurate or complete. All estimates, forecasts and opinions are current as at the date of this publication and are subject to change without notice. Unless otherwise indicated, Santander does not intend to update this publication. The views and commentary in this publication may not be objective or independent of the interests of the Trading and Sales functions of Santander, who may be active participants in the markets, investments or strategies referred to herein and/or may receive compensation from investment banking and non-investment banking services from entities mentioned herein. Santander may trade as principal, make a market or hold positions in instruments (or related derivatives) and/or hold financial interest in entities discussed herein. Santander may provide market commentary or trading strategies to other clients or engage in transactions which may differ from views expressed herein. Santander may have acted upon the contents of this publication prior to you having received it.
This publication is intended for the exclusive use of the recipient and must not be reproduced, redistributed or transmitted, in whole or in part, without Santander’s consent. The recipient agrees to keep confidential at all times information contained herein.


