By the Numbers
Balancing return and risk in last-cash-flow conduit CMBS
This material is a Marketing Communication and does not constitute Independent Investment Research.
The front last cash flow of a conduit CMBS deal typically prices at new issue two basis points tighter than the last cash flow due to its slightly shorter weighted average life. In many 2017 to 2019 vintage deals, where those bonds are now trading at high premiums, the front last cash flow now is trading 10 bp to 12 bp wide of the last cash flow. Investors can capture additional yield in the front last cash flow and may benefit from tightening as credit issues resolve, but investors need to pay attention to the potential impact of prepayments and defaults.
An example of the spread reversal between the front LCF and LCF security is in the BMARK 2019-B9 deal (Exhibit 1). The A4 is trading at a spread of 75 bp with a projected yield to maturity of 1.84%, while the A5 has a spread 10 bp tighter at 65 bp with a projected yield of 1.75%, both assuming 0 CPY and 0 CDR.
Exhibit 1: Comparison of Front LCF and LCF for BMARK 2019-B9
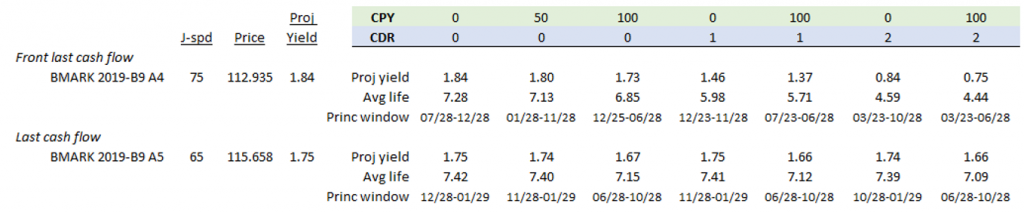
Note: Levels shown are indicative only. Data as of 7/15/2021.
Source: Bloomberg, Amherst Pierpont Securities
The principal window for the A4 is 7/28–12/28, and the A5 is 12/28-1/28 resulting in very comparable average lives of 7.3 and 7.4 years, respectively. At 100 CPY, however, the principal widow of the A4 widens to 12/25-6/28 and the average life shortens to 6.9 years, with a resultant drop in projected yield of 11 bp from 1.84% to 1.73%. The A5 also shortens to 7.2 years and drops 8 bp of yield. Notably in the 50 CPY scenario the average life and projected yield of the A5 is nearly unchanged while the A4 does realize about half of its performance degradation at 50 CPY.
The reason for the difference in potential underperformance is that there are several loans in the deal–including the largest loan representing 10% of the trust balance–that have open periods of seven months. At super premium dollar prices, the loss of those extra months of interest cash flow is enough to cause a deterioration in performance, more so for the front LCF A4 than the A5 whose principal window is narrower.
There are a variety of credit concerns in the deal. Currently two loans of 50, totaling 1.9% of the trust balance, are in special servicing, two are delinquent including the largest loan (10.74%) which is a New York City office property, another 14 are on the watchlist (30.6%) and one is in grace period (3.9%). For illustrative purposes, the credit scenarios in Exhibit 1 assume a default rate of either 1 or 2 CDR per year, and a loss severity of 30%. Neither of these classes has a principal loss, but the at 1 CDR the cumulative loss to the collateral is 2% and at 2 CDR there is 4% loss. The front LCF A4 underperforms by 38 bp to 45 bp at a default rate of 1 CDR depending on the prepayment speed, while the LCF A5 is stable at 1 CDR and experiences virtually the same 9 bp drop in performance if prepay speeds accelerate to 100 CPY. The LCF A4 is also mostly stable in the 2 CDR scenario, while the A5 could experience significant underperformance, with the projected yield dropping to 0.84% or 0.75% as the average life of the bond shortened to roughly 4.5 years.
Exhibit 2: Comparison of Front LCF and LCF for BMARK 2018-B8
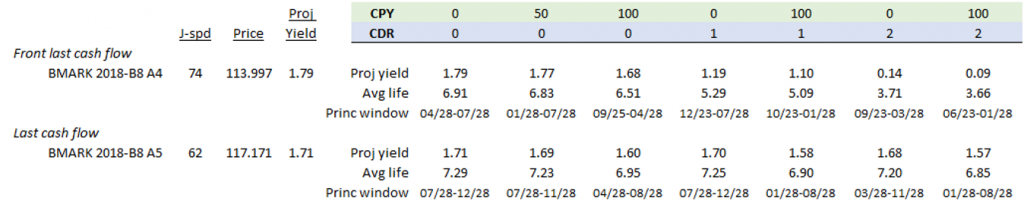
Note: Levels shown are indicative only. Data as of 7/15/2021.
Source: Bloomberg, Amherst Pierpont Securities
This is not to suggest that buying the front LCF isn’t a good relative value play, but only that investors need to carefully examine the collateral from a prepay and credit perspective. Exhibit 2 shows the same comparison for the A4 and A5 in the BMARK 2018-B8 deal. The projected underperformance of the A4 in this deal is about the same at 100 CPY – a loss of 11 bp of yield – but potentially much more severe in default scenarios of 1 CDR or 2 CDR where the yield falls by up to 69 bp and 170 bp, respectively. This is also exacerbated by the higher dollar price of the securities. However, the collateral in this deal is much cleaner. Only one loan of 41 is in special servicing (5.4%) and 11 are on the watchlist (25%). Even at the higher dollar price, the overall risk of a credit event at this point is much lower, and the underperformance at 100 CPY is relatively modest.
Investors can pick up 10 bp to 12 bp of additional spread in front LCF securities, and as those securities roll down the curve and if credit conditions of the underlying loans improve, they could potentially tighten and significantly outperform the LCF.
This material is intended only for institutional investors and does not carry all of the independence and disclosure standards of retail debt research reports. In the preparation of this material, the author may have consulted or otherwise discussed the matters referenced herein with one or more of SCM’s trading desks, any of which may have accumulated or otherwise taken a position, long or short, in any of the financial instruments discussed in or related to this material. Further, SCM may act as a market maker or principal dealer and may have proprietary interests that differ or conflict with the recipient hereof, in connection with any financial instrument discussed in or related to this material.
This message, including any attachments or links contained herein, is subject to important disclaimers, conditions, and disclosures regarding Electronic Communications, which you can find at https://portfolio-strategy.apsec.com/sancap-disclaimers-and-disclosures.
Important Disclaimers
Copyright © 2026 Santander US Capital Markets LLC and its affiliates (“SCM”). All rights reserved. SCM is a member of FINRA and SIPC. This material is intended for limited distribution to institutions only and is not publicly available. Any unauthorized use or disclosure is prohibited.
In making this material available, SCM (i) is not providing any advice to the recipient, including, without limitation, any advice as to investment, legal, accounting, tax and financial matters, (ii) is not acting as an advisor or fiduciary in respect of the recipient, (iii) is not making any predictions or projections and (iv) intends that any recipient to which SCM has provided this material is an “institutional investor” (as defined under applicable law and regulation, including FINRA Rule 4512 and that this material will not be disseminated, in whole or part, to any third party by the recipient.
The author of this material is an economist, desk strategist or trader. In the preparation of this material, the author may have consulted or otherwise discussed the matters referenced herein with one or more of SCM’s trading desks, any of which may have accumulated or otherwise taken a position, long or short, in any of the financial instruments discussed in or related to this material. Further, SCM or any of its affiliates may act as a market maker or principal dealer and may have proprietary interests that differ or conflict with the recipient hereof, in connection with any financial instrument discussed in or related to this material.
This material (i) has been prepared for information purposes only and does not constitute a solicitation or an offer to buy or sell any securities, related investments or other financial instruments, (ii) is neither research, a “research report” as commonly understood under the securities laws and regulations promulgated thereunder nor the product of a research department, (iii) or parts thereof may have been obtained from various sources, the reliability of which has not been verified and cannot be guaranteed by SCM, (iv) should not be reproduced or disclosed to any other person, without SCM’s prior consent and (v) is not intended for distribution in any jurisdiction in which its distribution would be prohibited.
In connection with this material, SCM (i) makes no representation or warranties as to the appropriateness or reliance for use in any transaction or as to the permissibility or legality of any financial instrument in any jurisdiction, (ii) believes the information in this material to be reliable, has not independently verified such information and makes no representation, express or implied, with regard to the accuracy or completeness of such information, (iii) accepts no responsibility or liability as to any reliance placed, or investment decision made, on the basis of such information by the recipient and (iv) does not undertake, and disclaims any duty to undertake, to update or to revise the information contained in this material.
Unless otherwise stated, the views, opinions, forecasts, valuations, or estimates contained in this material are those solely of the author, as of the date of publication of this material, and are subject to change without notice. The recipient of this material should make an independent evaluation of this information and make such other investigations as the recipient considers necessary (including obtaining independent financial advice), before transacting in any financial market or instrument discussed in or related to this material.
Important disclaimers for clients in the EU and UK
This publication has been prepared by Trading Desk Strategists within the Sales and Trading functions of Santander US Capital Markets LLC (“SanCap”), the US registered broker-dealer of Santander Corporate & Investment Banking. This communication is distributed in the EEA by Banco Santander S.A., a credit institution registered in Spain and authorised and regulated by the Bank of Spain and the CNMV. Any EEA recipient of this communication that would like to affect any transaction in any security or issuer discussed herein should do so with Banco Santander S.A. or any of its affiliates (together “Santander”). This communication has been distributed in the UK by Banco Santander, S.A.’s London branch, authorised by the Bank of Spain and subject to regulatory oversight on certain matters by the Financial Conduct Authority (FCA) and the Prudential Regulation Authority (PRA).
The publication is intended for exclusive use for Professional Clients and Eligible Counterparties as defined by MiFID II and is not intended for use by retail customers or for any persons or entities in any jurisdictions or country where such distribution or use would be contrary to local law or regulation.
This material is not a product of Santander´s Research Team and does not constitute independent investment research. This is a marketing communication and may contain ¨investment recommendations¨ as defined by the Market Abuse Regulation 596/2014 ("MAR"). This publication has not been prepared in accordance with legal requirements designed to promote the independence of research and is not subject to any prohibition on dealing ahead of the dissemination of investment research. The author, date and time of the production of this publication are as indicated herein.
This publication does not constitute investment advice and may not be relied upon to form an investment decision, nor should it be construed as any offer to sell or issue or invitation to purchase, acquire or subscribe for any instruments referred herein. The publication has been prepared in good faith and based on information Santander considers reliable as of the date of publication, but Santander does not guarantee or represent, express or implied, that such information is accurate or complete. All estimates, forecasts and opinions are current as at the date of this publication and are subject to change without notice. Unless otherwise indicated, Santander does not intend to update this publication. The views and commentary in this publication may not be objective or independent of the interests of the Trading and Sales functions of Santander, who may be active participants in the markets, investments or strategies referred to herein and/or may receive compensation from investment banking and non-investment banking services from entities mentioned herein. Santander may trade as principal, make a market or hold positions in instruments (or related derivatives) and/or hold financial interest in entities discussed herein. Santander may provide market commentary or trading strategies to other clients or engage in transactions which may differ from views expressed herein. Santander may have acted upon the contents of this publication prior to you having received it.
This publication is intended for the exclusive use of the recipient and must not be reproduced, redistributed or transmitted, in whole or in part, without Santander’s consent. The recipient agrees to keep confidential at all times information contained herein.


