The Big Idea
A path to relative value rebalancing
This material is a Marketing Communication and does not constitute Independent Investment Research.
When the Fed finally begins tapering and banks pull back a bit from the securities markets, relative value investors will have a chance to play a bigger role in shaping debt markets. Actively managed mutual funds have more than $5.6 trillion in debt securities today and a steady flow of new money. If history is any guide, these funds will start allocating away from credit and towards Treasury debt and MBS as tapering ends. There are very early signs that some of that relative value reallocation has already begun.
Mutual funds have played off Fed QE since inception of the policy in late 2008. As the Fed began buying Treasury debt and agency MBS to cushion the financial crisis, mutual funds began selling those assets and reinvesting in credit—both corporate and structured. Mutual funds went from underweight Treasury debt 8.2% as QE began in early 2009 to underweight 19.1% when the last round of QE ended in late 2014—a 10.9% drop again index weighting (Exhibit 1). In agency debt and MBS over that period, mutual funds went from overweight 8.0% to underweight by 2.4%—a 10.4% drop. Corporate and structured credit, meanwhile, when from underweight 0.6% at the start to overweight 16% at the finish–a 16.6% gain.
Exhibit 1: Mutual fund allocations partly reflect shifts in Fed QE
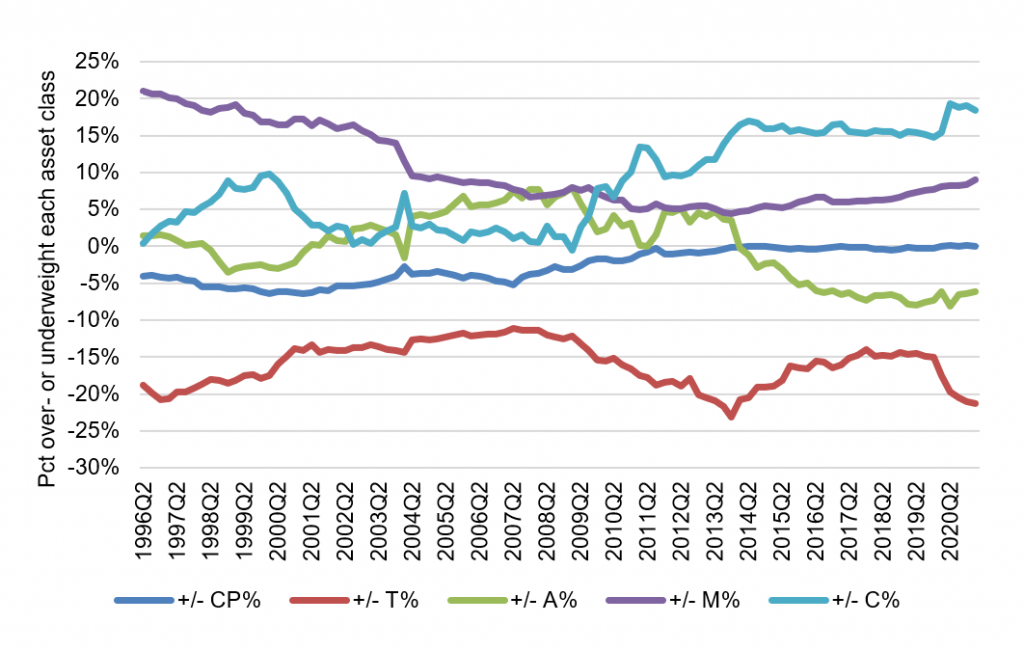
Note: CP=commercial paper, T=Treasury debt, A=agency debt and MBS, M=muni debt and C=corporate and structured credit. Mutual fund debt security allocations calculated from Financial Accounts of the United States L.122, index debt security allocations calculated from L.208, and overweight or underweight positions calculated as the difference.
Source: Federal Reserve, Amherst Pierpont Securities.
After the Fed finished tapering in late 2014, mutual fund allocation to corporate and structured credit plateaued for five years at around 15% overweight. Agency debt and MBS exposure continued to slide, but mutual funds bought back some of their short position in Treasury debt. The reach for Treasury debt likely reflected stress in the corporate market from a collapse in energy prices that started in mid-2014 and only partially recovered afterwards. If material parts of the corporate book were becoming more illiquid, increased allocation to Treasuries balanced that. The stress in energy also added new uncertainty to the Fed path, another reason mutual funds may have reached for Treasury liquidity.
The Covid-19 crisis has triggered the same dynamic as earlier rounds of QE. From the end of 2019 to the end of 2020, mutual fund Treasury allocations went from underweight 15.0% to underweight 21.0%. The agency debt and MBS allocation ran relatively flat, going from underweight 7.4% to underweight 6.5%. But the credit allocation jumped again, going from overweight 14.8% to overweight 19.0%.
The rationale for mutual funds and other relative value investors is straightforward. If the Fed is a buyer of any asset for policy rather than for traditional investment value, that asset is likely to get steadily richer against alternatives. Since QE adds cash to the financial system and tends to put deposits on bank balance sheets at points in the economy when loan demand is low, banks also tend to pile into MBS and, to a lesser extent, Treasury debt along with the Fed. Since banks tend to emphasize spread income over traditional risk-adjusted return, that tends to richen the targeted assets, too.
When the Fed begins to taper after the current round of QE, mutual funds are almost certain to keep a close eye on the shifting value between Treasury debt, MBS and credit. If credit runs into new stress, Treasury debt may get the mutual fund bid. If not, MBS may get the bid. It is only one quarter, but through March of this year mutual funds went further underweight Treasury debt by 0.3%, bought back some of the agency underweight by 0.3% and sold some of the credit overweight by 0.6%.
When the time comes for mutual funds to play their role and patrol relative value in fixed income, they should have a good supply of new money. Even though bond mutual funds lost nearly $200 billion early in the pandemic, they have since made it back and netted a cumulative $450 billion (Exhibit 2). Active bond funds continue to hold the upper hand over bond ETFs, even though ETFs had minimal net outflows at the start of pandemic. Active bond AUM should exceed $6 trillion by the time Fed taper ends, and that will be plenty of weight to throw around in the relative value markets.
Exhibit 2: Mutual funds AUM fell nearly $200 billion in March 2020 but has made it back and added a net $450 billion
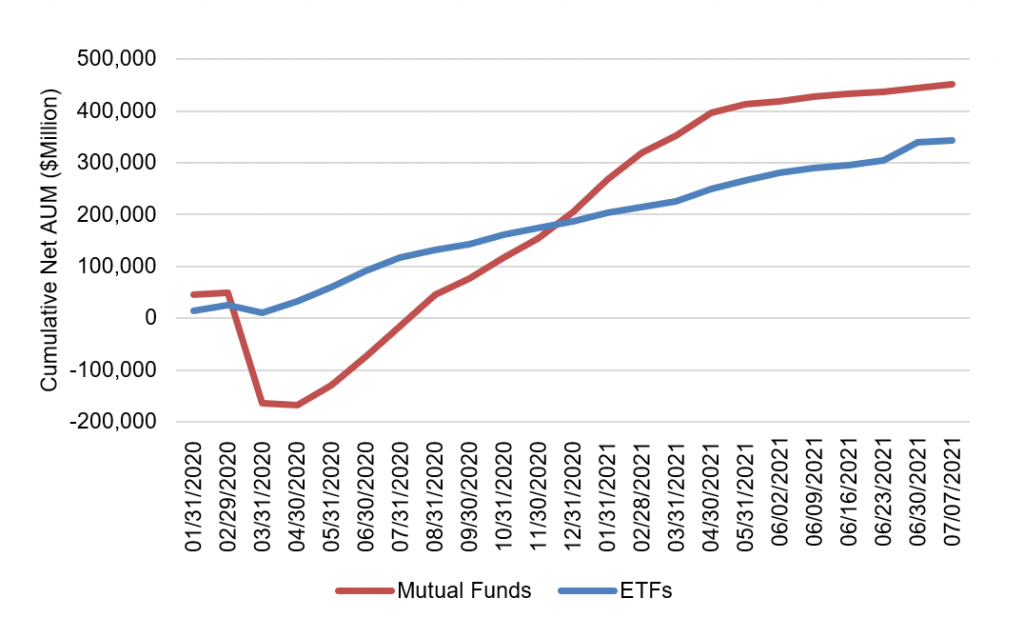
Source: ICI, Amherst Pierpont Securities
* * *
The view in rates
Fed RRP balances closed Friday at nearly $818 billion. The explosion in RRP since the end of March, when temporary Fed rules lapsed that made it easier for large banks to hold excess reserves, has reduced pressure on banks to accept new deposits. The lift in the RRP rate from 0 bp to 5 bp at the June FOMC should keep balances healthy.
Settings on 3-month LIBOR closed the week at 13.4 bp, just 2 bp above the lowest setting ever. The front end is still awash in cash. Fed tapering should keep adding cash to the front end into the second half of 2022, so money market rates look likely to remain low into 2022, as well.
The 10-year note has finished the most recent session at 1.29%, down 7 bp on the week. Breakeven 10-year inflation is at 234 bp, up on the week by 4 bp. Once again, real rates continue to fall and drag down nominal rates, reflecting market concern with persistent liquidity and little growth or other engines of demand to borrow. The 10-year real rate finished the week at negative 105 bp, down 11 bp on the week.
The Treasury yield curve has finished its most recent session with 2s10s at 107 bp, 8 bp flatter than a week ago. The 5s30s curve has finished at 115 bp, flatter by 5 bp.
The view in spreads
The prospect of Fed tapering and heavy net supply should keep weighing on MBS spreads until the Fed shows its hand and the market can price the impact. The market has already priced additional risk of soft demand and steady supply, with the nominal spread of par 30-year MBS to the 7.5-year Treasury at 72 bp, wider from the end of May by 10 bp. Spreads look vulnerable to going still wider as the Fed likely leans into tapering or tapering-and-hiking faster than its 2013-to-2015 cycle.
In credit, benchmark investment grade cash spreads have widened only 2 bp from the end of May and should continue to outperform MBS. Demand from mutual funds, international portfolios and insurers looks healthy. Low rates should continue supporting corporate balance sheet strength. Ratios of EBITDA to interest expense are in the middle of the range despite high ratios of debt to EBITDA. Investor demand for yield should keep spreads relatively tight. A strong economy should help credit spreads, but relative value flows at money managers could still soften credit spreads if MBS gets wide enough.
The view in credit
Consumers are strong and most corporations in good shape. Fundamental credit should hinge on whether the Fed can orchestrate a soft landing as it starts to tighten financial conditions. Consumers finished the first quarter of 2021 with net worth up $5 trillion. Aggregate savings jumped again as did home values and investment portfolios. Consumers have not added much debt. Corporate balance sheets have taken on more leverage, although mitigated by strong cash balances and low interest costs. EBITDA-to-interest-expense is at healthy levels. Strong economic growth in 2021 and 2022 should lift most EBITDA and continue easing credit concerns. Eventually, rising interest expense in 2023 should compete with EBITDA growth.
This material is intended only for institutional investors and does not carry all of the independence and disclosure standards of retail debt research reports. In the preparation of this material, the author may have consulted or otherwise discussed the matters referenced herein with one or more of SCM’s trading desks, any of which may have accumulated or otherwise taken a position, long or short, in any of the financial instruments discussed in or related to this material. Further, SCM may act as a market maker or principal dealer and may have proprietary interests that differ or conflict with the recipient hereof, in connection with any financial instrument discussed in or related to this material.
This message, including any attachments or links contained herein, is subject to important disclaimers, conditions, and disclosures regarding Electronic Communications, which you can find at https://portfolio-strategy.apsec.com/sancap-disclaimers-and-disclosures.
Important Disclaimers
Copyright © 2026 Santander US Capital Markets LLC and its affiliates (“SCM”). All rights reserved. SCM is a member of FINRA and SIPC. This material is intended for limited distribution to institutions only and is not publicly available. Any unauthorized use or disclosure is prohibited.
In making this material available, SCM (i) is not providing any advice to the recipient, including, without limitation, any advice as to investment, legal, accounting, tax and financial matters, (ii) is not acting as an advisor or fiduciary in respect of the recipient, (iii) is not making any predictions or projections and (iv) intends that any recipient to which SCM has provided this material is an “institutional investor” (as defined under applicable law and regulation, including FINRA Rule 4512 and that this material will not be disseminated, in whole or part, to any third party by the recipient.
The author of this material is an economist, desk strategist or trader. In the preparation of this material, the author may have consulted or otherwise discussed the matters referenced herein with one or more of SCM’s trading desks, any of which may have accumulated or otherwise taken a position, long or short, in any of the financial instruments discussed in or related to this material. Further, SCM or any of its affiliates may act as a market maker or principal dealer and may have proprietary interests that differ or conflict with the recipient hereof, in connection with any financial instrument discussed in or related to this material.
This material (i) has been prepared for information purposes only and does not constitute a solicitation or an offer to buy or sell any securities, related investments or other financial instruments, (ii) is neither research, a “research report” as commonly understood under the securities laws and regulations promulgated thereunder nor the product of a research department, (iii) or parts thereof may have been obtained from various sources, the reliability of which has not been verified and cannot be guaranteed by SCM, (iv) should not be reproduced or disclosed to any other person, without SCM’s prior consent and (v) is not intended for distribution in any jurisdiction in which its distribution would be prohibited.
In connection with this material, SCM (i) makes no representation or warranties as to the appropriateness or reliance for use in any transaction or as to the permissibility or legality of any financial instrument in any jurisdiction, (ii) believes the information in this material to be reliable, has not independently verified such information and makes no representation, express or implied, with regard to the accuracy or completeness of such information, (iii) accepts no responsibility or liability as to any reliance placed, or investment decision made, on the basis of such information by the recipient and (iv) does not undertake, and disclaims any duty to undertake, to update or to revise the information contained in this material.
Unless otherwise stated, the views, opinions, forecasts, valuations, or estimates contained in this material are those solely of the author, as of the date of publication of this material, and are subject to change without notice. The recipient of this material should make an independent evaluation of this information and make such other investigations as the recipient considers necessary (including obtaining independent financial advice), before transacting in any financial market or instrument discussed in or related to this material.
Important disclaimers for clients in the EU and UK
This publication has been prepared by Trading Desk Strategists within the Sales and Trading functions of Santander US Capital Markets LLC (“SanCap”), the US registered broker-dealer of Santander Corporate & Investment Banking. This communication is distributed in the EEA by Banco Santander S.A., a credit institution registered in Spain and authorised and regulated by the Bank of Spain and the CNMV. Any EEA recipient of this communication that would like to affect any transaction in any security or issuer discussed herein should do so with Banco Santander S.A. or any of its affiliates (together “Santander”). This communication has been distributed in the UK by Banco Santander, S.A.’s London branch, authorised by the Bank of Spain and subject to regulatory oversight on certain matters by the Financial Conduct Authority (FCA) and the Prudential Regulation Authority (PRA).
The publication is intended for exclusive use for Professional Clients and Eligible Counterparties as defined by MiFID II and is not intended for use by retail customers or for any persons or entities in any jurisdictions or country where such distribution or use would be contrary to local law or regulation.
This material is not a product of Santander´s Research Team and does not constitute independent investment research. This is a marketing communication and may contain ¨investment recommendations¨ as defined by the Market Abuse Regulation 596/2014 ("MAR"). This publication has not been prepared in accordance with legal requirements designed to promote the independence of research and is not subject to any prohibition on dealing ahead of the dissemination of investment research. The author, date and time of the production of this publication are as indicated herein.
This publication does not constitute investment advice and may not be relied upon to form an investment decision, nor should it be construed as any offer to sell or issue or invitation to purchase, acquire or subscribe for any instruments referred herein. The publication has been prepared in good faith and based on information Santander considers reliable as of the date of publication, but Santander does not guarantee or represent, express or implied, that such information is accurate or complete. All estimates, forecasts and opinions are current as at the date of this publication and are subject to change without notice. Unless otherwise indicated, Santander does not intend to update this publication. The views and commentary in this publication may not be objective or independent of the interests of the Trading and Sales functions of Santander, who may be active participants in the markets, investments or strategies referred to herein and/or may receive compensation from investment banking and non-investment banking services from entities mentioned herein. Santander may trade as principal, make a market or hold positions in instruments (or related derivatives) and/or hold financial interest in entities discussed herein. Santander may provide market commentary or trading strategies to other clients or engage in transactions which may differ from views expressed herein. Santander may have acted upon the contents of this publication prior to you having received it.
This publication is intended for the exclusive use of the recipient and must not be reproduced, redistributed or transmitted, in whole or in part, without Santander’s consent. The recipient agrees to keep confidential at all times information contained herein.


