


By the Numbers
Prepayment speeds are showing signs of burnout
Brian Landy, CFA | July 9, 2021
This material is a Marketing Communication and does not constitute Independent Investment Research.
Fannie Mae and Freddie Mac MBS prepayment speeds posted modest increases in June, a sign that originators are having difficulty finding borrowers wiling to refinance at the current mortgage rate of roughly 3%. Many borrowers already refinanced when rates were at this level or below. And the borrowers that failed to refinance when rates were even lower may be unable or unwilling to refinance now. The GSEs introduced a new refinance program for low-income borrowers in June, but origination was very low during the first month. This program appears unlikely to broadly raise prepayment speeds but should assist some borrowers that lost income during the pandemic.
The refi index shows signs of burnout
Originators may be struggling to generate refinance business at current mortgage rates. The number of borrowers in-the-money to refinance at a 3% mortgage rate has fallen considerably over the last year. The MBA refinance index has drifted lower over the last few months despite steady mortgage rates since mid-April. That suggests that burnout may be growing among the remaining in-the-money loans, a good sign for investors holding very high coupon pools that had remained stubbornly fast.
The refinance index has fallen to a level consistent with a 3.5% mortgage rate prior to the pandemic (Exhibit 1). Last year the index almost broke 4,000 when mortgage rates first approached 3%. And as recently as May the index was nearly 3,300. But since then, it has fallen almost 15%, to 2,791.
Exhibit 1: The refi index is 1,000 points lower than July 2020 at the same mortgage rate
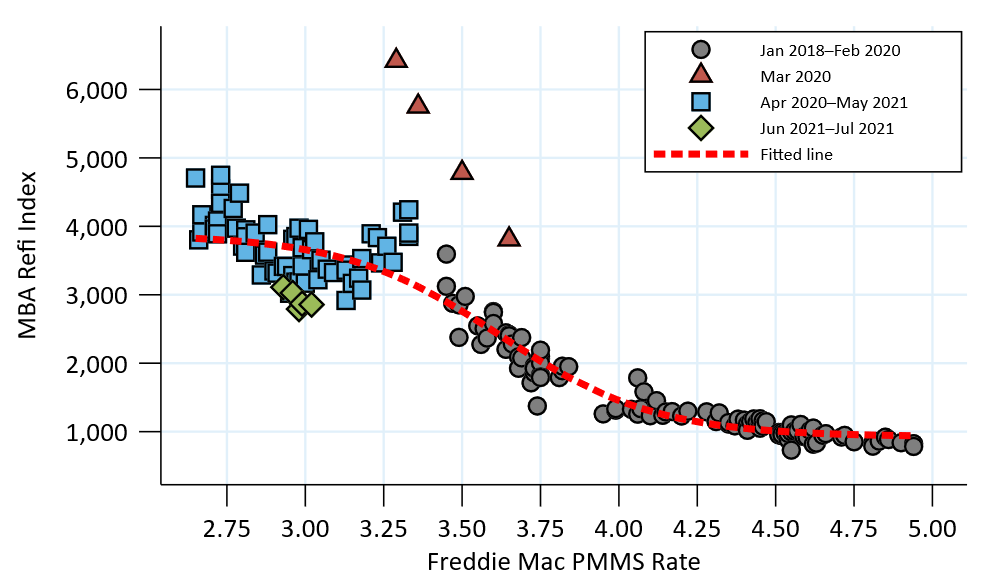
Source: MBA, Bloomberg, Amherst Pierpont Securities
June speeds on most cohorts with a coupon of at least 3.5% increased less than 5%, while higher day count suggested speeds should increase as much as 10%. This is consistent with the drop in the index from April to May. And since the index fell in June, it is likely that refinances will slow further in the August report.
Home purchase activity has also been falling
The housing market has been on fire for most of the pandemic. Prices have surged higher, and homes have been selling at a rapid pace. But this has caused the for-sale inventory to fall to record low levels. As a result, purchase activity has fallen over the last few months (Exhibit 2). Recent purchase activity is consistent with activity in 2019. This should contribute to slower prepayment speeds across the coupon stack, boosting extension risk in MBS.
Exhibit 2: The MBA purchase index has been falling for most of 2021
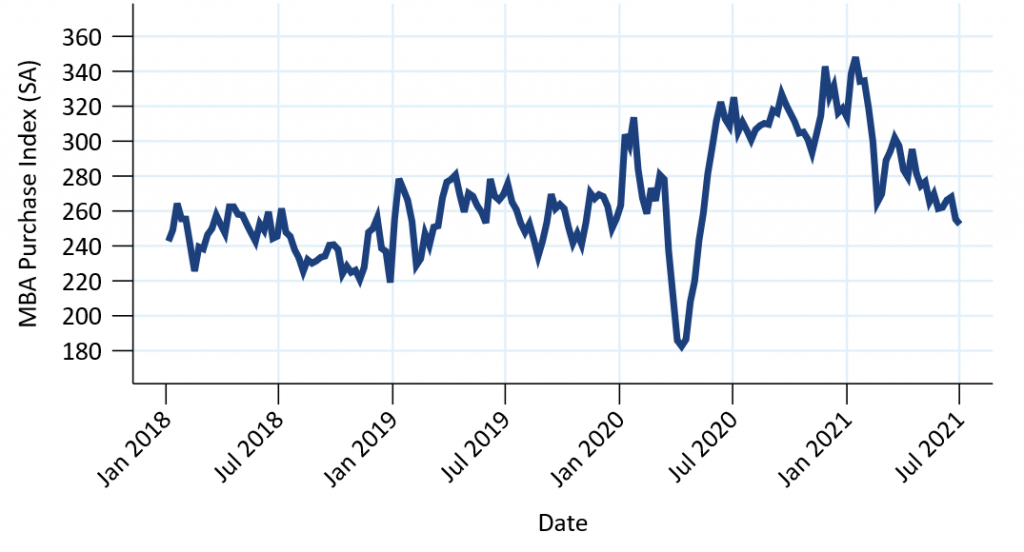
Source: MBA, Bloomberg, Amherst Pierpont Securities
Looking ahead
MBS prepayment speeds should slow roughly 10% to 15% in July, due to a combination of slowing refinancing, slowing housing turnover, and one fewer business day. Refinancing is likely to continue a slow decline in the following months if mortgage rates do not move lower, as originators should find it increasingly difficult to refinance borrowers that have passed up better opportunities over the past year.
The first month of RefiNow volume was tiny
Fannie Mae and Freddie Mac introduced new refinance programs in June geared towards borrowers that lost income during the pandemic. Fannie Mae started identifying loans that come through this program in June, while Freddie Mac plans to do so in September. The disclosure will also identify loans that are originated through other programs targeted at low-income borrowers—loans originated through state Housing Finance Agencies (HFA) and loans originated through Fannie Mae’s HomeReady and Freddie Mac’s Home Possible programs.
Fannie Mae issuance volume for RefiNow loans was negligible last month (Exhibit 3). Investors were concerned that a new refinance program could significantly boost prepayment speeds. While it is likely too early to draw a definitive conclusion, it is encouraging to see small volume to start. Through July 7, only 126 loans from 65 different lenders had been issued in pools. The GSEs altered the program in mid-June to make it more accessible to borrowers that had used Covid-19 forbearance. Volume will likely increase as more lenders start using the program, and there is likely a small delay between origination and pooling. But the programs do not appear to have much appeal to borrowers that could already refinance using existing offerings.
The top portion of the exhibit shows purchase and refinance volume through each of the three programs as a percent of total production. The bottom half of the exhibit shows the percent of each loan purpose that comes from each program. The RefiNow program accounted for only 0.02% of total issuance, and 0.05% of total rate/term refinance issuance, from June 4 through July 7.
Exhibit 3: Only 126 RefiNow loans were originated and issued through July 7
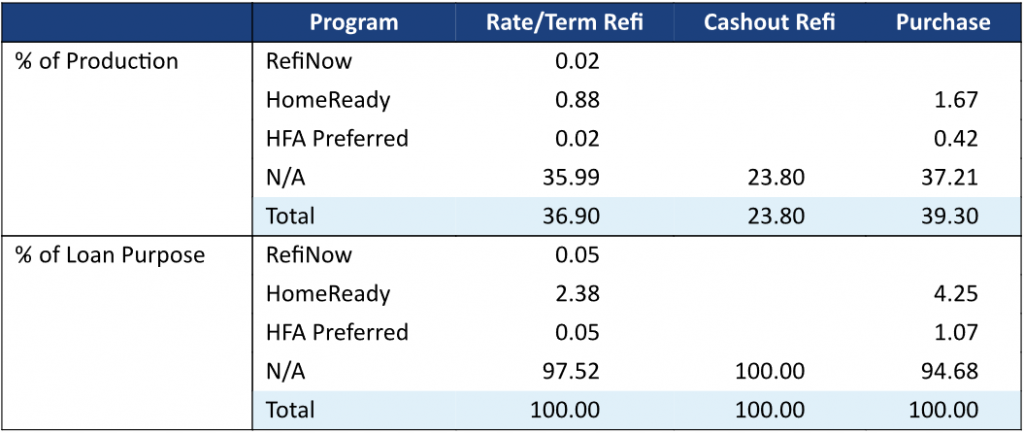
Data on pools issued from 6/4/2021 through 7/7/2021.
Source: Fannie Mae, eMBS, Amherst Pierpont Securities
The data also shows how rare HFA refinances are. HFA loans are typically believed to refinance slowly, although this can vary across HFAs and depends on the structure of the loan. The data shows that only 4.5% [=0.02/(0.02+0.42)] of HFA production were refinances. The HomeReady program generated larger refinance volume, roughly 34.5% of HomeReady loans were rate/term refinances. But standard rate/term refinances were comparable in volume to standard purchase loans, and total refinances far outpaced purchase production.
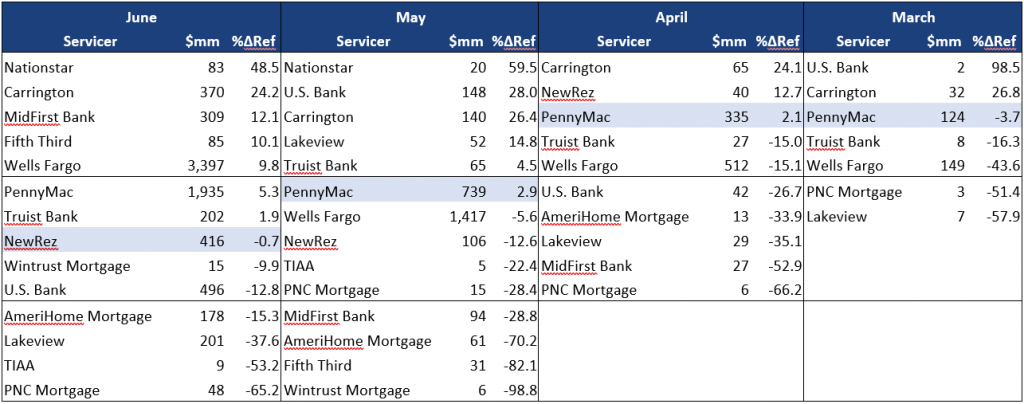
Ginnie Mae buyouts increased in June
Ginnie Mae II speeds increased 8.9% in June, due to a combination of faster voluntary prepayments and faster buyouts. The buyouts were heaviest in the 3.5% and 4.0% coupons, which explains the larger month-over-month increase those two coupons experienced.
Lakeview, Nationstar and Caliber drove much of the faster buyouts (Exhibit 4). This exhibit shows the bank and non-bank servicers with the largest amount of loans at least 60 days delinquent. Lakeview and Nationstar are the second and fourth largest servicers by this metric, so a pickup in buyouts has a noticeable effect on prepayment speeds. PennyMac continued to buyout loans at a rapid pace. Freedom Mortgage, however, continues to have the largest delinquent population and because they choose to buyout very few loans.
Exhibit 4: Ginnie Mae servicers with the largest delinquent pipelines
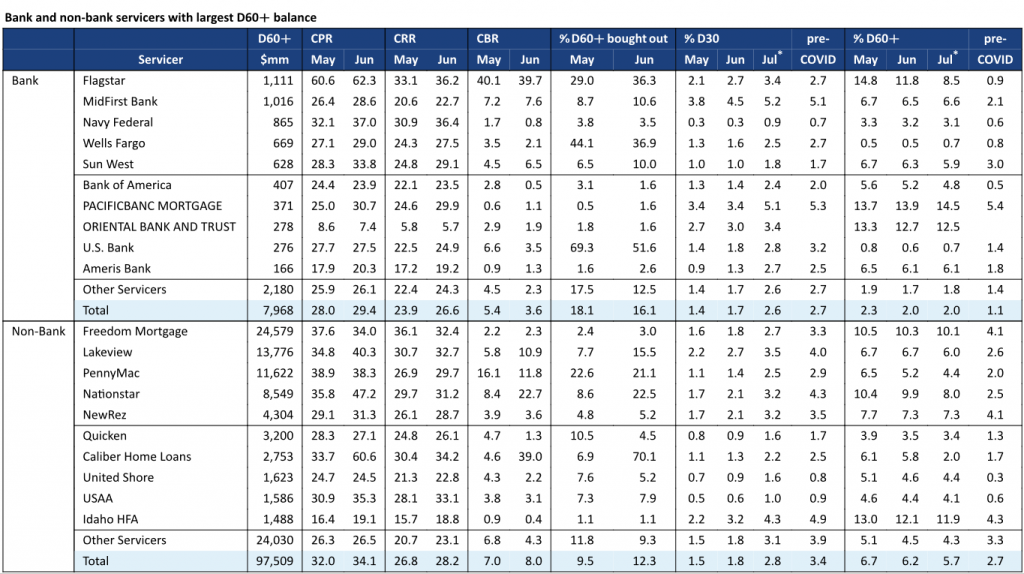
CRR—conditional repayment rate (voluntary prepayments); CBR—conditional buyout rate.
Source: Ginnie Mae, Amherst Pierpont Securities
RG pool speeds pickup in June
Prepayment speeds of RG pools increased in June, and for the first time they prepaid a little faster than loans with similar collateral characteristics in standard pools. These pools exclusively hold loans that were delinquent buyouts from a prior Ginnie Mae pool and subsequently cured without using a loan modification. Most of the loans are FHA loans that cure using a payment deferral, known as the partial claim. The RG loans prepaid 5% faster in June after controlling for characteristics like FHA concentration, note rate, loan age, loan size, servicer, and delinquency status. Controlling for delinquency status removes the effect of buyouts since most loans in RG pools are still current or 30-days delinquent.
The biggest change in behavior came from Wells Fargo’s pools (Exhibit 5). This compares each servicer’s RG loans to their non-RG loans, controlling for other collateral characteristics. In April Wells Fargo’s RG loans had prepaid 15.1% slower than comparable loans, but this jumped to 9.8% faster in May. The other large RG lender, PennyMac, also had a relative increase in June. But their increase was much smaller. Their loans went from 2.1% faster in April to 5.3% faster in June. Data on the smaller lenders is noisy, and maybe too early to draw firm conclusions. But Nationstar and Carrington have been consistently fast, while Lakeview and PNC have been consistently slow.
Exhibit 5:Relative prepayment behavior of loans in RG pools, by servicer
Source: Ginnie Mae, eMBS, Amherst Pierpont Securities
The Fannie and Freddie numbers
Fannie Mae and Freddie Mac prepayment speeds each increased roughly 6% in June, at the low end of street expectations and below the Amherst Pierpont forecast of a 15% increase (Exhibit 6). Two additional business days, lower lagged mortgage rates, and increasing seasonal turnover could all have contributed to faster speeds. However, the MBA refi index is showing that borrowers have become less sensitive to a 3% mortgage rate, and the MBA purchase index is pointing to slowing prepayments due to housing turnover. Both factors contributed to the slower than expected print. The new Federal holiday, Juneteenth, may have contributed to the slowdown as well.
Exhibit 6: Lower day count, turnover, and buyouts pull speeds down in January.
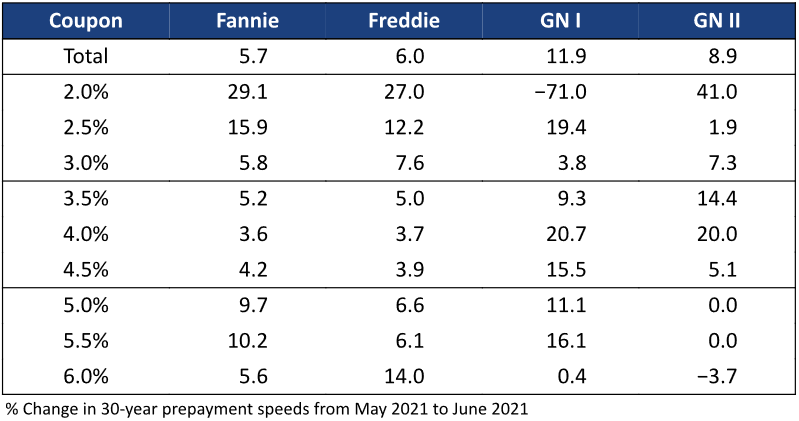
Source: Fannie Mae, Freddie Mac, Ginnie Mae, eMBS, Amherst Pierpont Securities
Data Tables
Exhibit 7: Prepayment Summary
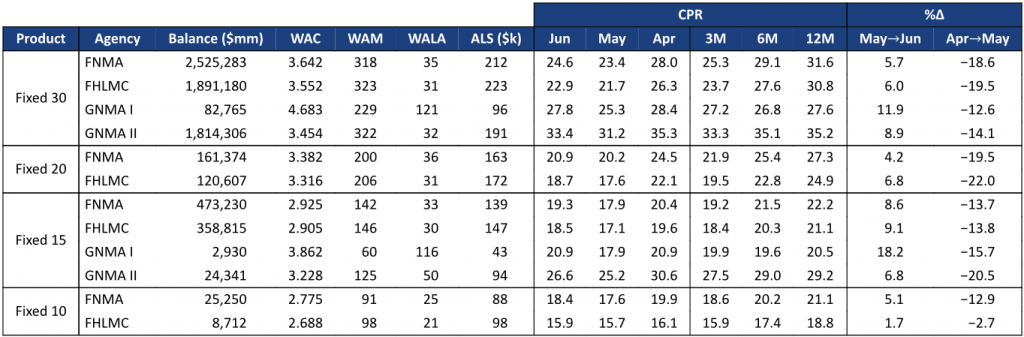
Source: Fannie Mae, Freddie Mac, Ginnie Mae, eMBS, Amherst Pierpont Securities
Our short term forecast is shown in Exhibit 10 (Fannie Mae) and Exhibit 11 (Freddie Mac). Exhibit 9 shows the static rates used in the prepayment forecast.
Exhibit 8: Agency Speeds, Largest Cohorts
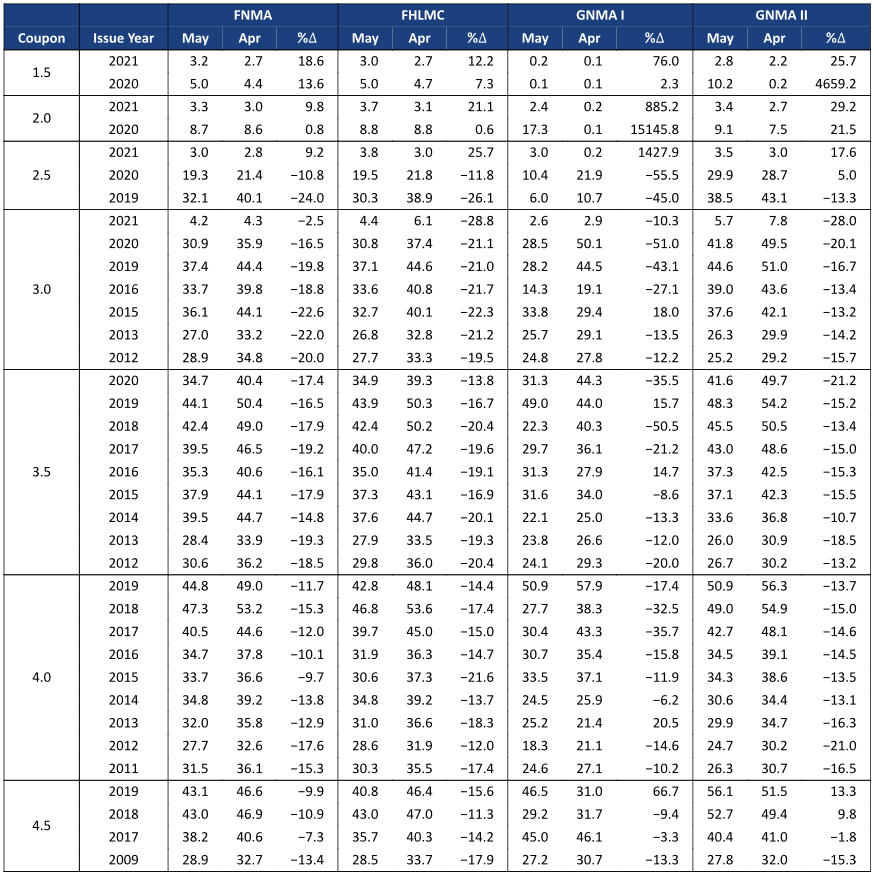
Source: Fannie Mae, Freddie Mac, Ginnie Mae, eMBS, 1010data, Amherst Pierpont Securities
Exhibit 9: Mortgage Rate Forecast
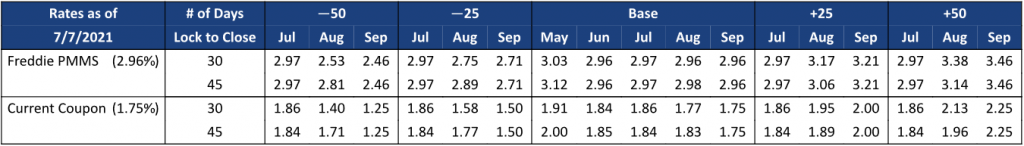
Source: Freddie Mac, Bloomberg, Amherst Pierpont Securities
Exhibit 10: Fannie Mae Short Term Forecast
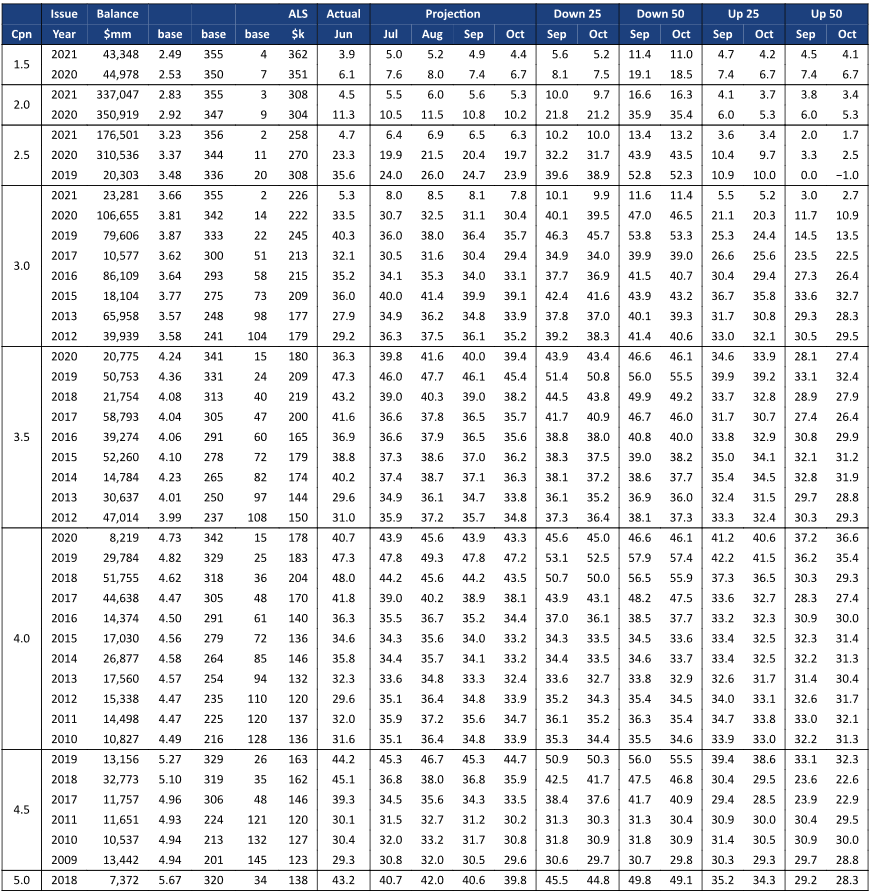
Source: Fannie Mae, eMBS, 1010data, Amherst Pierpont Securities
Exhibit 11: Freddie Mac Short Term Forecast
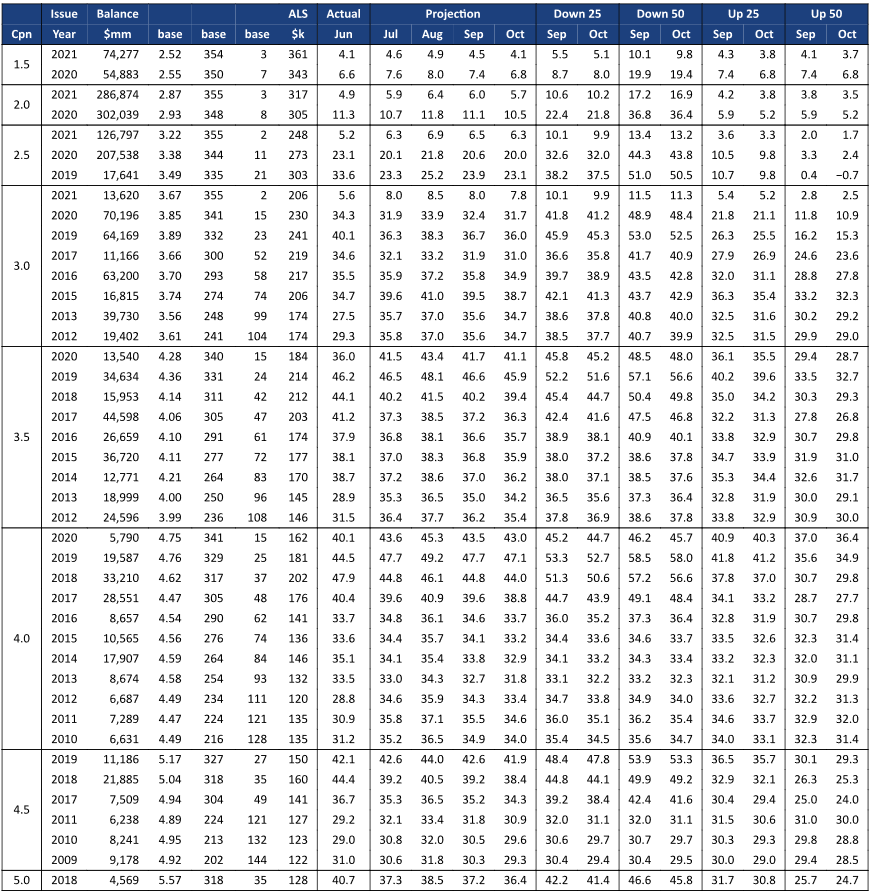
Source: Freddie Mac, eMBS, 1010data, Amherst Pierpont Securities