By the Numbers
The influences behind slower Ginnie Mae RG speeds
This material is a Marketing Communication and does not constitute Independent Investment Research.
Ginnie Mae RG pools have traded at substantial premiums to TBA over the last few months as investors look for and get slower prepayments and better convexity. The initial prepayment results show that better RG performance is partly explained by the pools having mostly FHA loans and smaller loan balances. But the prepayment advantage persists after controlling for key collateral attributes, suggesting that the past delinquencies on these loans may be suppressing speeds further. On average, RG loans have prepaid 20.5% slower than non-RG loans with matching characteristics.
As a refresher, RG pools consist of loans delinquent during the Covid-19 pandemic and subsequently bought out by their servicer. The loans subsequently cure after the buyout, typically with the servicer deferring the delinquent balance at no interest until the loan is pays off or matures. Investors have expected these pools to prepay slower than TBA pools, so the pools have been selling at a pay-up over TBA.
The loans in RG pools typically have smaller balances, are more seasoned, and are FHA-insured. Each of those characteristics should lead to slower prepayment speeds compared to their cohort or to TBA pools. These borrowers might prepay even more slowly since they were recently delinquent. However, there is no relevant historical data to support that claim, and these FHA borrowers can use a streamlined refinance despite their recent delinquencies. An in-depth discussion of post-forbearance Ginnie Mae loans and RG pools can be found here.
Comparing prepayments in RG pools over the last three months to two different groups of loans pulled from Ginnie Mae multiple issuer and custom pools highlights the RG differences (Exhibit 1). The first comparison, called the “reference”, is the 3-month CPR for groups of loans that have the same collateral characteristics as the corresponding group of RG loans. The reference speed controls for WAC, WALA, FHA MIP, loan size, government agency, state, and servicer. This adapts the methodology used for Amherst Pierpont’s Servicer Prepayment Rankings and quantifies how much faster or slower loans in RG pools prepaid compared to loans in other Ginnie Mae pools. The second comparison, called the “cohort”, is simply the average prepayment speed of all Ginnie Mae loans in multiple issuer pools for each combination of coupon and vintage. The cohort speed does not control for other differences in collateral characteristics between RG and non-RG pools.
Exhibit 1. RG pool prepayments have been slower than similar non-RG loans
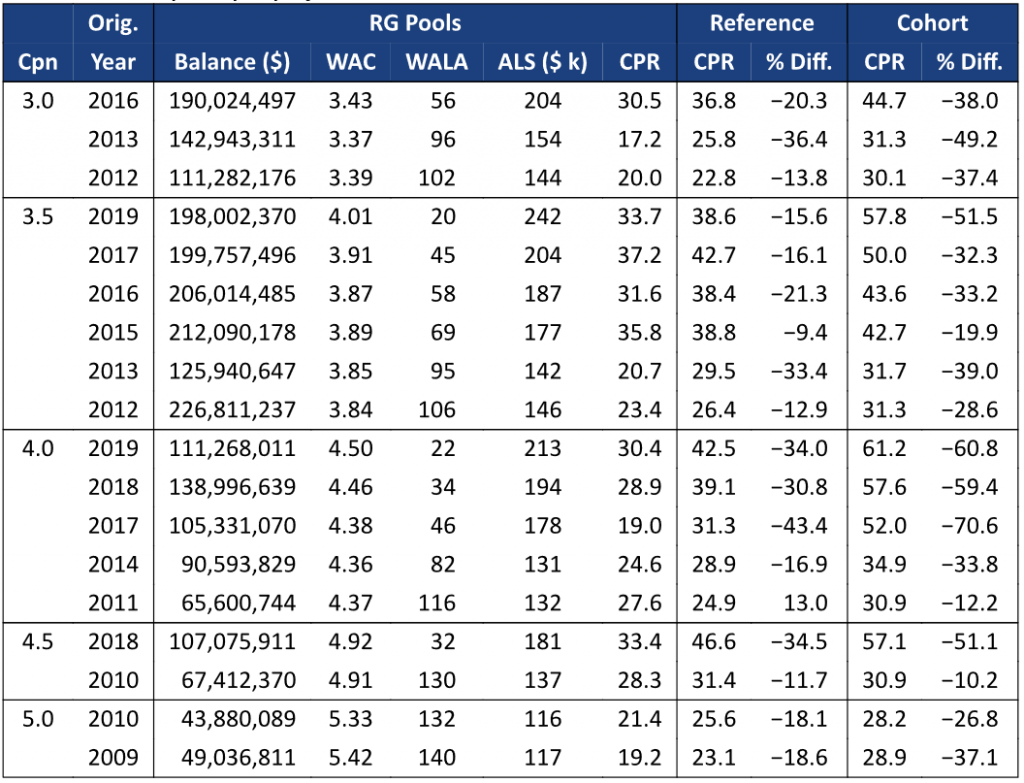
The reference loans have similar collateral characteristics to the RG loans in each coupon/vintage bucket and are sourced from Ginnie Mae multiple issuer and custom pools. The cohort includes all loans in Ginnie Mae multiple issuer pools matching that coupon and vintage.
Source: Ginnie Mae, eMBS, Amherst Pierpont Securities
The RG loans prepaid slower than the reference loans in all but one cohort. The typical difference ranged from 15% to 35% slower. Only one group, the 4.0%s 2011, prepaid faster. On average RG loans prepaid 20.5% slower than the reference cohort. This suggests that RG pools do offer some additional refinance protection above that conferred by loan characteristics, although it is too early to judge how long this benefit will persist.
The overall cohort speeds were faster than the reference speeds in all but one case. That difference shows how much slower RG pools should be due beneficial characteristics like higher FHA percentage. Cohort speeds tend to be fastest on newer vintages because those pools contain a lot of VA loans. Therefore, the gap between RG and cohort is generally widest on newer vintages. For example, the 4.0% 2019 cohort prepaid at 55.1 CPR, compared to 42.5 CPR for the reference and 30.4 CPR for the RG pools.
It is encouraging for investors that the RG loans issued so far have prepaid slower than comparable non-RG loans, although it is too early to know how long that difference will last. But even if these loans prepay at the same speed as their reference loans they should still offer better convexity than TBA.
This material is intended only for institutional investors and does not carry all of the independence and disclosure standards of retail debt research reports. In the preparation of this material, the author may have consulted or otherwise discussed the matters referenced herein with one or more of SCM’s trading desks, any of which may have accumulated or otherwise taken a position, long or short, in any of the financial instruments discussed in or related to this material. Further, SCM may act as a market maker or principal dealer and may have proprietary interests that differ or conflict with the recipient hereof, in connection with any financial instrument discussed in or related to this material.
This message, including any attachments or links contained herein, is subject to important disclaimers, conditions, and disclosures regarding Electronic Communications, which you can find at https://portfolio-strategy.apsec.com/sancap-disclaimers-and-disclosures.
Important Disclaimers
Copyright © 2026 Santander US Capital Markets LLC and its affiliates (“SCM”). All rights reserved. SCM is a member of FINRA and SIPC. This material is intended for limited distribution to institutions only and is not publicly available. Any unauthorized use or disclosure is prohibited.
In making this material available, SCM (i) is not providing any advice to the recipient, including, without limitation, any advice as to investment, legal, accounting, tax and financial matters, (ii) is not acting as an advisor or fiduciary in respect of the recipient, (iii) is not making any predictions or projections and (iv) intends that any recipient to which SCM has provided this material is an “institutional investor” (as defined under applicable law and regulation, including FINRA Rule 4512 and that this material will not be disseminated, in whole or part, to any third party by the recipient.
The author of this material is an economist, desk strategist or trader. In the preparation of this material, the author may have consulted or otherwise discussed the matters referenced herein with one or more of SCM’s trading desks, any of which may have accumulated or otherwise taken a position, long or short, in any of the financial instruments discussed in or related to this material. Further, SCM or any of its affiliates may act as a market maker or principal dealer and may have proprietary interests that differ or conflict with the recipient hereof, in connection with any financial instrument discussed in or related to this material.
This material (i) has been prepared for information purposes only and does not constitute a solicitation or an offer to buy or sell any securities, related investments or other financial instruments, (ii) is neither research, a “research report” as commonly understood under the securities laws and regulations promulgated thereunder nor the product of a research department, (iii) or parts thereof may have been obtained from various sources, the reliability of which has not been verified and cannot be guaranteed by SCM, (iv) should not be reproduced or disclosed to any other person, without SCM’s prior consent and (v) is not intended for distribution in any jurisdiction in which its distribution would be prohibited.
In connection with this material, SCM (i) makes no representation or warranties as to the appropriateness or reliance for use in any transaction or as to the permissibility or legality of any financial instrument in any jurisdiction, (ii) believes the information in this material to be reliable, has not independently verified such information and makes no representation, express or implied, with regard to the accuracy or completeness of such information, (iii) accepts no responsibility or liability as to any reliance placed, or investment decision made, on the basis of such information by the recipient and (iv) does not undertake, and disclaims any duty to undertake, to update or to revise the information contained in this material.
Unless otherwise stated, the views, opinions, forecasts, valuations, or estimates contained in this material are those solely of the author, as of the date of publication of this material, and are subject to change without notice. The recipient of this material should make an independent evaluation of this information and make such other investigations as the recipient considers necessary (including obtaining independent financial advice), before transacting in any financial market or instrument discussed in or related to this material.
Important disclaimers for clients in the EU and UK
This publication has been prepared by Trading Desk Strategists within the Sales and Trading functions of Santander US Capital Markets LLC (“SanCap”), the US registered broker-dealer of Santander Corporate & Investment Banking. This communication is distributed in the EEA by Banco Santander S.A., a credit institution registered in Spain and authorised and regulated by the Bank of Spain and the CNMV. Any EEA recipient of this communication that would like to affect any transaction in any security or issuer discussed herein should do so with Banco Santander S.A. or any of its affiliates (together “Santander”). This communication has been distributed in the UK by Banco Santander, S.A.’s London branch, authorised by the Bank of Spain and subject to regulatory oversight on certain matters by the Financial Conduct Authority (FCA) and the Prudential Regulation Authority (PRA).
The publication is intended for exclusive use for Professional Clients and Eligible Counterparties as defined by MiFID II and is not intended for use by retail customers or for any persons or entities in any jurisdictions or country where such distribution or use would be contrary to local law or regulation.
This material is not a product of Santander´s Research Team and does not constitute independent investment research. This is a marketing communication and may contain ¨investment recommendations¨ as defined by the Market Abuse Regulation 596/2014 ("MAR"). This publication has not been prepared in accordance with legal requirements designed to promote the independence of research and is not subject to any prohibition on dealing ahead of the dissemination of investment research. The author, date and time of the production of this publication are as indicated herein.
This publication does not constitute investment advice and may not be relied upon to form an investment decision, nor should it be construed as any offer to sell or issue or invitation to purchase, acquire or subscribe for any instruments referred herein. The publication has been prepared in good faith and based on information Santander considers reliable as of the date of publication, but Santander does not guarantee or represent, express or implied, that such information is accurate or complete. All estimates, forecasts and opinions are current as at the date of this publication and are subject to change without notice. Unless otherwise indicated, Santander does not intend to update this publication. The views and commentary in this publication may not be objective or independent of the interests of the Trading and Sales functions of Santander, who may be active participants in the markets, investments or strategies referred to herein and/or may receive compensation from investment banking and non-investment banking services from entities mentioned herein. Santander may trade as principal, make a market or hold positions in instruments (or related derivatives) and/or hold financial interest in entities discussed herein. Santander may provide market commentary or trading strategies to other clients or engage in transactions which may differ from views expressed herein. Santander may have acted upon the contents of this publication prior to you having received it.
This publication is intended for the exclusive use of the recipient and must not be reproduced, redistributed or transmitted, in whole or in part, without Santander’s consent. The recipient agrees to keep confidential at all times information contained herein.


