By the Numbers
Assessing risk for FRESB investors
This material is a Marketing Communication and does not constitute Independent Investment Research.
The epicenter of multifamily loans in forbearance for Freddie Mac has been in the small balance loan program as opposed to those in the standard K-series. A FRESB deal with 20% of loans in forbearance can have a very idiosyncratic risk profile, where risk due to involuntary prepayments can range from zero to highly concentrated depending on the class. By drilling down on a tranche-by-tranche basis, investors can also track how loans in forbearance are transitioning either back to performing status or into serious delinquency and default.
Exhibit 1: Freddie Mac multifamily forbearance summary
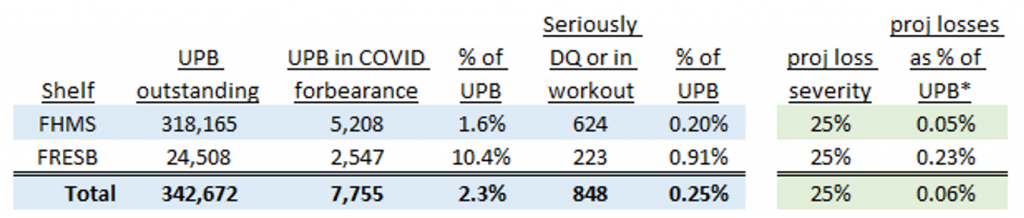
Note: *projected losses assume all loans seriously delinquent or currently in special servicing default and have losses. It also assumes none of the loans that are currently performing or late, the bulk of which are still in forbearance, eventually default. Reasonable projections can vary substantially. All data as of 5/26/2021.
Source: Bloomberg, Amherst Pierpont Securities
A summary of multifamily loans that entered COVID-related forbearance across the two programs (Exhibit 1) shows that 1.6% of standard K-series loans entered forbearance, compared to 10.4% of small balance loans. This is not surprising and is in no way indicative of weaker underwriting of the small balance program. Small balance loans tend to be for smaller buildings, tend to skew towards properties that are owned by mom-and-pop investors and often provide housing for moderate- to low-income tenants. During Covid, those tenants were more likely to experience income loss and economic hardship and struggled more to pay rent. And obviously when two tenants cannot pay rent for six months, it has a much greater impact on the owner of a building with five units than one with 50 units.
Consequently, FRESB security investors have been tracking forbearance rolls carefully. Unlike FHMS or FREMF securities, which are structured with sequential classes or pass-throughs where the underlying collateral supports all classes, the loans in FRESB securities are assigned to particular tranches based on the interest rate type (fixed = F and hybrid fixed-to-floating = H) and maturity (5-, 7- or 10-year final). An investor in the A2 class of an FHMS security, or the loss-absorbing B-piece of its companion FREMF security, cares what total percentage of the collateral is in forbearance because involuntary prepays and defaults, respectively, impact the performance. The exposure for an investor FRESB 2019-SB60, for example, where 21% of the collateral entered forbearance, ranges from a high of 38% in the A5H security to a low of 3.0% in the A7H security (Exhibits 2 and 3, tables in order by deal vintage and number).
Exhibit 2: FRESB loans that entered COVID-19 forbearance by tranche
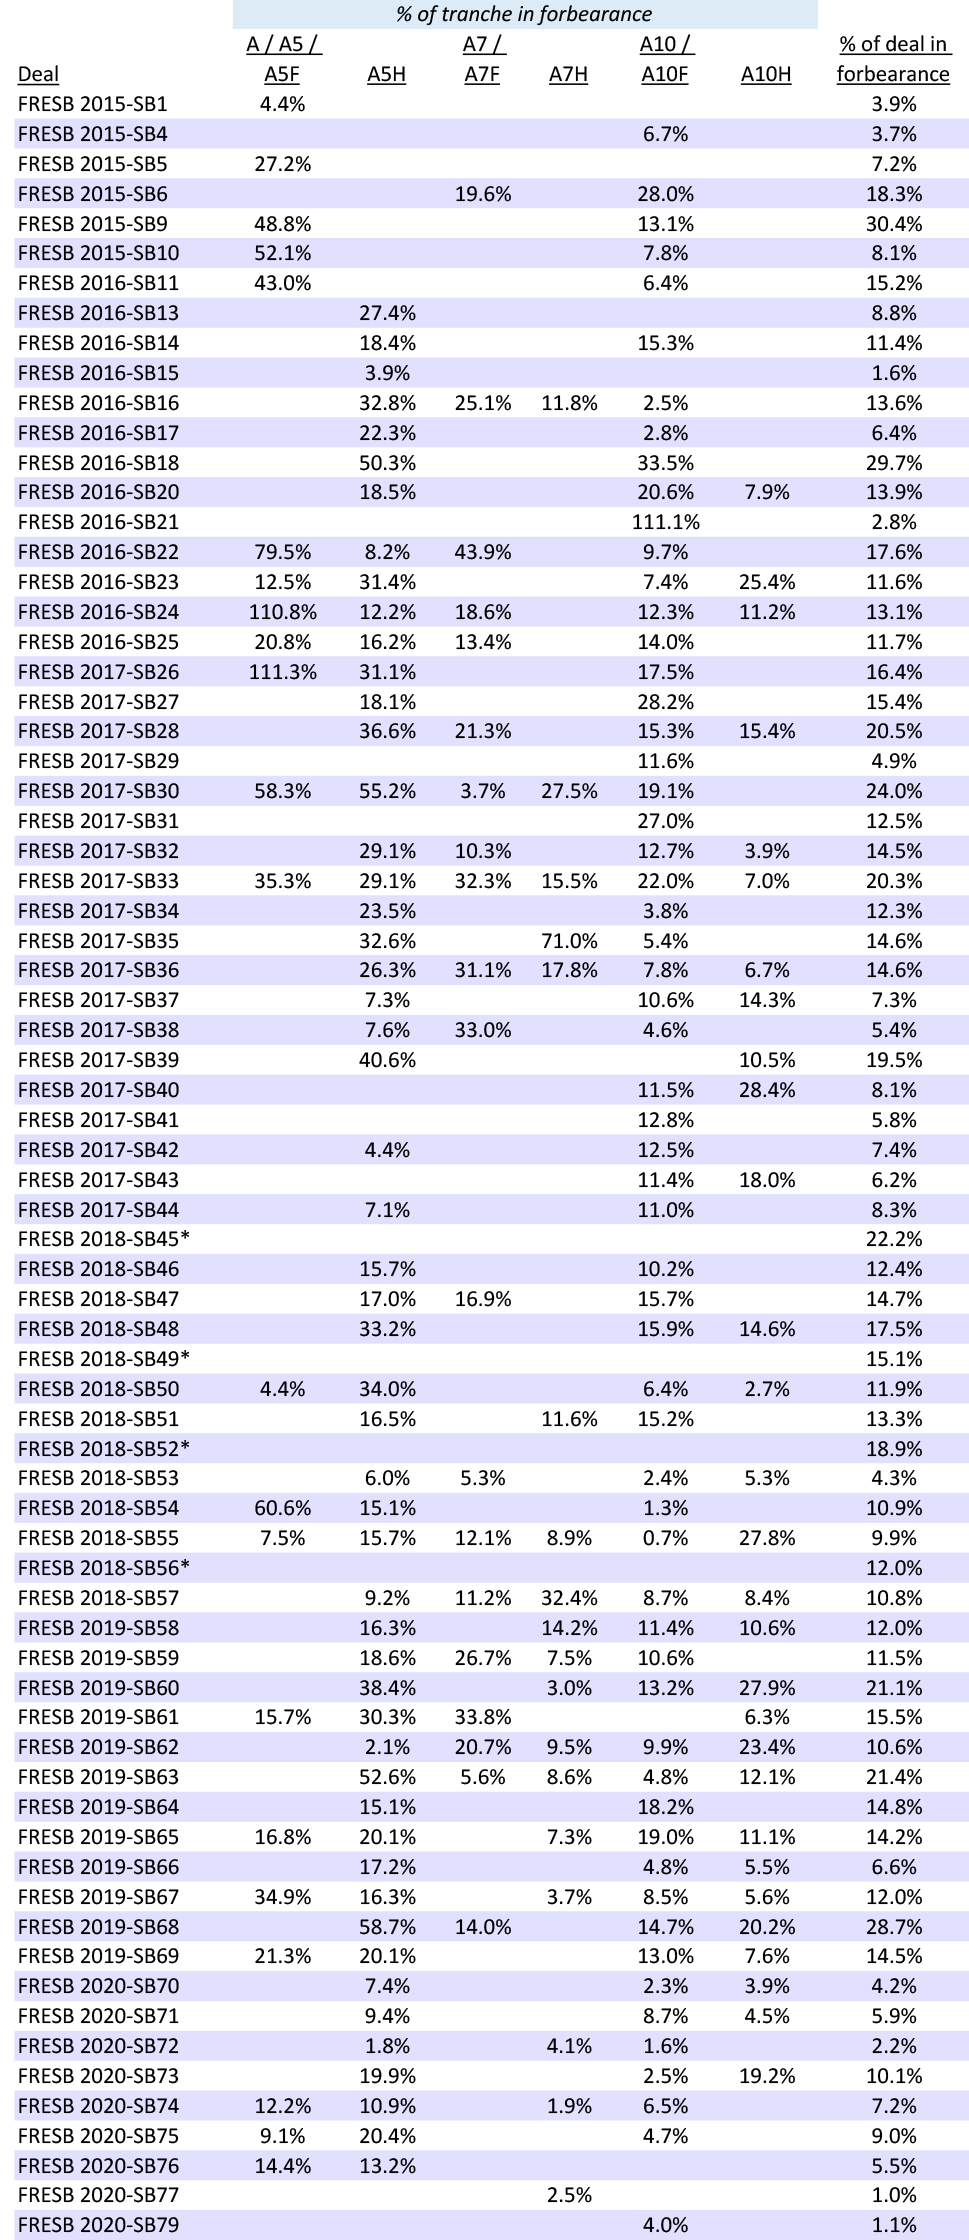
Note: Starred deals ‘*’ have non-standard asset groupings and it cannot be definitively determined which loans belong to each tranche. Please refer to deal documents for these deals. The % of tranche in forbearance is calculated as the current trust balance of the loan(s) in forbearance divided by the amount of UPB outstanding of the tranche. As a loan stays in forbearance or falls delinquent the trust balance will increase by the forborne or delinquent payments. In some instances the current trust balance of the loan may exceed the tranche UPB outstanding, in particular if that loan is the last one outstanding in the tranche. Data as of 5/26/2021.
Source: Bloomberg, Amherst Pierpont Securities
Exhibit 3: Current payment status of loans that entered COVID-19 forbearance by tranche
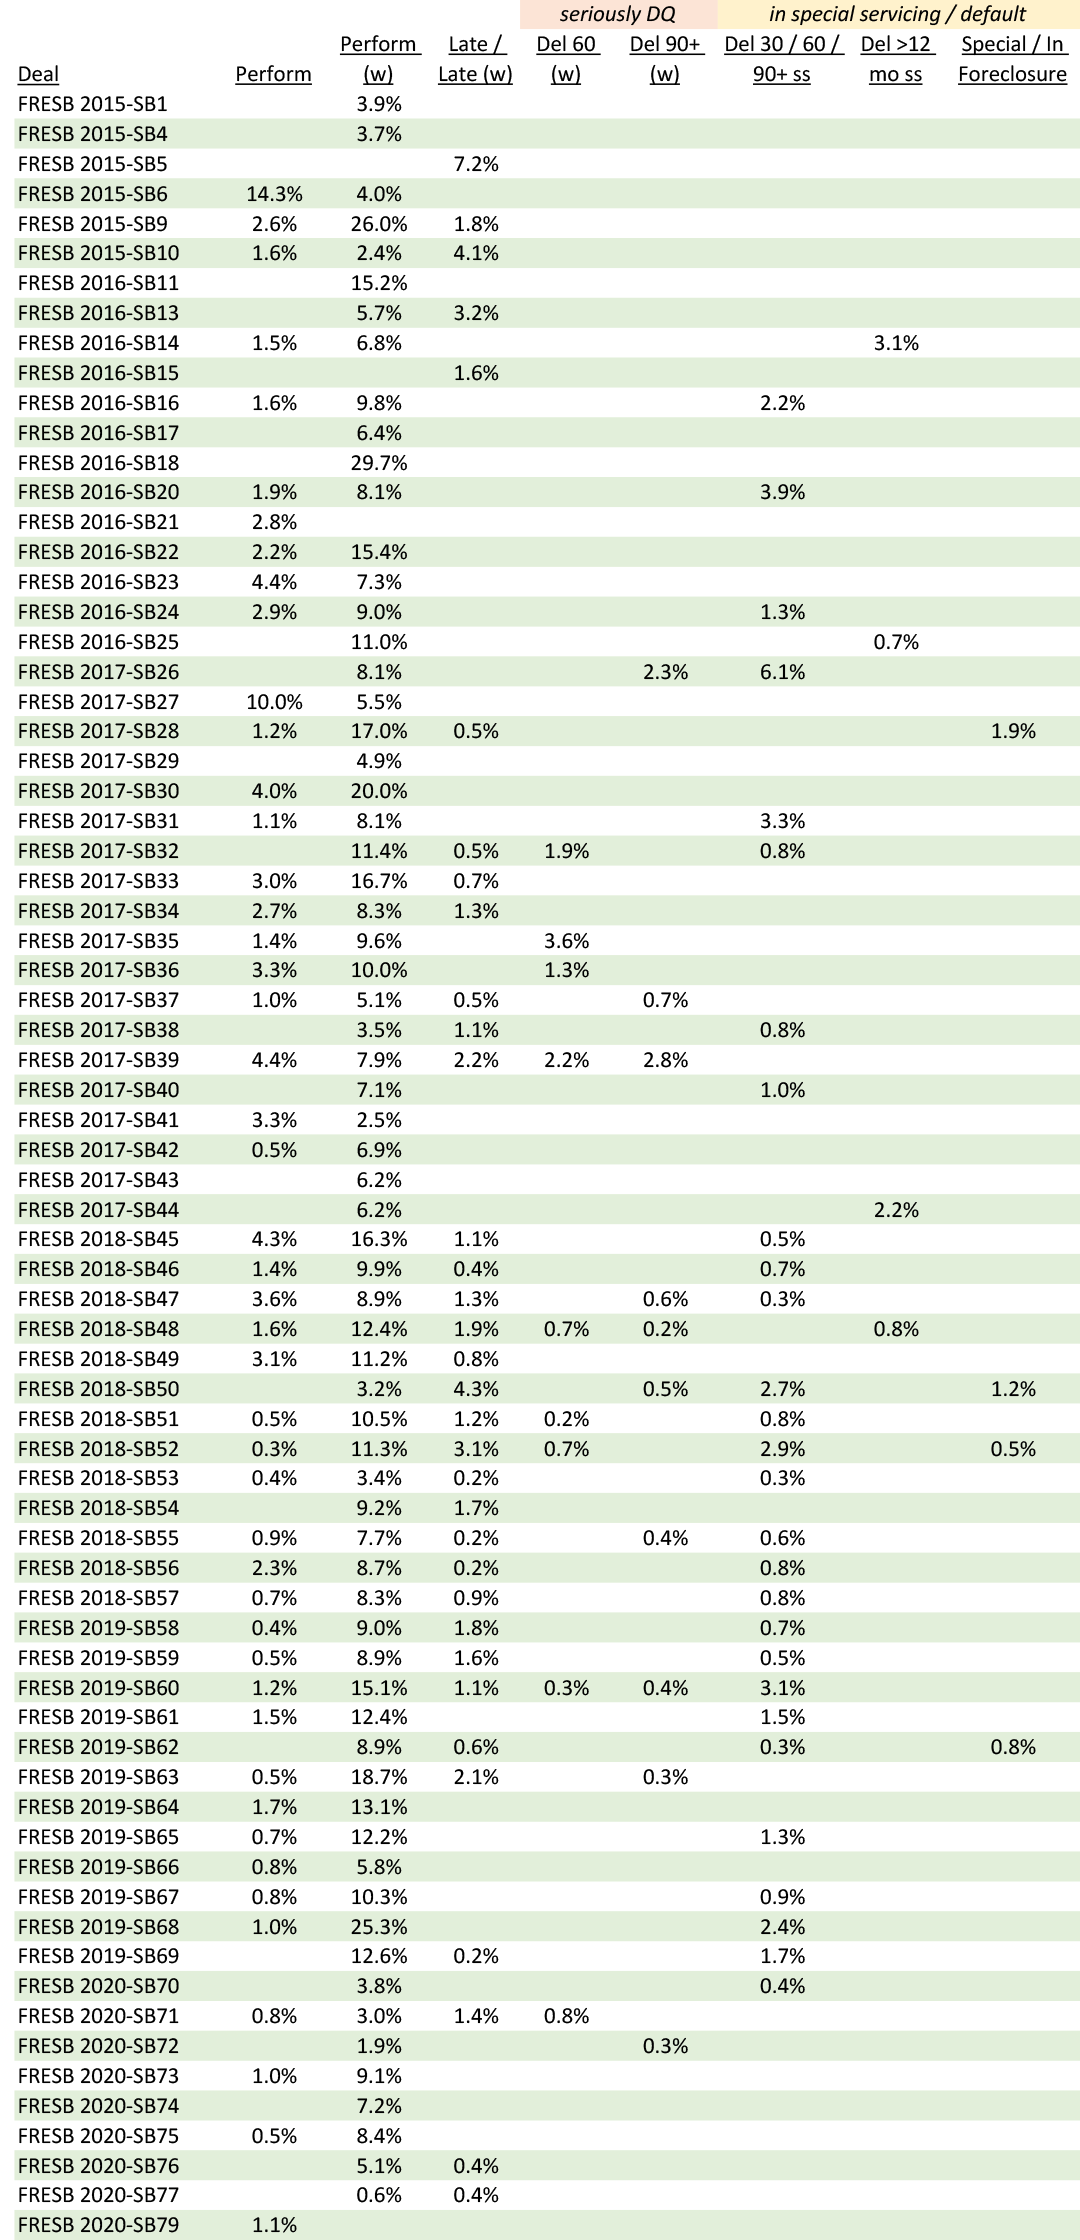
Note: Loans in COVID-19 forbearance that have not fully cured are on the watchlist, which is designated with a (w) on the payment status. Data as of 5/26/2021.
Source: Bloomberg, Amherst Pierpont Securities
Once the risk profile is identified for the specific deal and tranche, investors can use that to assess the payment status of loans in forbearance for a particular tranche. Of the 21% of collateral that entered COVID-related forbearance at some point in the FRESB 2019-SB60 deal, 1.2% has exited forbearance and is reperforming, 15% is performing while still in forbearance and 3% is already in special servicing or default (Exhibit 3). In the FRESB 2019-SB60 A10H tranche, 27.9% of the collateral entered forbearance: 11.2% of that collateral is in forbearance and currently performing, while 16.7% (from 10 loans) is 90+ days delinquent and in special servicing (Exhibit 4). This illustrates the considerable different in risk exposure across tranches even in the same deal. The A7H class of the SB60 deal only has 3% of the underlying UPB that ever entered forbearance, while this A10H class has 27.9% and 16.7% of those are already in special servicing and will likely result in default.
Exhibit 4: Current status of loans in COVID-19 forbearance for a particular tranche
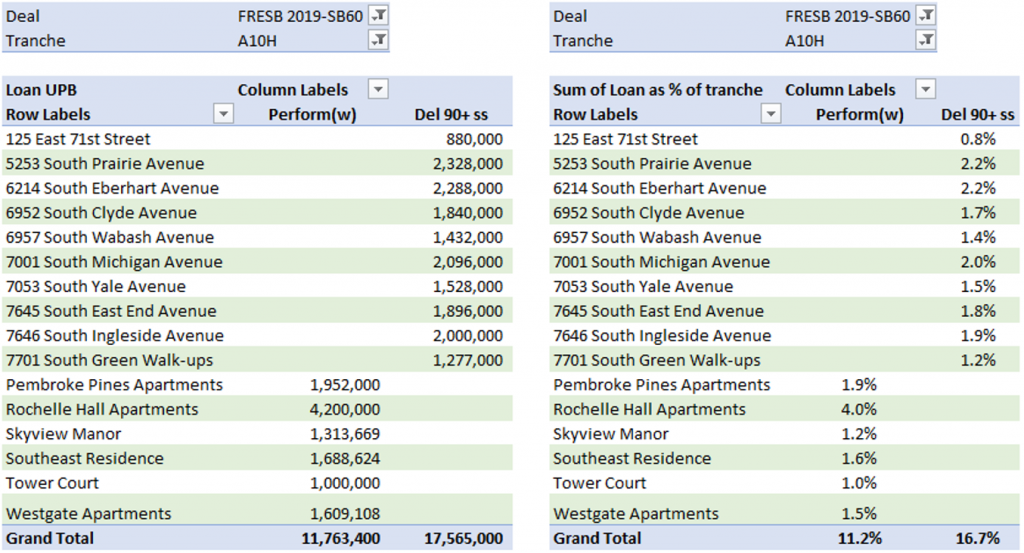
Note: Table on the left shows the current loan UPB; table on the right shows UPB as % of the tranche. All data as of 5/26/2021.
Source: Bloomberg, Amherst Pierpont Securities
Investors need to drill down on loan-by-loan in each security to determine the exposure by tranche.
This material is intended only for institutional investors and does not carry all of the independence and disclosure standards of retail debt research reports. In the preparation of this material, the author may have consulted or otherwise discussed the matters referenced herein with one or more of SCM’s trading desks, any of which may have accumulated or otherwise taken a position, long or short, in any of the financial instruments discussed in or related to this material. Further, SCM may act as a market maker or principal dealer and may have proprietary interests that differ or conflict with the recipient hereof, in connection with any financial instrument discussed in or related to this material.
This message, including any attachments or links contained herein, is subject to important disclaimers, conditions, and disclosures regarding Electronic Communications, which you can find at https://portfolio-strategy.apsec.com/sancap-disclaimers-and-disclosures.
Important Disclaimers
Copyright © 2026 Santander US Capital Markets LLC and its affiliates (“SCM”). All rights reserved. SCM is a member of FINRA and SIPC. This material is intended for limited distribution to institutions only and is not publicly available. Any unauthorized use or disclosure is prohibited.
In making this material available, SCM (i) is not providing any advice to the recipient, including, without limitation, any advice as to investment, legal, accounting, tax and financial matters, (ii) is not acting as an advisor or fiduciary in respect of the recipient, (iii) is not making any predictions or projections and (iv) intends that any recipient to which SCM has provided this material is an “institutional investor” (as defined under applicable law and regulation, including FINRA Rule 4512 and that this material will not be disseminated, in whole or part, to any third party by the recipient.
The author of this material is an economist, desk strategist or trader. In the preparation of this material, the author may have consulted or otherwise discussed the matters referenced herein with one or more of SCM’s trading desks, any of which may have accumulated or otherwise taken a position, long or short, in any of the financial instruments discussed in or related to this material. Further, SCM or any of its affiliates may act as a market maker or principal dealer and may have proprietary interests that differ or conflict with the recipient hereof, in connection with any financial instrument discussed in or related to this material.
This material (i) has been prepared for information purposes only and does not constitute a solicitation or an offer to buy or sell any securities, related investments or other financial instruments, (ii) is neither research, a “research report” as commonly understood under the securities laws and regulations promulgated thereunder nor the product of a research department, (iii) or parts thereof may have been obtained from various sources, the reliability of which has not been verified and cannot be guaranteed by SCM, (iv) should not be reproduced or disclosed to any other person, without SCM’s prior consent and (v) is not intended for distribution in any jurisdiction in which its distribution would be prohibited.
In connection with this material, SCM (i) makes no representation or warranties as to the appropriateness or reliance for use in any transaction or as to the permissibility or legality of any financial instrument in any jurisdiction, (ii) believes the information in this material to be reliable, has not independently verified such information and makes no representation, express or implied, with regard to the accuracy or completeness of such information, (iii) accepts no responsibility or liability as to any reliance placed, or investment decision made, on the basis of such information by the recipient and (iv) does not undertake, and disclaims any duty to undertake, to update or to revise the information contained in this material.
Unless otherwise stated, the views, opinions, forecasts, valuations, or estimates contained in this material are those solely of the author, as of the date of publication of this material, and are subject to change without notice. The recipient of this material should make an independent evaluation of this information and make such other investigations as the recipient considers necessary (including obtaining independent financial advice), before transacting in any financial market or instrument discussed in or related to this material.
Important disclaimers for clients in the EU and UK
This publication has been prepared by Trading Desk Strategists within the Sales and Trading functions of Santander US Capital Markets LLC (“SanCap”), the US registered broker-dealer of Santander Corporate & Investment Banking. This communication is distributed in the EEA by Banco Santander S.A., a credit institution registered in Spain and authorised and regulated by the Bank of Spain and the CNMV. Any EEA recipient of this communication that would like to affect any transaction in any security or issuer discussed herein should do so with Banco Santander S.A. or any of its affiliates (together “Santander”). This communication has been distributed in the UK by Banco Santander, S.A.’s London branch, authorised by the Bank of Spain and subject to regulatory oversight on certain matters by the Financial Conduct Authority (FCA) and the Prudential Regulation Authority (PRA).
The publication is intended for exclusive use for Professional Clients and Eligible Counterparties as defined by MiFID II and is not intended for use by retail customers or for any persons or entities in any jurisdictions or country where such distribution or use would be contrary to local law or regulation.
This material is not a product of Santander´s Research Team and does not constitute independent investment research. This is a marketing communication and may contain ¨investment recommendations¨ as defined by the Market Abuse Regulation 596/2014 ("MAR"). This publication has not been prepared in accordance with legal requirements designed to promote the independence of research and is not subject to any prohibition on dealing ahead of the dissemination of investment research. The author, date and time of the production of this publication are as indicated herein.
This publication does not constitute investment advice and may not be relied upon to form an investment decision, nor should it be construed as any offer to sell or issue or invitation to purchase, acquire or subscribe for any instruments referred herein. The publication has been prepared in good faith and based on information Santander considers reliable as of the date of publication, but Santander does not guarantee or represent, express or implied, that such information is accurate or complete. All estimates, forecasts and opinions are current as at the date of this publication and are subject to change without notice. Unless otherwise indicated, Santander does not intend to update this publication. The views and commentary in this publication may not be objective or independent of the interests of the Trading and Sales functions of Santander, who may be active participants in the markets, investments or strategies referred to herein and/or may receive compensation from investment banking and non-investment banking services from entities mentioned herein. Santander may trade as principal, make a market or hold positions in instruments (or related derivatives) and/or hold financial interest in entities discussed herein. Santander may provide market commentary or trading strategies to other clients or engage in transactions which may differ from views expressed herein. Santander may have acted upon the contents of this publication prior to you having received it.
This publication is intended for the exclusive use of the recipient and must not be reproduced, redistributed or transmitted, in whole or in part, without Santander’s consent. The recipient agrees to keep confidential at all times information contained herein.


