


The Long and Short
Playing the Fed’s SMCCF unwind
Meredith Contente and Dan Bruzzo, CFA | June 11, 2021
This document is intended for institutional investors and is not subject to all of the independence and disclosure standards applicable to debt research reports prepared for retail investors. This material does not constitute research.
The Federal Reserve this month announced plans to unwind its $13.77 billion portfolio of corporate ETFs and bonds, and while likely leaving broad spreads unchanged it could put pressure on specific issues and names. In some cases, the Fed holds positions equivalent to nearly 90% of all secondary trading in the issue so far this year, and these issues look vulnerable. Investors holding vulnerable issues have time to trade into close substitutes before Fed selling begins and potentially buy their positions back later at wider spreads.
The Fed started liquidating the Secondary Market Corporate Credit Facility on June 7 beginning with holdings in ETFs. Sales of corporate bonds will start later this summer after the Fed announces further details. The Fed launched the SMCCF on March 23, 2020, to backstop credit markets and support corporate issuers of public debt. It bought both ETFs and individual non-bank investment grade corporate bonds with maturities of five years or less. As of April 30, the SMCCF held $8.56 billion in ETFs and $5.21 billion in corporate bonds.
While the Fed is likely to be cautious as it begins selling positions, specific corporate issues with limited secondary market liquidity could still come under pressure. Investors seeking relative value swap opportunities now could target for sale those issues held by the Fed that have limited float in the secondary market.
A Pressure Score
One way to measure potential selling pressure is to look at the size of the Fed’s current holdings at amortized cost as a percentage of total TRACE trading volume in that individual security year-to-date. This gives a Pressure Score for each individual CUSIP, and it serves as a proxy for the relative difficulty the Fed may have in liquidating each position without having a significantly negative impact on secondary pricing. By targeting securities with the highest Pressure Scores for sale in swap (or selling short), an investor could anticipate the individual issues in the SMCCF most likely to widen on Fed selling. The investor could redeploy proceeds into securities with much lower Pressure Scores that have the market liquidity to withstand the technical pressure of the Fed’s eventual selling.
The Fed holds 33 individual positions with a par value of $184 million in corporate bonds with a Pressure Score of 20% or greater (Exhibit 1). Each of these issues exceed 20% of collective TRACE trading volume in the issue year-to-date. The full list of Fed holdings and respective Pressure Scores is available on request.
Exhibit 1. The Fed holds 33 positions and $184 million in issues with high Pressure Scores
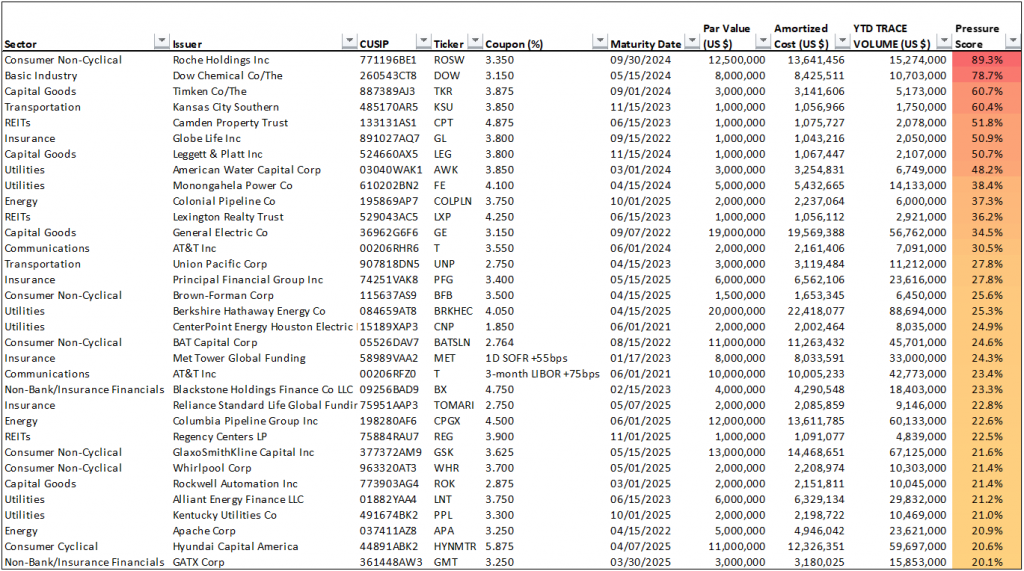
Amortized Cost – Includes all bonds purchased through December 31, 2020, and redemptions, exchanges, or maturities for which proceeds were received on or prior to April 30, 2021.
Source: CreditSights, Bloomberg/TRACE reporting
Investors that want to maintain sector allocation but limit exposure to Fed selling of thin issues may want to reallocate from high Pressure Score issues into low Pressure Score issues within each sector of corporate debt. To better identify swap candidates, the analysis here starts with the Top 5 Pressure Scores in each individual sector. From the Top 5, the analysis looks for comparable buy opportunities with higher relative liquidity but similar duration and risk parameters or spread compensation.
For example, in Basic Industry, the issue with the second highest score matches up well with a prospective swap candidate since the bond with the highest score, DOW 3.15% ’24, was already called. The Fed’s holdings in the PPG 3.20% ’23 represent just under 20% of the total volume in that security traded year-to-date. Comparatively, the Fed’s position in the APD 2.75% ’23 represents just 3.0% of total volume YTD. For each sector that follows we outline a similar swap. Of course, each swap illustrates the possible opportunity. In practice, the performance of each swap depends on availability and market pricing, which could significantly affect the profitability of any trade.
Exhibit 2. Basic Industry: sell PPG 3.2% 3/23, buy APD 2.75% 2/23
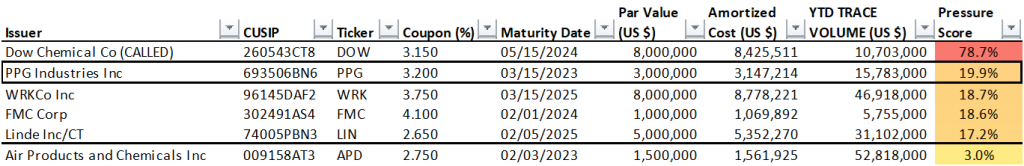
Source: CreditSights, Bloomberg/TRACE reporting
Exhibit 3. Capital Goods: sell TKR 3.875% 9/24, buy OC 4.2% 12/24
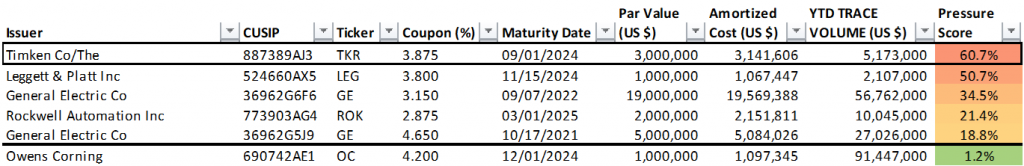
Source: CreditSights, Bloomberg/TRACE reporting
Exhibit 4. Communications: sell T 3.55% 6/24, buy T 4.45% 4/24
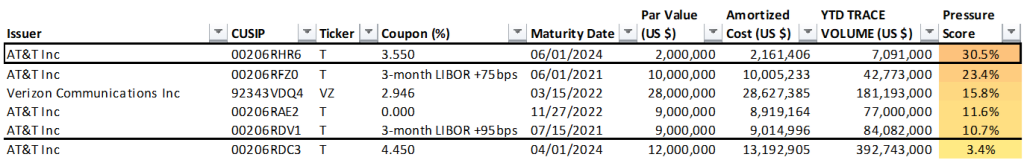
Source: CreditSights, Bloomberg/TRACE reporting
Exhibit 5. Consumer Cyclical: sell HYNMTR 5.875% 4/25, buy GM 6.125% 10/25
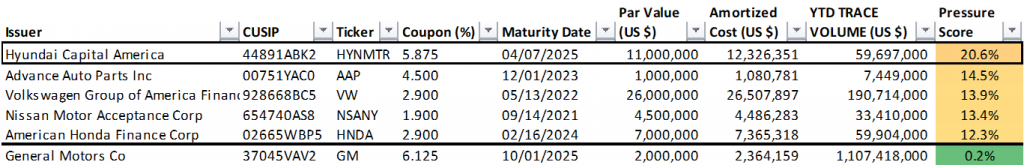
Source: CreditSights, Bloomberg/TRACE reporting
Exhibit 6. Consumer Non-Cyclical: sell ROSW 3.35% 9/24, buy GILD 3.7% 4/24
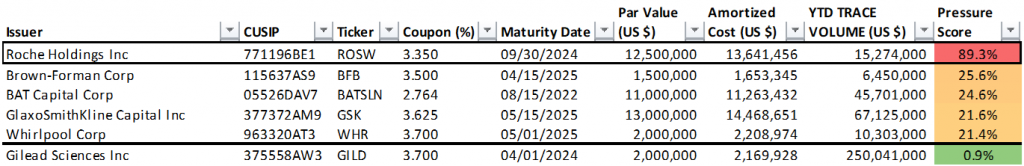
(pick-up in spread, give-up in ratings, stay in same sector)
Source: CreditSights, Bloomberg/TRACE reporting
Exhibit 7. Energy: sell COLPLN 3.75% 10/25, buy MPLX 4.875% 6/25
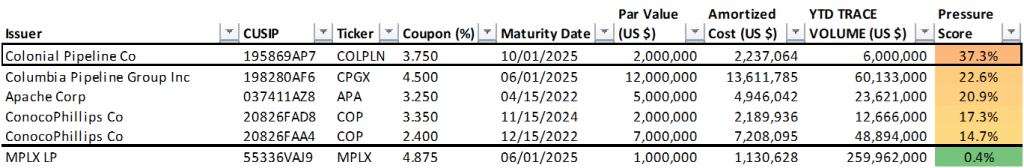
Source: CreditSights, Bloomberg/TRACE reporting
Exhibit 8. Insurance: sell PFG 3.4% 5/25 (unsecured), buy PFG 1.25% 6/25 or 2.25% 11/24 (both secured)
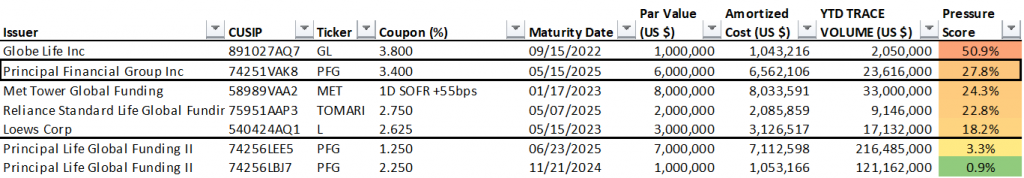
Source: CreditSights, Bloomberg/TRACE reporting
Exhibit 9. Non-Bank/Insurance Financials: sell GMT 3.25% 3/25, buy AMG 3.5% 8/25
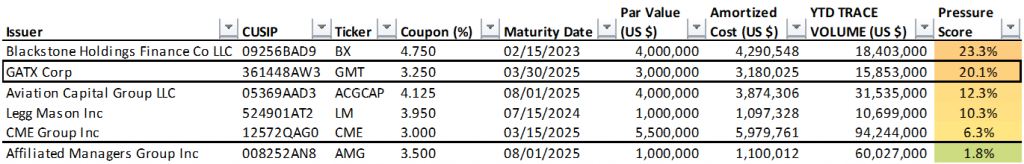
Source: CreditSights, Bloomberg/TRACE reporting
Exhibit 10. REITs: sell CPT 4.875% 6/23, buy SPG 2.75% 6/23
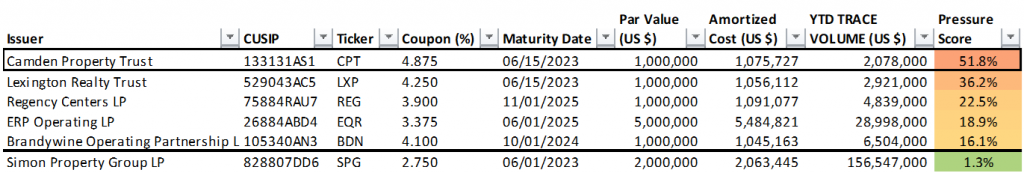
Source: CreditSights, Bloomberg/TRACE reporting
Exhibit 11. Technology: sell GLW 3.7% 11/23, buy ADI 3.125% 12/23
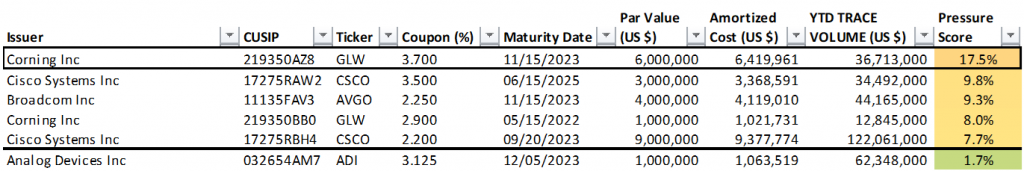
Source: CreditSights, Bloomberg/TRACE reporting
Exhibit 12. Transportation: sell UNP 2.75% 4/23, UNP 3.5% 6/23
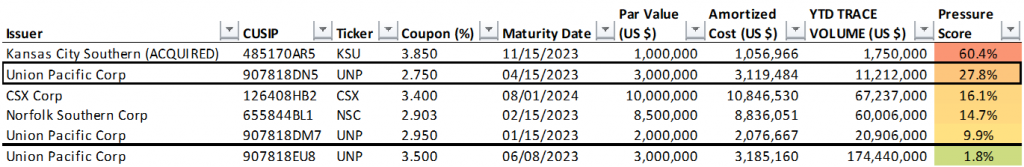
Source: CreditSights, Bloomberg/TRACE reporting
Exhibit 13. Utilities: sell FE 4.1 4/24, buy CNP 3.85% 2/24 or 2.5% 9/24
(reduce coal exposure, give-up in spread)
Source: CreditSights, Bloomberg/TRACE reporting