The Big Idea
Inflation expectations follow the Fed
This material is a Marketing Communication and does not constitute Independent Investment Research.
Inflation has suddenly become the hot topic in financial markets, as the bulge in price hikes while the economy reopens threatens to fundamentally alter the economic landscape. TIPS breakevens offer a real-time window into how investors expect inflation to evolve. A detailed examination of the TIPS breakevens curve suggests that financial market participants are largely on board with the Fed’s narrative that inflation will accelerate for a short time and then return to the 2% target.
TIPS breakevens explained
For those not intimately familiar with the TIPS market, breakeven rates represent, as the name implies, how high inflation would need to be over the term of the inflation-indexed security for a buyer to earn the same return as another investor holding a nominal Treasury security with the same maturity. There are time-varying risk and liquidity premia imbedded in these calculations that present slight complications, but, as a first approximation, TIPS breakeven rates offer a reasonable rough estimate of the inflation rate that investors are anticipating over various time periods.
In terms of TIPS mechanics, the securities are indexed to the headline CPI, and the inflation payout to TIPS holders is slightly lagged. As an example, the TIPS inflation payout for May 2021 would be the CPI reading released in April, which would be the March CPI figure. Since the Fed focuses on the PCE deflator in its inflation targeting, we do have to make an adjustment to translate from the CPI. Over the last 20 years, the CPI has on average run almost three tenths higher than the PCE deflator, a gap that we will need to take account of.
TIPS breakeven yield curve
Bloomberg reports TIPS breakeven rates across various maturities, allowing us to construct a yield curve of inflation expectations. At the moment, with inflation higher than usual, the curve is downward sloping (Exhibit 1). In fact, it slopes modestly downward all the way out to 30 years, a fully inverted curve, though once we move out beyond the first two or three years, the curve is pretty flat.
Exhibit 1: Yield Curve for Breakevens
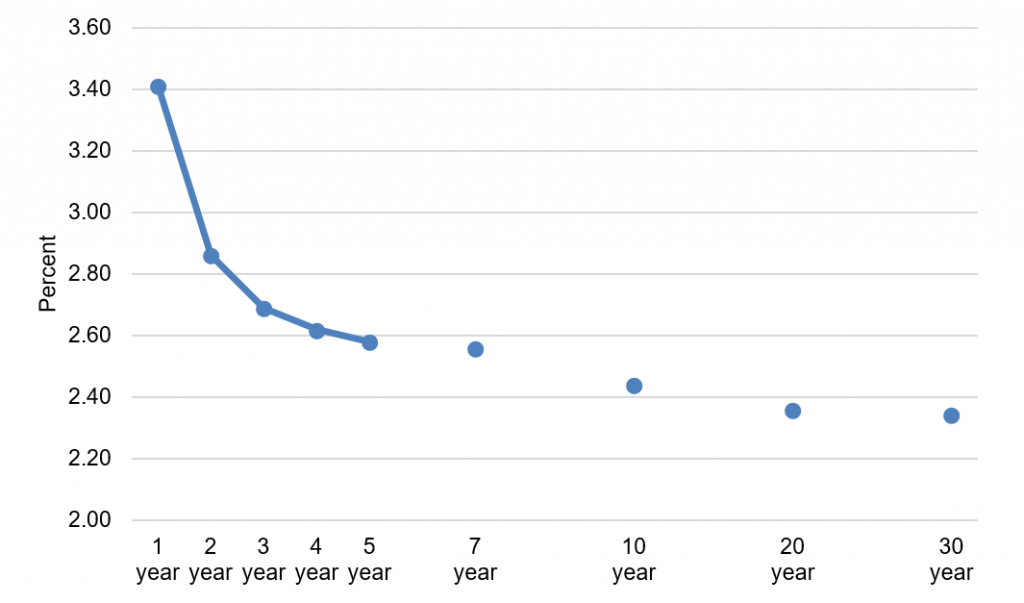
Source: Bloomberg.
We can use these breakeven rates to tease out inflation expectations for specific years. For example, the 1-year breakeven rate is 3.41% and the 2-year breakeven rate is 2.86%. The arithmetic would then dictate that investors must expect inflation of 2.31% in Year 2. We can do these calculations to isolate expectations for given years (Exhibit 2).
Exhibit 2: Implied Inflation Expectations from Breakeven Rates
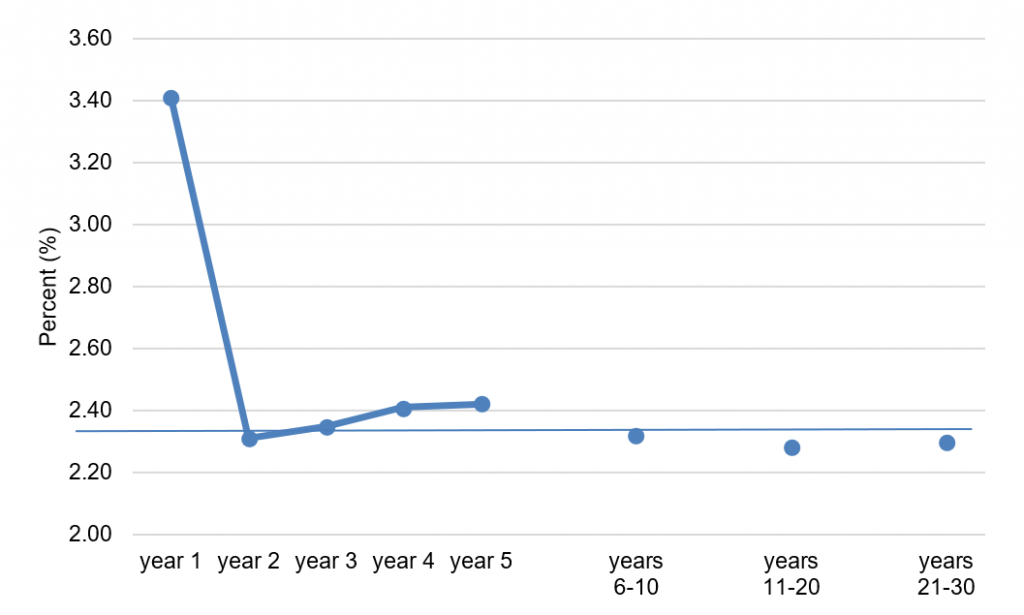
Source: Bloomberg.
Parsing the data in this way, it is evident that investors expect a sharp acceleration in inflation over the next year, followed by a return to roughly 2% inflation forever after. Inflation in Year 1 is expected to be 3.4%. However, in Year 2, the expectation slides to 2.3%, which, when adjusted for the CPI-PCE gap, implies that inflation would be exactly consistent with the Fed’s 2% target. In fact, the implied expectations are within a tenth or so of the magic 2.3% level over the entire 30-year period.
The data point for Year 6 through Year 10 is also known as the 5-year 5-year forward TIPS breakeven rate and is one of the favorite long-term inflation expectations proxies for many Fed officials. It is currently sitting at 2.32%, almost exactly consistently with the Fed’s target.
Assessing the market’s expectations
Based on the lag in the TIPS inflation payout, the breakeven rate for the next 12 months represents a projection of CPI inflation from April 2021 through March 2022. Of course, we already know that the CPI surged by 0.8% in April. Moreover, the consensus expects a 0.4% rise in May, while my forecast calls for a 0.5% advance. Using the consensus projection for May, that’s 1.2 percentage points over two months, which means that the 1-year TIPS breakeven rate implies an advance in the CPI over the 10 months from June through March 2022 of 2.2%, or 0.22% per month, which translates to a roughly 2.3% annualized pace for the PCE deflator over that timeframe.
In essence, the TIPS breakeven curve suggests that investors expect inflation to run slightly above a 2% pace for the next few months and then to settle at roughly a 2% pace (for the core PCE deflator) for the next 30 years.
My own expectation for the next 10 months is not radically different than the TIPS market implies. I expect the year-over-year CPI reading for March 2022 to be about 3.6%, just 15 bp above the breakeven rate. However, I am less optimistic further into the future, as I look for easy fiscal and monetary policy and a robust economy to generate inflation that is well above the Fed’s 2% target in 2022 and beyond, perhaps in the range of 2½% or so for the PCE deflator in 2022 and 2023.
Fed officials as of the March FOMC projections are closer to the TIPS market camp, as the median projection of policymakers called for roughly 2% PCE inflation in both 2022 and 2023.
I would imagine that most FOMC participants would be largely happy with what they see in the TIPS breakeven data. After running below the 2% mark for several years before the pandemic, the Fed has managed to successfully boost inflation expectations to exactly where they should want them. The run-up in TIPS breakeven rates so far is not in any way problematic for the central bank. It will be interesting, however, to see how policymakers react if breakeven rates imply a further acceleration of inflation going forward, especially well out the yield curve. In that case, it would potentially be time for the FOMC to push back. For now, however, it is easy to see why the committee is quite satisfied with what they see.
This material is intended only for institutional investors and does not carry all of the independence and disclosure standards of retail debt research reports. In the preparation of this material, the author may have consulted or otherwise discussed the matters referenced herein with one or more of SCM’s trading desks, any of which may have accumulated or otherwise taken a position, long or short, in any of the financial instruments discussed in or related to this material. Further, SCM may act as a market maker or principal dealer and may have proprietary interests that differ or conflict with the recipient hereof, in connection with any financial instrument discussed in or related to this material.
This message, including any attachments or links contained herein, is subject to important disclaimers, conditions, and disclosures regarding Electronic Communications, which you can find at https://portfolio-strategy.apsec.com/sancap-disclaimers-and-disclosures.
Important Disclaimers
Copyright © 2026 Santander US Capital Markets LLC and its affiliates (“SCM”). All rights reserved. SCM is a member of FINRA and SIPC. This material is intended for limited distribution to institutions only and is not publicly available. Any unauthorized use or disclosure is prohibited.
In making this material available, SCM (i) is not providing any advice to the recipient, including, without limitation, any advice as to investment, legal, accounting, tax and financial matters, (ii) is not acting as an advisor or fiduciary in respect of the recipient, (iii) is not making any predictions or projections and (iv) intends that any recipient to which SCM has provided this material is an “institutional investor” (as defined under applicable law and regulation, including FINRA Rule 4512 and that this material will not be disseminated, in whole or part, to any third party by the recipient.
The author of this material is an economist, desk strategist or trader. In the preparation of this material, the author may have consulted or otherwise discussed the matters referenced herein with one or more of SCM’s trading desks, any of which may have accumulated or otherwise taken a position, long or short, in any of the financial instruments discussed in or related to this material. Further, SCM or any of its affiliates may act as a market maker or principal dealer and may have proprietary interests that differ or conflict with the recipient hereof, in connection with any financial instrument discussed in or related to this material.
This material (i) has been prepared for information purposes only and does not constitute a solicitation or an offer to buy or sell any securities, related investments or other financial instruments, (ii) is neither research, a “research report” as commonly understood under the securities laws and regulations promulgated thereunder nor the product of a research department, (iii) or parts thereof may have been obtained from various sources, the reliability of which has not been verified and cannot be guaranteed by SCM, (iv) should not be reproduced or disclosed to any other person, without SCM’s prior consent and (v) is not intended for distribution in any jurisdiction in which its distribution would be prohibited.
In connection with this material, SCM (i) makes no representation or warranties as to the appropriateness or reliance for use in any transaction or as to the permissibility or legality of any financial instrument in any jurisdiction, (ii) believes the information in this material to be reliable, has not independently verified such information and makes no representation, express or implied, with regard to the accuracy or completeness of such information, (iii) accepts no responsibility or liability as to any reliance placed, or investment decision made, on the basis of such information by the recipient and (iv) does not undertake, and disclaims any duty to undertake, to update or to revise the information contained in this material.
Unless otherwise stated, the views, opinions, forecasts, valuations, or estimates contained in this material are those solely of the author, as of the date of publication of this material, and are subject to change without notice. The recipient of this material should make an independent evaluation of this information and make such other investigations as the recipient considers necessary (including obtaining independent financial advice), before transacting in any financial market or instrument discussed in or related to this material.
Important disclaimers for clients in the EU and UK
This publication has been prepared by Trading Desk Strategists within the Sales and Trading functions of Santander US Capital Markets LLC (“SanCap”), the US registered broker-dealer of Santander Corporate & Investment Banking. This communication is distributed in the EEA by Banco Santander S.A., a credit institution registered in Spain and authorised and regulated by the Bank of Spain and the CNMV. Any EEA recipient of this communication that would like to affect any transaction in any security or issuer discussed herein should do so with Banco Santander S.A. or any of its affiliates (together “Santander”). This communication has been distributed in the UK by Banco Santander, S.A.’s London branch, authorised by the Bank of Spain and subject to regulatory oversight on certain matters by the Financial Conduct Authority (FCA) and the Prudential Regulation Authority (PRA).
The publication is intended for exclusive use for Professional Clients and Eligible Counterparties as defined by MiFID II and is not intended for use by retail customers or for any persons or entities in any jurisdictions or country where such distribution or use would be contrary to local law or regulation.
This material is not a product of Santander´s Research Team and does not constitute independent investment research. This is a marketing communication and may contain ¨investment recommendations¨ as defined by the Market Abuse Regulation 596/2014 ("MAR"). This publication has not been prepared in accordance with legal requirements designed to promote the independence of research and is not subject to any prohibition on dealing ahead of the dissemination of investment research. The author, date and time of the production of this publication are as indicated herein.
This publication does not constitute investment advice and may not be relied upon to form an investment decision, nor should it be construed as any offer to sell or issue or invitation to purchase, acquire or subscribe for any instruments referred herein. The publication has been prepared in good faith and based on information Santander considers reliable as of the date of publication, but Santander does not guarantee or represent, express or implied, that such information is accurate or complete. All estimates, forecasts and opinions are current as at the date of this publication and are subject to change without notice. Unless otherwise indicated, Santander does not intend to update this publication. The views and commentary in this publication may not be objective or independent of the interests of the Trading and Sales functions of Santander, who may be active participants in the markets, investments or strategies referred to herein and/or may receive compensation from investment banking and non-investment banking services from entities mentioned herein. Santander may trade as principal, make a market or hold positions in instruments (or related derivatives) and/or hold financial interest in entities discussed herein. Santander may provide market commentary or trading strategies to other clients or engage in transactions which may differ from views expressed herein. Santander may have acted upon the contents of this publication prior to you having received it.
This publication is intended for the exclusive use of the recipient and must not be reproduced, redistributed or transmitted, in whole or in part, without Santander’s consent. The recipient agrees to keep confidential at all times information contained herein.


