


By the Numbers
A rockin’ dollar roll lowers specified pool pay-ups
Brian Landy, CFA | June 4, 2021
This document is intended for institutional investors and is not subject to all of the independence and disclosure standards applicable to debt research reports prepared for retail investors. This material does not constitute research.
Price premiums for specified pools of MBS have continued to fall over the last few months despite persistent risk of refinancing. Investors generally pay higher premiums for pools that offer prepayment protection when MBS prices increase, mortgage rates fall and refi risk ticks up. But heavy demand for MBS from the Fed is keeping dollar roll financing special, and investors can earn more carry rolling TBA positions than from owning specified pools. This is likely to continue for at least the next few months, although pay-ups should become more volatile as concerns increase about the pace and timing of the Fed’s tapering of MBS purchases.
Pay-ups for specified pools have steadily fallen since peaking last October. For example, LLB pools that have a maximum loan size of $85,000 typically command the largest pay-ups. Pay-ups reached $4-00 for 2.5%s and $2-11 for 2.0%s in October (Exhibit 1). Now they have dropped to $1-17 and $1-00, respectively. Similarly, lower pay-up pools like 100% investor 2.5%s have dropped from a peak of $1-29 to a current pay-up of $0-17. Lately pay-ups across all loan balance, New York and investor specified pools in both the 2.0% and 2.5% coupons have fallen to their 12-month lows.
Exhibit 1. Pay-ups have been falling since the peak last fall.

Note: The data show pay-ups over TBA from the Fannie Mae cash window auctions for six commonly traded categories of specified pools.
Source: Fannie Mae, Amherst Pierpont Securities
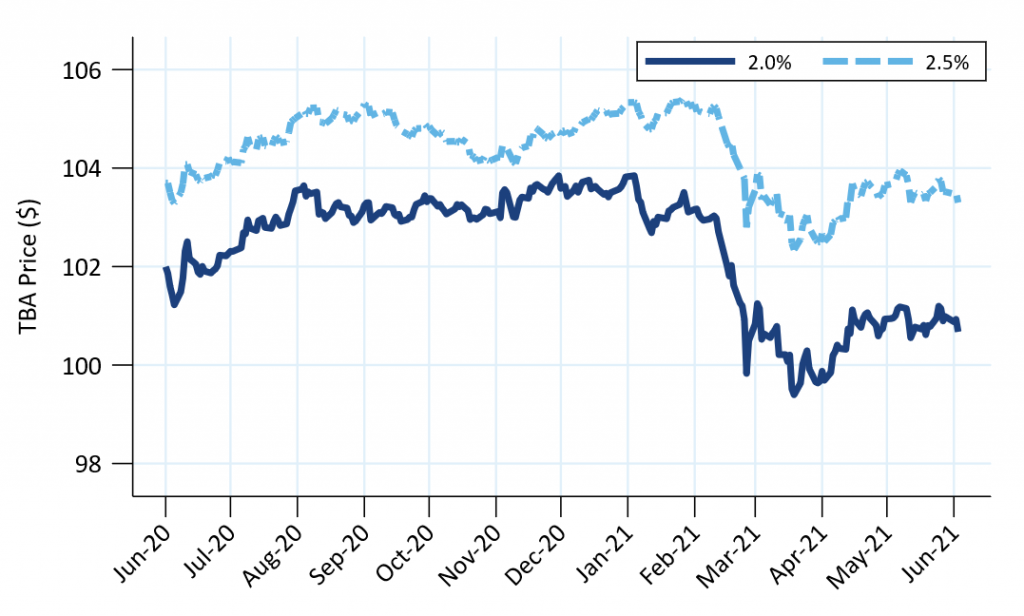
TBA prices have fallen sharply this year, contributing to the lower pay-ups. Prices for 2.0%s and 2.5%s dropped roughly three points from mid-February through mid-March (Exhibit 2). Lower prices cause TBA prepayment speeds to fall since borrowers have less incentive to refinance, and the combination of lower prices and lower speeds narrows the difference in carry between TBA and specified pools. The skinnier carry difference erodes the benefit of buying slower prepaying specified pools, and pay-ups typically decrease when MBS prices fall.
Exhibit 2. TBA prices bounced off their mid-March lows.
Source: Yield Book, Amherst Pierpont Securities
TBA prices have nevertheless rebounded roughly 1 point since early April but specified pool pay-ups have continued to fall. Typically pay-ups should increase along with TBA prices, assuming nothing else changes.
However, the TBA dollar roll has come into play. When demand is heavy for TBAs, the roll can offer special financing that is better than the financing options available to specified pool investors. A special roll narrows the difference in carry between TBA and specified pools, and pay-ups typically fall when the roll is special.
The dollar roll has been special throughout the last year, and specialness has increased steadily since the beginning of April. Investors can currently pick up an additional 2/32s of carry each month by rolling instead of holding pools (Exhibit 3). The Federal Reserve’s demand for MBS is a major reason why rolls are special.
Exhibit 3. Dollar rolls have become more special since the start of April.

Note: The exhibit shows the additional carry a TBA investor gains by rolling their position instead of owning TBA pools.
Source: Yield Book, Amherst Pierpont Securities
The special roll is putting pressure on pay-ups and should continue to do so throughout the summer, assuming the Fed continues to buy MBS at their current pace (Exhibit 4). Carry is calculated over the next three months for various specified pool types using projections from Amherst Pierpont’s unified prepayment model. None of these stories offers better carry than rolling TBA, assuming the rolls offer 2/32s additional carry each month. For example, the 2.5% LLB is projected to prepay at 2.4 CPR and generate 17.9/32s carry. This is more than the 16.7/32s carry from a TBA pool prepaying at 8.5 CPR. However, the special roll boosts the TBA carry to 23.3/32s, which depresses pay-ups.
Exhibit 4. Rolling TBA offers better carry than common specified pools.

Source: Bloomberg, Amherst Pierpont Securities
TBA prices and pay-ups are likely to be more volatile as investors become more concerned with possible Fed tapering. The TBA price incorporates some expectation of future Fed MBS buying and a special roll, which boosts TBA prices. TBA prices should fluctuate as investors adjust expectations about the timing and magnitude of Fed tapering. Specified pool pay-ups should become more volatile along with TBA prices, since the value of specified pools does not depend on the Fed’s demand for TBA pools and expectations of special dollar rolls.