The Long and Short
Strong growth at eBay continues as pandemic ebbs
This material is a Marketing Communication and does not constitute Independent Investment Research.
Online shopping is not a new phenomenon, but the pandemic fueled adoption of digital buying across all generations accelerated the transition away from brick-and-mortar. While traditional brick-and-mortar is not dead, the wind down of the pandemic will not drive people away from the convenience of online marketplaces. Coming off a stellar quarter, EBAY is expected to continue to post solid organic growth as they remain committed to their high BBB ratings and very conservative balance sheet. The company’s debt spreads in the back end of the curve offer a meaningful yield pick-up relative to BBB retail peers Dollar General Corp. (DG – Baa2/BBB) and Lowe’s Cos Inc. (LOW – Baa1/BBB+). There is further room for upside as EBAY’s EBITDA margins are roughly double those at both DG and LOW, with net leverage of 1.1x a full turn better than DG and ahead of LOW by four ticks.
EBAY’s most recent results highlight the continued growth with revenues up 38% and gross merchandise volume (GMV) up 24% year-over-year (ex fx). Although EBAY’s growth is expected to slow, with management guiding for second quarter organic growth in the 8%-10% range, that this is coming off of very strong comps as organic growth was up 21% in the second quarter of 2020 (ex fx).
Exhibit 1. Retail 7-year to 30-year curve (A to BBB)
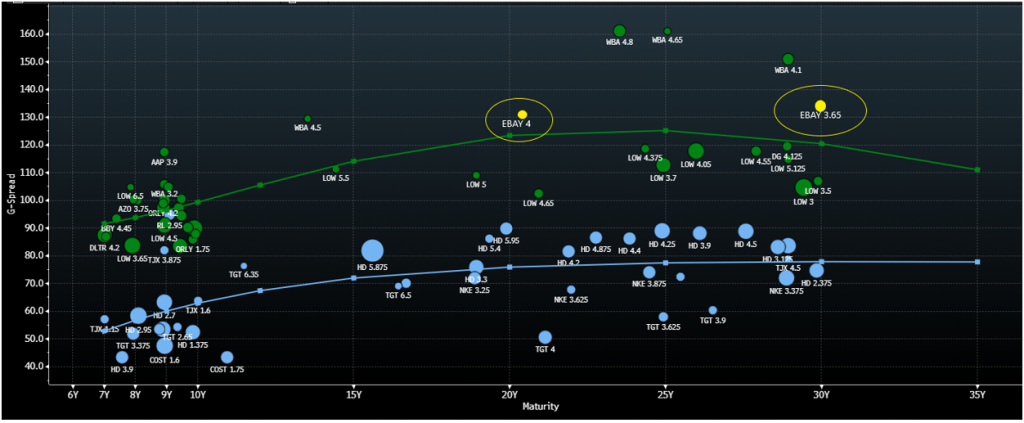
Source: Bloomberg TRACE; Amherst Pierpont Securities
Cash Remains King
EBAY’s balance sheet benefits from its sizeable cash and equivalents position which stood at $3.9 billion at the end of 1Q21. Additionally, EBAY maintains an untapped $2 billion revolver which lends to the company’s overall liquidity position. EBAY has historically kept a large cash position on its balance sheet with the average cash position over the last 5 years totaling $6.5 billion. Management has noted that a strong cash position helps to preserve its financial flexibility which enables the company to execute on its strategies and help drive long term value creation. Looking out, EBAY looks to target a cash balance of $3.5 billion. We note that even its long term cash target of $3.5 billion compares favorably to its retail peers. While DG ended fiscal 2020 with $1.4 billion of cash on hand, its average cash balance over the last 5 years has been closer to $460mm. Additionally, EBAY generates very strong free cash flow which totaled $2.4 billion on a LTM basis, translating to a 21% free cash flow/sales ratio. DG, which has witnessed solid free cash flow growth over the past 12 months due to the pandemic, still has a free cash flow/sales ratio that is roughly 9%, over 10 percentage points below that of EBAY.
Committed to High BBB Ratings
Management highlighted that its capital allocation strategy remains unchanged, which is based upon its commitment to maintaining its current high BBB ratings profile. That said, EBAY continues to target net leverage of 1.5x, while gross leverage is expected to remain below 3.0x. Currently EBAY stands at 1.1x and 2.1x, respectively, on both those leverage targets. We expect management to remain balanced with respect to debt reduction and shareholder rewards. While EBAY currently has $5.7 billion of share repurchase authorization remaining, management demonstrated its balanced approach to the balance sheet in 1Q21 having repaid $940 million of debt while spending $122 million on dividends and $292 million on share repurchases. EBAY’s most recent $2.5 billion debt issuance will be used to repay the $1.75 billion of debt maturing in 2022. The remaining $750 million of debt will increase leverage slightly to the 2.3x area; however, EBITDA is expected to continue to grow this year and leverage should decline back down to the 2.0x area.
Exhibit 2. EBAY Cash & Debt Targets
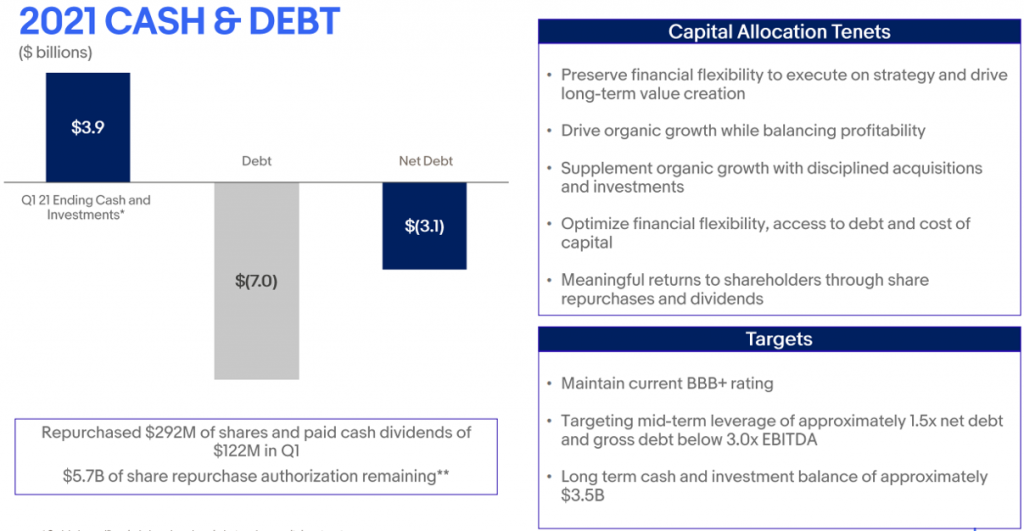
Source: EBAY Company Presentation
Sale of Classifieds Business to Further Strengthen Balance Sheet
EBAY announced the sale of its classifieds business to Adevinta on 7/20/20 for $9.2 billion. According to the deal terms, EBAY is expected to receive $2.5 billion in cash ($2.0 billion net of taxes), as well as Adevinta shares representing a 33% voting stake. While the deal was expected to close by 3/31/21, it was flagged for some competition concerns in the UK. As such, EBAY and Adevinta proposed legally binding solutions to resolve regulatory concerns by the February 2021 regulator deadline. EBAY now expects the deal to close in 2Q21. On EBAY’s last earnings call, management noted that as of the end of April, Adevinta’s share price had appreciated nearly 37% from the transaction announcement, increasing the value of the deal to over $12.7 billion. The delay in deal closing should have no negative impact on EBAY’s ratings or spreads.
This material is intended only for institutional investors and does not carry all of the independence and disclosure standards of retail debt research reports. In the preparation of this material, the author may have consulted or otherwise discussed the matters referenced herein with one or more of SCM’s trading desks, any of which may have accumulated or otherwise taken a position, long or short, in any of the financial instruments discussed in or related to this material. Further, SCM may act as a market maker or principal dealer and may have proprietary interests that differ or conflict with the recipient hereof, in connection with any financial instrument discussed in or related to this material.
This message, including any attachments or links contained herein, is subject to important disclaimers, conditions, and disclosures regarding Electronic Communications, which you can find at https://portfolio-strategy.apsec.com/sancap-disclaimers-and-disclosures.
Important Disclaimers
Copyright © 2026 Santander US Capital Markets LLC and its affiliates (“SCM”). All rights reserved. SCM is a member of FINRA and SIPC. This material is intended for limited distribution to institutions only and is not publicly available. Any unauthorized use or disclosure is prohibited.
In making this material available, SCM (i) is not providing any advice to the recipient, including, without limitation, any advice as to investment, legal, accounting, tax and financial matters, (ii) is not acting as an advisor or fiduciary in respect of the recipient, (iii) is not making any predictions or projections and (iv) intends that any recipient to which SCM has provided this material is an “institutional investor” (as defined under applicable law and regulation, including FINRA Rule 4512 and that this material will not be disseminated, in whole or part, to any third party by the recipient.
The author of this material is an economist, desk strategist or trader. In the preparation of this material, the author may have consulted or otherwise discussed the matters referenced herein with one or more of SCM’s trading desks, any of which may have accumulated or otherwise taken a position, long or short, in any of the financial instruments discussed in or related to this material. Further, SCM or any of its affiliates may act as a market maker or principal dealer and may have proprietary interests that differ or conflict with the recipient hereof, in connection with any financial instrument discussed in or related to this material.
This material (i) has been prepared for information purposes only and does not constitute a solicitation or an offer to buy or sell any securities, related investments or other financial instruments, (ii) is neither research, a “research report” as commonly understood under the securities laws and regulations promulgated thereunder nor the product of a research department, (iii) or parts thereof may have been obtained from various sources, the reliability of which has not been verified and cannot be guaranteed by SCM, (iv) should not be reproduced or disclosed to any other person, without SCM’s prior consent and (v) is not intended for distribution in any jurisdiction in which its distribution would be prohibited.
In connection with this material, SCM (i) makes no representation or warranties as to the appropriateness or reliance for use in any transaction or as to the permissibility or legality of any financial instrument in any jurisdiction, (ii) believes the information in this material to be reliable, has not independently verified such information and makes no representation, express or implied, with regard to the accuracy or completeness of such information, (iii) accepts no responsibility or liability as to any reliance placed, or investment decision made, on the basis of such information by the recipient and (iv) does not undertake, and disclaims any duty to undertake, to update or to revise the information contained in this material.
Unless otherwise stated, the views, opinions, forecasts, valuations, or estimates contained in this material are those solely of the author, as of the date of publication of this material, and are subject to change without notice. The recipient of this material should make an independent evaluation of this information and make such other investigations as the recipient considers necessary (including obtaining independent financial advice), before transacting in any financial market or instrument discussed in or related to this material.
Important disclaimers for clients in the EU and UK
This publication has been prepared by Trading Desk Strategists within the Sales and Trading functions of Santander US Capital Markets LLC (“SanCap”), the US registered broker-dealer of Santander Corporate & Investment Banking. This communication is distributed in the EEA by Banco Santander S.A., a credit institution registered in Spain and authorised and regulated by the Bank of Spain and the CNMV. Any EEA recipient of this communication that would like to affect any transaction in any security or issuer discussed herein should do so with Banco Santander S.A. or any of its affiliates (together “Santander”). This communication has been distributed in the UK by Banco Santander, S.A.’s London branch, authorised by the Bank of Spain and subject to regulatory oversight on certain matters by the Financial Conduct Authority (FCA) and the Prudential Regulation Authority (PRA).
The publication is intended for exclusive use for Professional Clients and Eligible Counterparties as defined by MiFID II and is not intended for use by retail customers or for any persons or entities in any jurisdictions or country where such distribution or use would be contrary to local law or regulation.
This material is not a product of Santander´s Research Team and does not constitute independent investment research. This is a marketing communication and may contain ¨investment recommendations¨ as defined by the Market Abuse Regulation 596/2014 ("MAR"). This publication has not been prepared in accordance with legal requirements designed to promote the independence of research and is not subject to any prohibition on dealing ahead of the dissemination of investment research. The author, date and time of the production of this publication are as indicated herein.
This publication does not constitute investment advice and may not be relied upon to form an investment decision, nor should it be construed as any offer to sell or issue or invitation to purchase, acquire or subscribe for any instruments referred herein. The publication has been prepared in good faith and based on information Santander considers reliable as of the date of publication, but Santander does not guarantee or represent, express or implied, that such information is accurate or complete. All estimates, forecasts and opinions are current as at the date of this publication and are subject to change without notice. Unless otherwise indicated, Santander does not intend to update this publication. The views and commentary in this publication may not be objective or independent of the interests of the Trading and Sales functions of Santander, who may be active participants in the markets, investments or strategies referred to herein and/or may receive compensation from investment banking and non-investment banking services from entities mentioned herein. Santander may trade as principal, make a market or hold positions in instruments (or related derivatives) and/or hold financial interest in entities discussed herein. Santander may provide market commentary or trading strategies to other clients or engage in transactions which may differ from views expressed herein. Santander may have acted upon the contents of this publication prior to you having received it.
This publication is intended for the exclusive use of the recipient and must not be reproduced, redistributed or transmitted, in whole or in part, without Santander’s consent. The recipient agrees to keep confidential at all times information contained herein.


