


The Long and Short
Spring arrives to corporate bond market
Dan Bruzzo, CFA | May 7, 2021
This document is intended for institutional investors and is not subject to all of the independence and disclosure standards applicable to debt research reports prepared for retail investors. This material does not constitute research.
Investment grade corporate bonds delivered their first positive monthly total return of the year (1.11%) in April, as Treasuries recovered and credit largely traded sideways throughout the month. Credit excess return was just 0.16% as investment grade spreads rallied 2 bp on a net basis. Airlines, business development companies (BDCs) and REITs were among the individual top performers, while tobacco, healthcare facilities, and select merger partners delivered some of the weakest performances in the Index.
There are no changes to our sector weighting this month. Current positions reflect expectations for a more rapid global economic recovery in 2021 than the market is currently anticipating. The two graphics below provide a summary of how APS expects sectors within the IG Index to perform for the next several months on an excess return basis (total return net of commensurate UST return). These weightings serve as a proxy for how we recommend that portfolio managers should position their holdings relative to the broad IG corporate bond market.
Exhibit 1 and 2. APS Sector Recommendations for May 2021

Source: Amherst Pierpont, Bloomberg/Barclays US Corp Index

Source: Amherst Pierpont, Bloomberg/Barclays US Corp Index
REITs (0.68% credit return) with 10 bp of net OAS tightening in the month provided the top performance by sector in April. Favorable results were spread across all REIT subgroups, though retail appeared to do the bulk of the heavy lifting with renewed prospects for re-opening the economy. Other top performances in the Index included Finance Companies (0.51%) with continued spread compression among the low BBB business development companies (BDCs) and aircraft lessors. Rounding out the top 5 performances by sector were natural gas (0.49%) and electric utilities (0.44%), as well as broker/asset managers (0.38%). The worst performance in the index was delivered by consumer non-cyclical (-0.24%) as tobacco companies were hard hit by the prospect of new government regulations and a potential ban on menthol and other flavored products. After leading the index in the prior month, communications (-0.11%) provided the second worst performance in April, as there was some pushback on AT&T (T) after last month’s big move and Disney’s (DIS) 1Q21 results and guidance disappointed investors. The rest of the bottom 5 performers were transportation (0.08%)—in large part due to the escalating bidding war between CNRCN and CP for KSU—insurance (0.16%) and technology (0.18%).
The IG new issue calendar largely met expectations with $126 billion in total volume in April. The supply figures dropped -59% from the same month in 2020, as the late March/April push from issuers, backstopped by Fed bond buying programs, fueled extraordinary debt issuance. This year’s haul was led by a tremendous roughly $48 billion in issuance from the big US money center banks exiting their 1Q21 earnings blackout periods. That total included record-setting jumbo launches from Bank of America (BAC) and JP Morgan Chase (JPM) at $15 and $13 billion, respectively. High yield added an impressive $54 billion in total corporate debt issued in April, and 83% increase over the prior year month, that did not benefit from as much Fed support as the IG counterparts. The market is anticipating roughly $150 billion in new IG supply for May.
Exhibit 3. Supply Recap – Record bank deals help drive overall volume to within expectations

Source: Bloomberg LP
Exhibit 4. REIT rally provides a standout performance in April, while tobacco companies were hard hit by new regulations
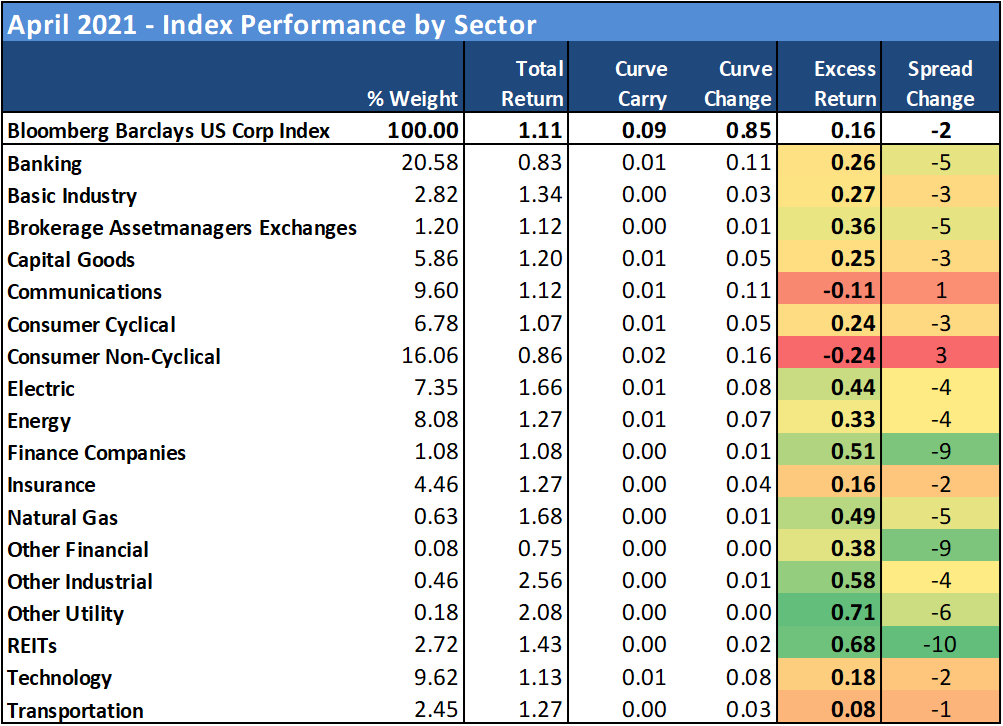
Source: Bloomberg Barclays US Corp Index
Exhibit 5. Credit preference remained mixed as investors continued to target safety of AAs but were not immune to higher beta, low BBB risk

Source: Bloomberg Barclays US Corp Index
Exhibit 6. Spread opportunity in belly of the curve helped drive performance in April

Source: Bloomberg Barclays US Corp Index
Exhibit 7. Airlines, Business Development Companies (BDCs) and REITs among the individual top performers, while Tobacco, Healthcare Facilities, and select merger partners deliver some of the weakest performances in the Index

Source: Bloomberg Barclays US Corp Index
Exhibit 8. Energy and Finance Cos have remained prominent trades YTD

Source: Bloomberg Barclays US Corp Index
Exhibit 9. Investors seeking higher yielding, lower rated credits YTD

Source: Bloomberg Barclays US Corp Index
Exhibit 10. Treasury sell-off YTD has heavily influenced spread performance
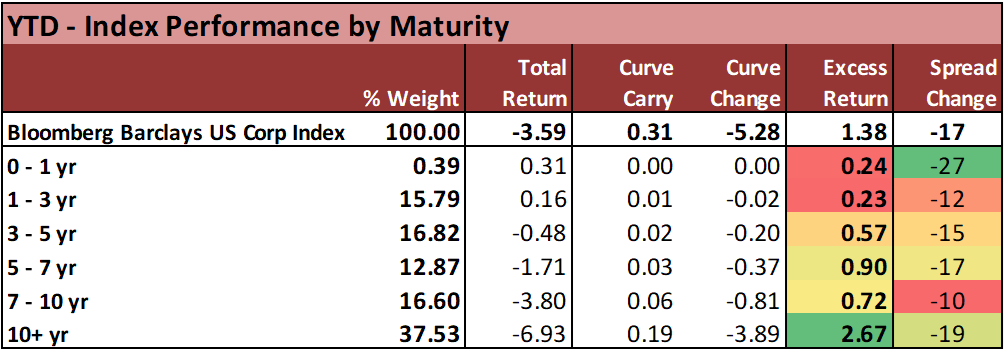
Source: Bloomberg Barclays US Corp Index
Exhibit 11. Airline credits and BDCs remain the top trades of 2021

Source: Bloomberg Barclays US Corp Index