Uncategorized
HTA offers stability amidst a challenged landscape for REITs
admin | April 30, 2021
This material is a Marketing Communication and does not constitute Independent Investment Research.
As the REITs begin reporting their first quarter earnings results, the pandemic-related challenges present across each of the various subgroups continue to impact key operating metrics. There is relative stability offered by medical office buildings (MOBs) versus other property types held by the broader healthcare REITs, and the largest operator of these properties – Healthcare Trust of America (HTA). Although HTA does not report 1Q21 results until May 7, investors should anticipate a continuation of stable cash flows, high percentage of rent collections, and a high relative occupancy to the rest of the healthcare REIT peer group.
Exhibit 1. HTA vs Healthcare REITs – Although spreads are optically tight, HTA presents a defensive opportunity amidst a challenged landscape for the broader REIT sector
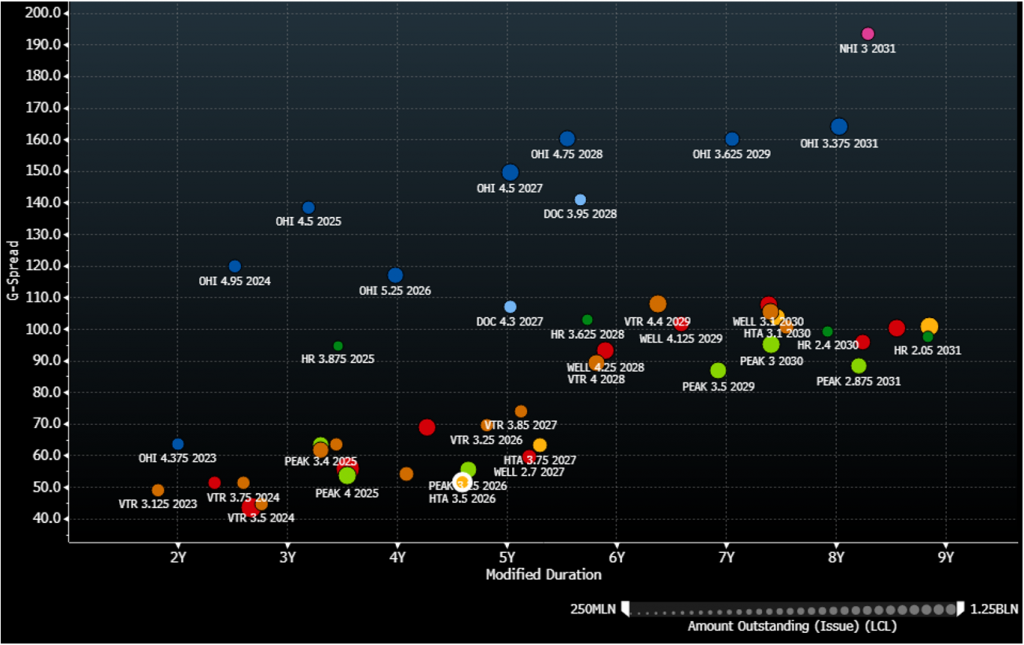
Source: Bloomberg/TRACE – BVAL Indications Only
Bond recommendation
HTA 3.5% 8/1/26 @ +50/5YR; G+48; 1.37%; $110.28
Issuer: Healthcare Trust of America Holdings LP (HTA)
CUSIP: 42225UAD6
Amount outstanding: $600 million
Senior debt rating: Baa2/BBB
Global Deal
Market analysis
- HTA is the nation’s largest operator of medical office buildings (MOBs), which represent roughly 95% of the properties in its portfolio. The company reported $5.7 billion in net real estate property as of year-end 2020, with $7.5 billion in gross investments. At year-end HTA had 469 properties representing over 25 million square feet of commercial space.
- The company is extremely well-diversified geographically and by tenant. No single tenant represents more than 4% of rents. The company operates predominantly in metropolitan areas, spread out across over 30 states in the Southwest, Southeast, Northeast and Midwest. No single market represents more than 10% of total rents. Approximately two thirds of its properties are located on a hospital or medical center campus. HTA’s top 3 markets are Dallas, Houston and Boston.
- HTA’s occupancy rate stood at 89.1% as of year-end 2020, down only marginally from 89.9% at the prior year-end. For full-year 2020, the company collected 99% of total monthly rents, which includes the impact of deferred charges. By comparison, peers such as Welltower (WELL: Baa1/BBB+) with larger components of senior housing in their portfolios have seen occupancy dip down into the mid-70s% range in recent quarters.
HTA’s liquidity profile appears very solid. The company has $115 million of cash on the balance sheet, plus its entire $500 million credit facility available through 2022. There are no public debt maturities until 2026, and just $900 million in loan maturities in 2023-2024. HTA’s last trip to the public debt market was in September of last year ($800 million 10-year notes), which it used the bulk of the proceeds to retire maturing debt. Perhaps most importantly, HTA utilizes only a minimal amount of secured debt (<1% of assets) as most of its properties are currently unencumbered, leaving it plenty of opportunity to generate capital if necessary.
This material is intended only for institutional investors and does not carry all of the independence and disclosure standards of retail debt research reports. In the preparation of this material, the author may have consulted or otherwise discussed the matters referenced herein with one or more of SCM’s trading desks, any of which may have accumulated or otherwise taken a position, long or short, in any of the financial instruments discussed in or related to this material. Further, SCM may act as a market maker or principal dealer and may have proprietary interests that differ or conflict with the recipient hereof, in connection with any financial instrument discussed in or related to this material.
This message, including any attachments or links contained herein, is subject to important disclaimers, conditions, and disclosures regarding Electronic Communications, which you can find at https://portfolio-strategy.apsec.com/sancap-disclaimers-and-disclosures.
Important Disclaimers
Copyright © 2026 Santander US Capital Markets LLC and its affiliates (“SCM”). All rights reserved. SCM is a member of FINRA and SIPC. This material is intended for limited distribution to institutions only and is not publicly available. Any unauthorized use or disclosure is prohibited.
In making this material available, SCM (i) is not providing any advice to the recipient, including, without limitation, any advice as to investment, legal, accounting, tax and financial matters, (ii) is not acting as an advisor or fiduciary in respect of the recipient, (iii) is not making any predictions or projections and (iv) intends that any recipient to which SCM has provided this material is an “institutional investor” (as defined under applicable law and regulation, including FINRA Rule 4512 and that this material will not be disseminated, in whole or part, to any third party by the recipient.
The author of this material is an economist, desk strategist or trader. In the preparation of this material, the author may have consulted or otherwise discussed the matters referenced herein with one or more of SCM’s trading desks, any of which may have accumulated or otherwise taken a position, long or short, in any of the financial instruments discussed in or related to this material. Further, SCM or any of its affiliates may act as a market maker or principal dealer and may have proprietary interests that differ or conflict with the recipient hereof, in connection with any financial instrument discussed in or related to this material.
This material (i) has been prepared for information purposes only and does not constitute a solicitation or an offer to buy or sell any securities, related investments or other financial instruments, (ii) is neither research, a “research report” as commonly understood under the securities laws and regulations promulgated thereunder nor the product of a research department, (iii) or parts thereof may have been obtained from various sources, the reliability of which has not been verified and cannot be guaranteed by SCM, (iv) should not be reproduced or disclosed to any other person, without SCM’s prior consent and (v) is not intended for distribution in any jurisdiction in which its distribution would be prohibited.
In connection with this material, SCM (i) makes no representation or warranties as to the appropriateness or reliance for use in any transaction or as to the permissibility or legality of any financial instrument in any jurisdiction, (ii) believes the information in this material to be reliable, has not independently verified such information and makes no representation, express or implied, with regard to the accuracy or completeness of such information, (iii) accepts no responsibility or liability as to any reliance placed, or investment decision made, on the basis of such information by the recipient and (iv) does not undertake, and disclaims any duty to undertake, to update or to revise the information contained in this material.
Unless otherwise stated, the views, opinions, forecasts, valuations, or estimates contained in this material are those solely of the author, as of the date of publication of this material, and are subject to change without notice. The recipient of this material should make an independent evaluation of this information and make such other investigations as the recipient considers necessary (including obtaining independent financial advice), before transacting in any financial market or instrument discussed in or related to this material.
Important disclaimers for clients in the EU and UK
This publication has been prepared by Trading Desk Strategists within the Sales and Trading functions of Santander US Capital Markets LLC (“SanCap”), the US registered broker-dealer of Santander Corporate & Investment Banking. This communication is distributed in the EEA by Banco Santander S.A., a credit institution registered in Spain and authorised and regulated by the Bank of Spain and the CNMV. Any EEA recipient of this communication that would like to affect any transaction in any security or issuer discussed herein should do so with Banco Santander S.A. or any of its affiliates (together “Santander”). This communication has been distributed in the UK by Banco Santander, S.A.’s London branch, authorised by the Bank of Spain and subject to regulatory oversight on certain matters by the Financial Conduct Authority (FCA) and the Prudential Regulation Authority (PRA).
The publication is intended for exclusive use for Professional Clients and Eligible Counterparties as defined by MiFID II and is not intended for use by retail customers or for any persons or entities in any jurisdictions or country where such distribution or use would be contrary to local law or regulation.
This material is not a product of Santander´s Research Team and does not constitute independent investment research. This is a marketing communication and may contain ¨investment recommendations¨ as defined by the Market Abuse Regulation 596/2014 ("MAR"). This publication has not been prepared in accordance with legal requirements designed to promote the independence of research and is not subject to any prohibition on dealing ahead of the dissemination of investment research. The author, date and time of the production of this publication are as indicated herein.
This publication does not constitute investment advice and may not be relied upon to form an investment decision, nor should it be construed as any offer to sell or issue or invitation to purchase, acquire or subscribe for any instruments referred herein. The publication has been prepared in good faith and based on information Santander considers reliable as of the date of publication, but Santander does not guarantee or represent, express or implied, that such information is accurate or complete. All estimates, forecasts and opinions are current as at the date of this publication and are subject to change without notice. Unless otherwise indicated, Santander does not intend to update this publication. The views and commentary in this publication may not be objective or independent of the interests of the Trading and Sales functions of Santander, who may be active participants in the markets, investments or strategies referred to herein and/or may receive compensation from investment banking and non-investment banking services from entities mentioned herein. Santander may trade as principal, make a market or hold positions in instruments (or related derivatives) and/or hold financial interest in entities discussed herein. Santander may provide market commentary or trading strategies to other clients or engage in transactions which may differ from views expressed herein. Santander may have acted upon the contents of this publication prior to you having received it.
This publication is intended for the exclusive use of the recipient and must not be reproduced, redistributed or transmitted, in whole or in part, without Santander’s consent. The recipient agrees to keep confidential at all times information contained herein.


