


Uncategorized
Capital markets rush hour
admin | April 30, 2021
This material is a Marketing Communication and does not constitute Independent Investment Research.
Most traffic in the capital markets seems to be heading one way for now. Primary dealer inventories have dropped $131 billion since late February, or more than a third, with Treasury debt and MBS balances leading the way. It is most likely a sign of steady net demand for investable assets. The Fed, banks, insurers and funds are clearing inventory faster than dealers can restock. The strongest demand is for the safest and most liquid assets. Welcome to rush hour in capital markets.
Primary dealer net Treasury positions have dropped $112 billion or 45% since their local February 24 peak with net MBS positions down $19 billion or 21% (Exhibit 1), Positions in every other asset except state and municipal debt have dropped, too. But the routinely sizable positions in Treasury debt and MBS dominate the picture.
Exhibit 1: Treasury debt and MBS have led dealer positions lower since Feb
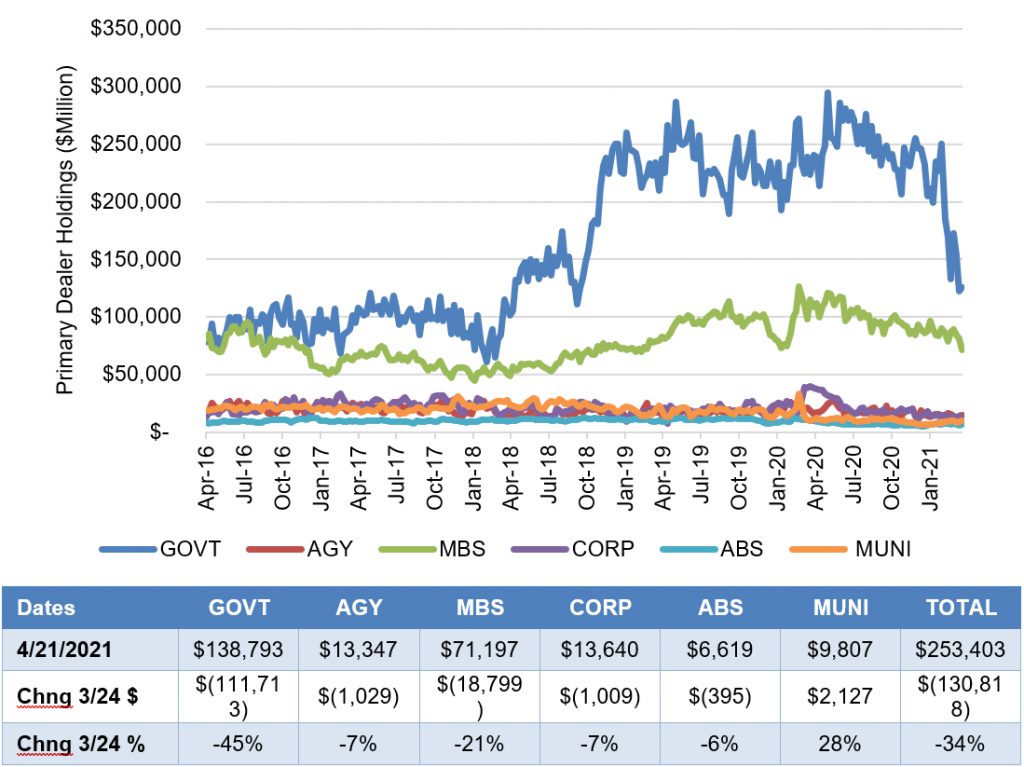
Source: FRB New York, Bloomberg, Amherst Pierpont Securities
Even within most asset classes, positions across the board have dropped (Exhibit 2). Positions all along the Treasury curve and across the TIPS market have dropped, except for TIPS with the longest maturities. Balances in all sectors of MBS have dropped, except for agency CMBS. Corporate positions have dropped, except for commercial paper and the longest high yield debt. All categories of ABS have dropped. Agency and muni debt are mixed.
Exhibit 2: Dealer positions in most segments of fixed income have dropped
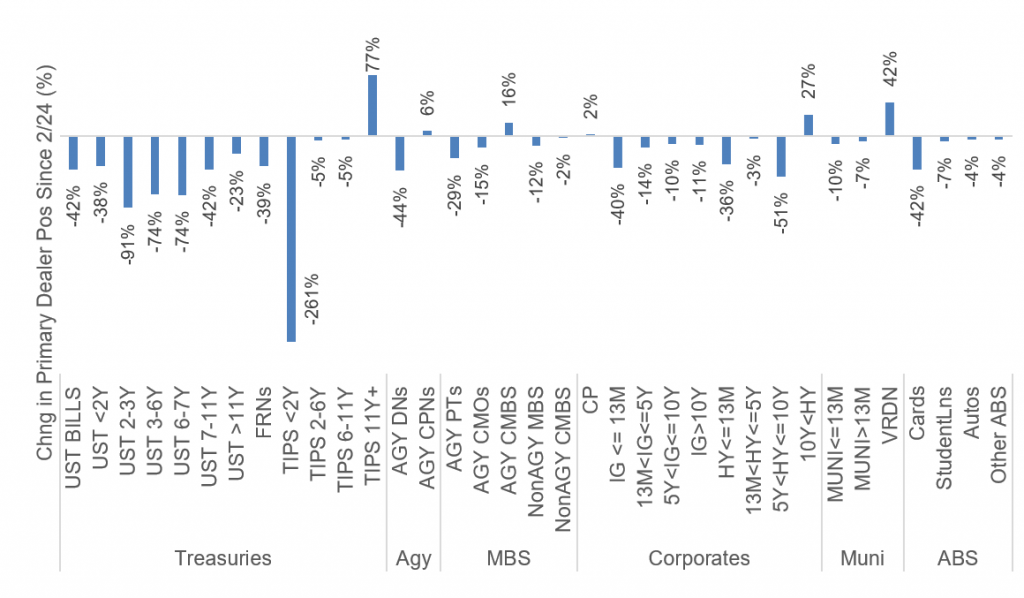
Source: FRB New York, Bloomberg, Amherst Pierpont Securities
Likely a sign of investor demand, not dealer
The drop in positions most likely reflects investor demand more than dealer balance sheet preference. Either one in theory could drive inventory and pricing. Strong net buying could leave inventory thin and spreads tighter while net selling could push inventory up and spreads wider. Alternatively, dealer decisions to hold less inventory could force investors to improve bids and tighten spreads while more inventory could allow investors to lower bids and widen spreads. The correspondence between dealer asset balances and asset price is hard to show in Treasury debt, easier to show in spread assets and very clear in the relatively liquid MBS market (Exhibit 3). With occasional exceptions, heavier primary dealer positions in MBS correspond with wider MBS spreads and lighter MBS positions correspond with tighter MBS spreads.
Exhibit 3: Changing MBS spreads align over time with changing dealer balances
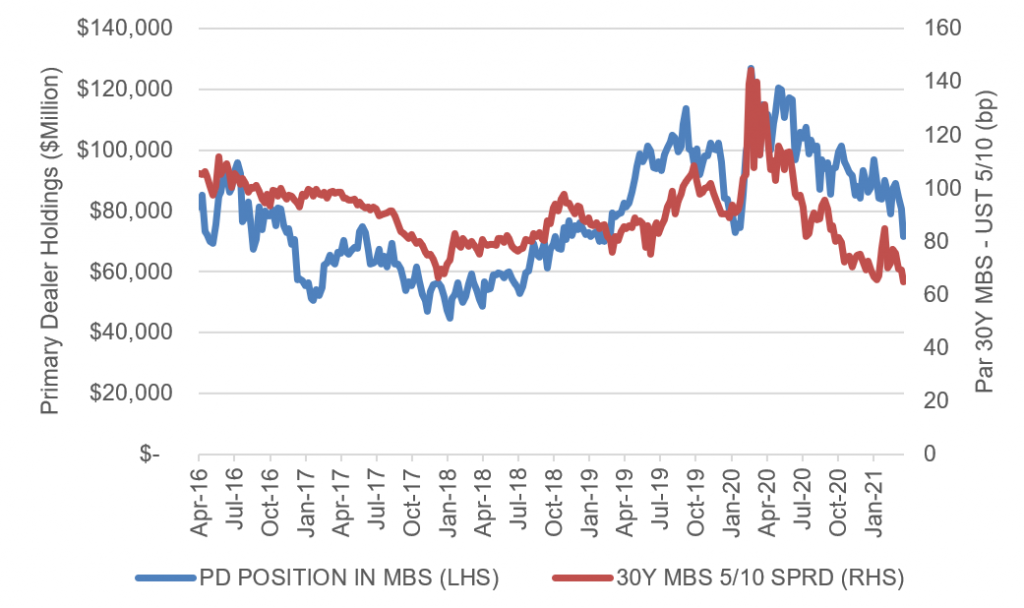
Source: FRB New York, Bloomberg, Amherst Pierpont Securities
A simple test for Grainger causality points to spreads and net investor demand as the driver of dealer balances rather than vice versa. G-causality in this instance asks whether past changes in MBS spreads help explain current changes in dealer MBS balances, or whether past changes in balances help explain current changes in spreads. The past can cause the future, but not the other way around. The analysis suggests past changes in spreads are significant predictors of current balances, and past changes in balance are insignificant predictors of current spreads (Exhibit 4). Net demand and spreads likely drive balances rather than the other way around.
Exhibit 4: Trailing changes in MBS spreads significantly predict current changes in primary dealer MBS positions…
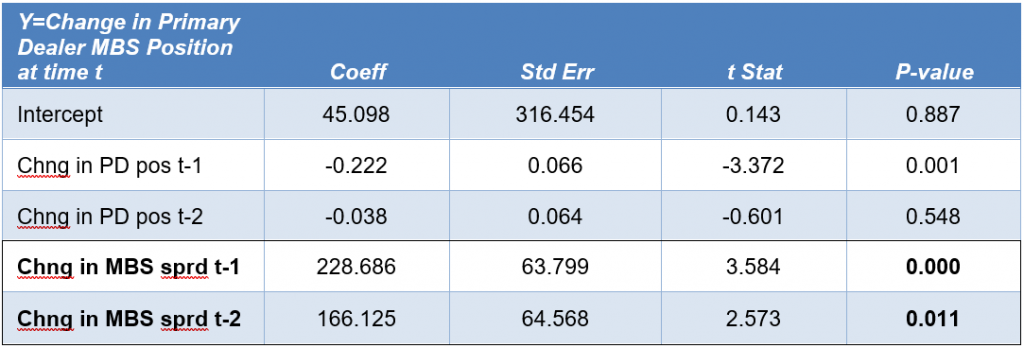
While trailing changes in dealer positions do not significantly predict current changes in MBS spreads
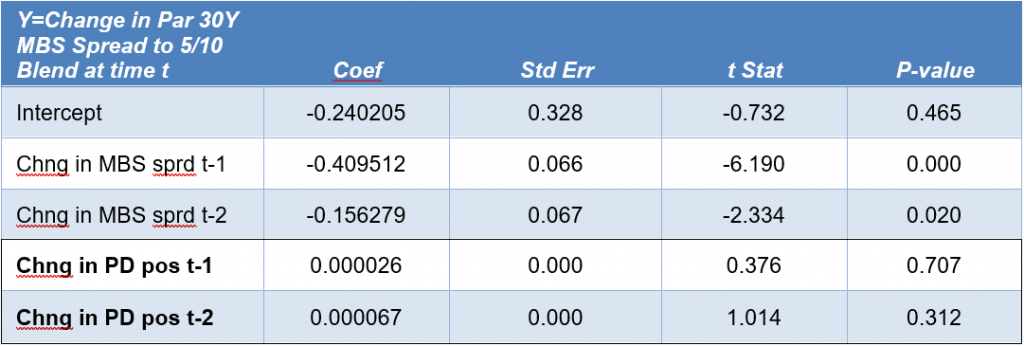
Note: Data include weekly observations of primary dealer MBS balances and par 30-year MBS spreads to the 5/10 Treasury yield blend from 4/27/16 to 4/14/21. All analysis on weekly changes. Summary results for Regression of Change in Primary Dealer Position in MBS: r-square = 0.07, F = 4.7, p-value = .001, obs = 257. Summary results for Regression of Change in Par 30Y MBS Spread to 5/10 Blend:: r-square = 0.145, F = 10.7, p-value < 0.001, obs = 257.
Source: Amherst Pierpont Securities.
Dealers again find themselves in a familiar position: light on inventory at a time of strong net demand and tightening spreads. And if past is prologue, dealers eventually will find themselves with rising inventory at a time of flagging demand and widening spreads. Dealers spread exposure looks negatively convex: light on absolute spread duration just when you want it the most and heavy on spread duration just when you want it the least.
The Fed along with banks struggling to invest deposits, insurers growing with the rebound in the US economy and mutual funds and ETF seeing steady inflows continue to need investable assets. Dealer inventories look likely to remain thin.
Signs of demand steadily outstripping supply keep raising the stakes for the Fed’s eventual exit from QE. Beyond reducing Fed demand, the slowdown or reversal in deposit growth should do the same with bank demand. Insurer and money manager demand may continue, but those investors are a fraction of the Fed and bank bid. The market may eventually see another rush hour. In the opposite direction.
* * *
The view in rates
Overnight Treasury repo has flirted with negative rates lately and SOFR remains at 1 bp, its mark almost every day since March 11. Heavy cash balances across the financial system continue to keep money rates pinned.
The 10-year note has finished the most recent session at 1.63%, up 7 bp from a week before. Rates have become a battle between rising inflation expectations and falling real rates. The term structure of inflation expectations has continued to flatter with 5-year breakevens at 259 bp, 10-year breakevens moving up sharply to 241 bp and 5-year breakevens 5-years forward still elevated at 225 bp. Real rates, meanwhile, continue to fall suggesting some doubts in the rates markets about long-term growth and its ability to absorb the overhang of liquidity.
The Treasury yield curve has finished its most recent session with 2s10s at 146 bp, roughly flat to mid-March. The 5s30s curve has finished at 145 bp, flatter by nearly 20 bp since mid-March. Although 10-year and longer rates have potential to rise back toward 2.0% if growth comes in well above consensus, most of the action should come on the shorter end of the curve as the market reprices the Fed’s response to growth, inflation and employment rather than the fundamentals themselves.
The view in spreads
After the softness in spreads following February’s sharp rise in rates, the tightening of MBS spreads suggests banks are slowly getting back to the business of buying. Add steady Fed buying and a slowing of new MBS origination as primary mortgage rates rise, and it’s a recipe for tighter spreads. Steady buying by banks and the Fed should keep spread tight and the dollar roll in MBS special. The nominal spread between par 30-year MBS and the interpolated 7.5-year Treasury yield closed recently at 60 bp, the tightest level in MBS market history.
In credit, support from insurers and money managers should keep spreads tightening. The latest $1.9 trillion round of fiscal stimulus, easy monetary policy and a narrowing pandemic has already started showing up in the economic numbers. Major gains in employment are likely the next phase. Weaker credits should outperform stronger credits, with high yield topping investment grade debt and both topping safe assets such as agency MBS and Treasury debt. The consumer balance sheets has come out of 2020 stronger than ever—at least on average—and consumer credit should outperform corporate credit.
The big risk to spreads should come when the Fed starts making noise about approaching its targets for employment and inflation and tapering asset purchases. Keep those antennae tuned.
The view in credit
By the end of 2021, US GDP could be above levels projected before Covid for late 2021. That would represent one of the fastest and strongest rebounds from recession in US history. Consumers continue to show great strength. Aggregate savings are up, home values are up and investment portfolios are up. Consumers have not added much debt. Although there is an underlying distribution of haves and have nots, the aggregate consumer balance sheet is strong. Corporate balance sheets have taken on substantial amounts of debt and will need earnings to rebound for either debt-to-EBITDA or EBITDA-to-interest-expense to drop back to better levels. But strong economic growth in 2021 and 2022 should lift most EBITDA and continue easing credit concerns. Eventually, rising interest expense should compete with EBITDA growth. But not yet.