Uncategorized
T-Mobile leverage to fall below investment grade peers
admin | April 23, 2021
This material is a Marketing Communication and does not constitute Independent Investment Research.
T-Mobile US Inc (TMUS) has the ability to outperform investment grade peers as the company is targeting net leverage of mid-2.0x by year-end 2022. The C-Band spectrum auction saw both Verizon Communications (VZ) and AT&T Corp. (T) aggressively spend, pushing out leverage reduction by a couple of years, while estimates are that TMUS’ net leverage will be below that of VZ and T by the end of 2022. TMUS management anticipates unsecured ratings will be upgraded to investment grade sometime in 2023. Over that time, TMUS spreads could outperform peers as it remains in debt reduction mode. Synergy capture from the Sprint merger recently increased, pushing EBITDA higher at a faster rate and lowering leverage. Investors looking for both yield and duration should consider TMUS 3.6% 2061 bonds, which could collapse closer to VZ.
Exhibit 1. 30yr+ Wireless BBB Curve
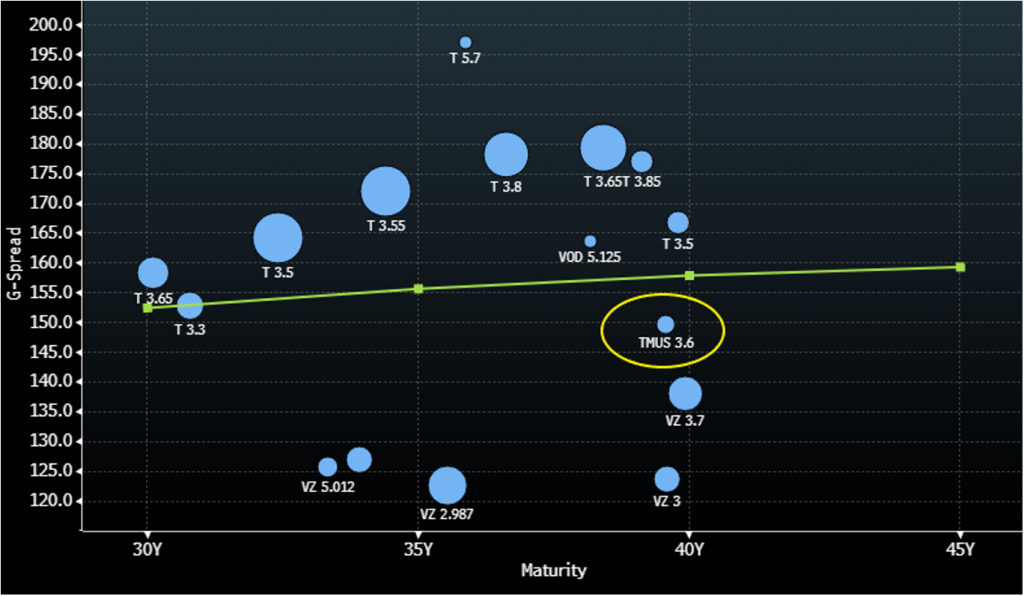
Source: Bloomberg TRACE; Amherst Pierpont Securities
Leverage Reduction Should Prompt Upgrade
With a mid-2.0x net leverage target expected to be achieved by next year, TMUS is putting itself in a position for unsecured ratings to be upgraded to Investment Grade after achieving its leverage target. At that time, TMUS’ net leverage is likely to be lower than that of both VZ and T. Both VZ and T pushed their leverage targets down the road as they spent $45 billion and $23 billion, respectively, in the most recent C-Band spectrum auction to fuel their 5G network capacity and catch up with TMUS’ 5G coverage. While TMUS’ net leverage is expected to hit 3.2x this year, the company is looking for leverage to decline by approximately seven ticks by year end 2022. Net leverage at both VZ and T is expected to hover closer to 3.0x area in 2022 before seeing some decline into the high 2.0x range by 2023.
5G Coverage Superior to Peers
TMUS is arguably the leader in the 5G race which enabled them to spend more conservatively in the spectrum auction relative to peers. We note that TMUS spent just over $9.0 billion in selective markets. Currently, TMUS’ 5G network covers 1.6mm square miles and a total of 287mm POPs. Additionally, TMUS’ Ultra capacity 5G network covers 125mm POPs. This compares very favorably to both VZ and T whose 5G networks cover 233mm and 231mm POPs, respectively. Not only is TMUS’ coverage much better, but it maintains the fastest download speeds on its network. As the pandemic winds down with the vaccine rollout, the ability to work remotely will likely become a permanent change. Download speeds will continue to play a factor as customers choose a wireless carrier. According to a 3rd party study, TMUS outpaced both its peers with a download speed of 81Mbps through February 2021. VZ was the lowest on the totem pole with a download speed of 66Mbps while T was at 77Mbps.
Exhibit 2. TMUS 5G Coverage
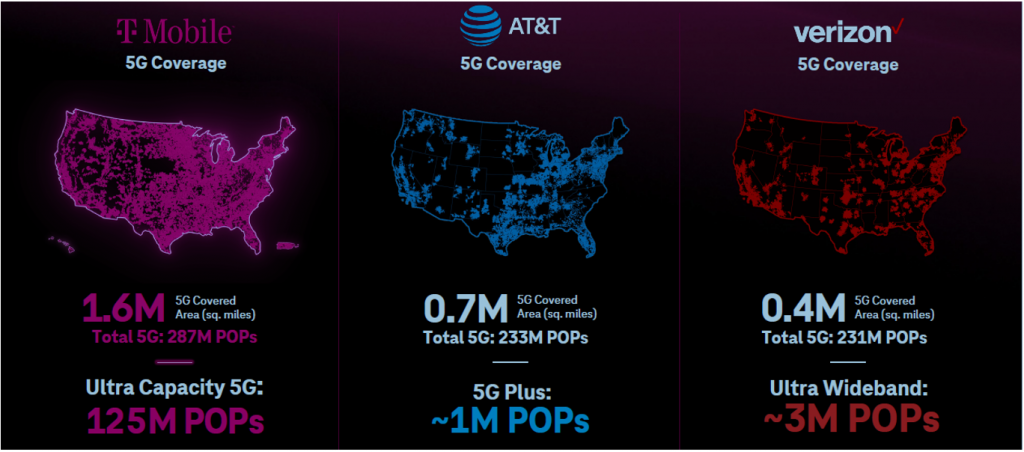
Source: TMUS Analyst Day Presentation
Outpacing Synergy Targets
TMUS not only outpaced their synergy targets for 2020 but also increased its synergy target for 2021. Management’s original merger plan called for $300 million of synergies in 2020, however TMUS was able to deliver a synergy rate 4x higher than its original expectations. The largest savings came from SG&A which produced $600 million of savings in 2020. For 2021, TMUS’ synergy plan is now calling for synergies in the $2.7 billion-$3.0 billion range, which is up from original guidance of $2.5 billion. While the company includes avoided costs as part of their synergy guidance, we note that cost of sales and SG&A is expected to produce synergies in the range of $1.7 billion-$2.0 billion in 2021. Given the outperformance on the synergy front, management now expects total run-rate synergies of $7.5 billion by 2024. This is up 25% from its original run-rate synergy target of $6 billion. Additionally, management noted that they now expect to exceed the original $6 billion sometime in 2023. The faster pace and increased run rate translates to a new net present value of over $60 billion for shareholders, more than 40% higher than the original expectation of $43 billion.
Exhibit 3. Update Synergy Outlook
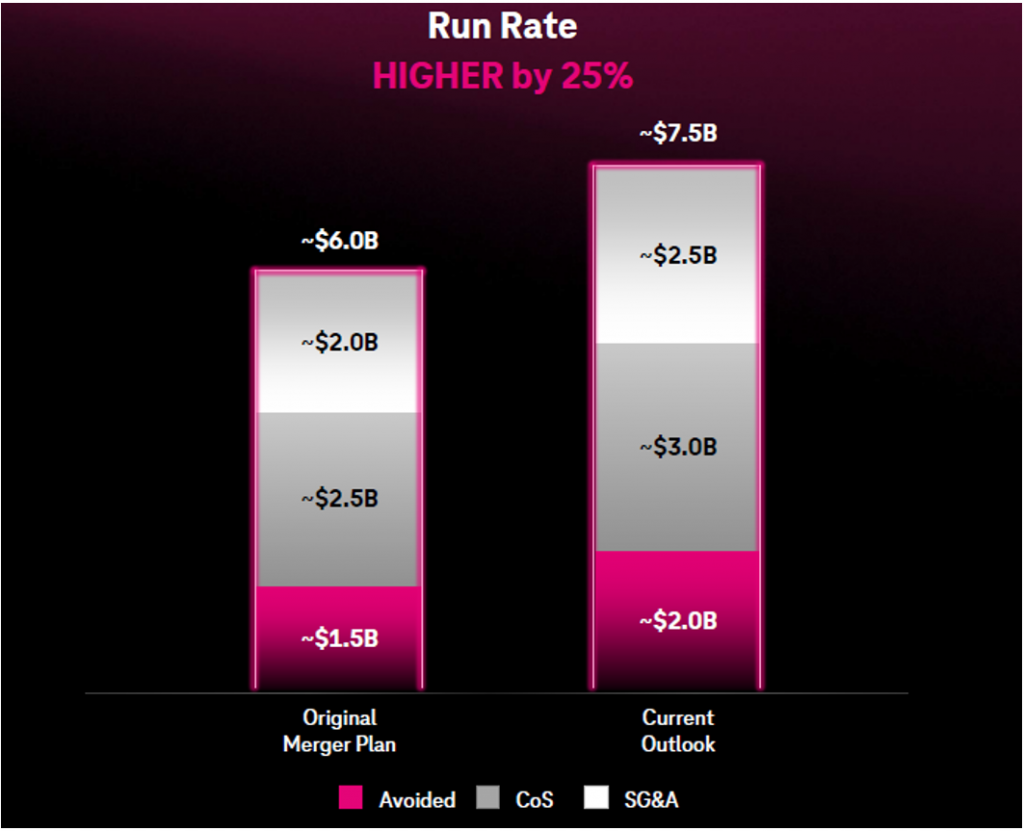
Source: TMUS Analyst Day Presentation
This material is intended only for institutional investors and does not carry all of the independence and disclosure standards of retail debt research reports. In the preparation of this material, the author may have consulted or otherwise discussed the matters referenced herein with one or more of SCM’s trading desks, any of which may have accumulated or otherwise taken a position, long or short, in any of the financial instruments discussed in or related to this material. Further, SCM may act as a market maker or principal dealer and may have proprietary interests that differ or conflict with the recipient hereof, in connection with any financial instrument discussed in or related to this material.
This message, including any attachments or links contained herein, is subject to important disclaimers, conditions, and disclosures regarding Electronic Communications, which you can find at https://portfolio-strategy.apsec.com/sancap-disclaimers-and-disclosures.
Important Disclaimers
Copyright © 2026 Santander US Capital Markets LLC and its affiliates (“SCM”). All rights reserved. SCM is a member of FINRA and SIPC. This material is intended for limited distribution to institutions only and is not publicly available. Any unauthorized use or disclosure is prohibited.
In making this material available, SCM (i) is not providing any advice to the recipient, including, without limitation, any advice as to investment, legal, accounting, tax and financial matters, (ii) is not acting as an advisor or fiduciary in respect of the recipient, (iii) is not making any predictions or projections and (iv) intends that any recipient to which SCM has provided this material is an “institutional investor” (as defined under applicable law and regulation, including FINRA Rule 4512 and that this material will not be disseminated, in whole or part, to any third party by the recipient.
The author of this material is an economist, desk strategist or trader. In the preparation of this material, the author may have consulted or otherwise discussed the matters referenced herein with one or more of SCM’s trading desks, any of which may have accumulated or otherwise taken a position, long or short, in any of the financial instruments discussed in or related to this material. Further, SCM or any of its affiliates may act as a market maker or principal dealer and may have proprietary interests that differ or conflict with the recipient hereof, in connection with any financial instrument discussed in or related to this material.
This material (i) has been prepared for information purposes only and does not constitute a solicitation or an offer to buy or sell any securities, related investments or other financial instruments, (ii) is neither research, a “research report” as commonly understood under the securities laws and regulations promulgated thereunder nor the product of a research department, (iii) or parts thereof may have been obtained from various sources, the reliability of which has not been verified and cannot be guaranteed by SCM, (iv) should not be reproduced or disclosed to any other person, without SCM’s prior consent and (v) is not intended for distribution in any jurisdiction in which its distribution would be prohibited.
In connection with this material, SCM (i) makes no representation or warranties as to the appropriateness or reliance for use in any transaction or as to the permissibility or legality of any financial instrument in any jurisdiction, (ii) believes the information in this material to be reliable, has not independently verified such information and makes no representation, express or implied, with regard to the accuracy or completeness of such information, (iii) accepts no responsibility or liability as to any reliance placed, or investment decision made, on the basis of such information by the recipient and (iv) does not undertake, and disclaims any duty to undertake, to update or to revise the information contained in this material.
Unless otherwise stated, the views, opinions, forecasts, valuations, or estimates contained in this material are those solely of the author, as of the date of publication of this material, and are subject to change without notice. The recipient of this material should make an independent evaluation of this information and make such other investigations as the recipient considers necessary (including obtaining independent financial advice), before transacting in any financial market or instrument discussed in or related to this material.
Important disclaimers for clients in the EU and UK
This publication has been prepared by Trading Desk Strategists within the Sales and Trading functions of Santander US Capital Markets LLC (“SanCap”), the US registered broker-dealer of Santander Corporate & Investment Banking. This communication is distributed in the EEA by Banco Santander S.A., a credit institution registered in Spain and authorised and regulated by the Bank of Spain and the CNMV. Any EEA recipient of this communication that would like to affect any transaction in any security or issuer discussed herein should do so with Banco Santander S.A. or any of its affiliates (together “Santander”). This communication has been distributed in the UK by Banco Santander, S.A.’s London branch, authorised by the Bank of Spain and subject to regulatory oversight on certain matters by the Financial Conduct Authority (FCA) and the Prudential Regulation Authority (PRA).
The publication is intended for exclusive use for Professional Clients and Eligible Counterparties as defined by MiFID II and is not intended for use by retail customers or for any persons or entities in any jurisdictions or country where such distribution or use would be contrary to local law or regulation.
This material is not a product of Santander´s Research Team and does not constitute independent investment research. This is a marketing communication and may contain ¨investment recommendations¨ as defined by the Market Abuse Regulation 596/2014 ("MAR"). This publication has not been prepared in accordance with legal requirements designed to promote the independence of research and is not subject to any prohibition on dealing ahead of the dissemination of investment research. The author, date and time of the production of this publication are as indicated herein.
This publication does not constitute investment advice and may not be relied upon to form an investment decision, nor should it be construed as any offer to sell or issue or invitation to purchase, acquire or subscribe for any instruments referred herein. The publication has been prepared in good faith and based on information Santander considers reliable as of the date of publication, but Santander does not guarantee or represent, express or implied, that such information is accurate or complete. All estimates, forecasts and opinions are current as at the date of this publication and are subject to change without notice. Unless otherwise indicated, Santander does not intend to update this publication. The views and commentary in this publication may not be objective or independent of the interests of the Trading and Sales functions of Santander, who may be active participants in the markets, investments or strategies referred to herein and/or may receive compensation from investment banking and non-investment banking services from entities mentioned herein. Santander may trade as principal, make a market or hold positions in instruments (or related derivatives) and/or hold financial interest in entities discussed herein. Santander may provide market commentary or trading strategies to other clients or engage in transactions which may differ from views expressed herein. Santander may have acted upon the contents of this publication prior to you having received it.
This publication is intended for the exclusive use of the recipient and must not be reproduced, redistributed or transmitted, in whole or in part, without Santander’s consent. The recipient agrees to keep confidential at all times information contained herein.


