


Uncategorized
Insurers carry an appetite for yield and duration into 2021
admin | April 23, 2021
This document is intended for institutional investors and is not subject to all of the independence and disclosure standards applicable to debt research reports prepared for retail investors. This material does not constitute research.
Despite all the precedents set last year, US insurance companies in general piloted more than $6.6 trillion in assets through the markets well. Portfolio yields dropped and downgrades slightly lowered asset quality, but insurers responded defensively by increasing cash balances and adding stronger credits. Relatively low rates still pose a challenge to some portfolios, and a better credit outlook should help rebalance asset quality. Insurers look likely to keep adding stronger credits this year, extending duration and increasing private placements.
Growing above trend
Insurance portfolios grew last year faster than their average pace in the last decade. Life portfolio balances in 2020 rose 7.1%, well above the 8-year compounded annual growth rate of 4.0% (Exhibit 1). P&C portfolios rose 5.9%, ahead of the sector’s 4.5% CAGR.
Exhibit 1: Rising portfolio balances for life and P&C insurers

Source: CreditSights, Inc., all rights reserved, Amherst Pierpont Securities
Both sectors continued to hold the majority of assets in fixed income securities. Life portfolios at the end of last year held 71.9% in fixed income, down 0.6% on the year. Cash and alternative investments picked up most of the ground lost to fixed income. P&C insurers held 59.3% in fixed income, down 1.6%. Cash at P&C insurers rose by 1%.
Falling portfolio yields
Yields in life and P&C portfolios last year dropped to 15-year lows with life yields down 28 bp and P&C yields down 41 bp. The longer average liabilities of life companies, their longer assets and, consequently, lower reinvestment risk explain the smaller yield drop. Life companies historically have lower yield volatility (Exhibit 2).
Exhibit 2: Life and P&C statutory portfolio yields dropped to 15-year lows

Source: CreditSights, Inc., all rights reserved, Amherst Pierpont Securities
The average change in yield masked reasonable variability across insurers. Among major life insurers, changes in statutory yield varied from MetLife at -60 bp to UNUM up 20 bp (Exhibit 3). Among major P&C insurers, changes ranged from Everest Re at -240 bp to Chubb with no change in yield. Changes across insurers roughly lined up with the share of the portfolio in 1-year or shorter maturities, although yield could also drop with the reinvestment of principal from MBS, residential mortgage loans or other callable securities.
Exhibit 3: The drop in portfolio yield ranged across insurers

Note: Statutory yields.
Source: CreditSights, Inc., all rights reserved, Amherst Pierpont Securities
Eroding credit quality
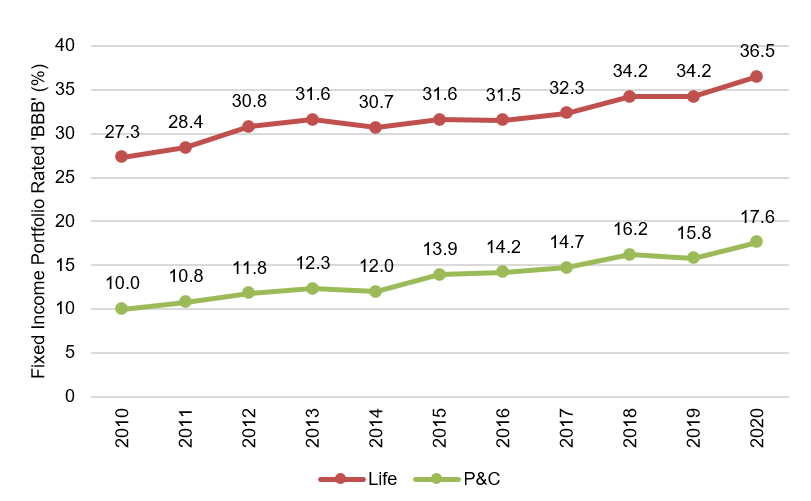
Downgrades lowered general portfolio asset quality. Credit ratings of ‘A’ or better dropped and holdings of ‘BBB’ rose to a 10-year high at both life and P&C insurers (Exhibit 4). Insurer transaction data showed limited forced selling in downgraded names and showed overweighting of marginal new investment toward ‘A’ credits. The limited supply of ‘A’ corporate debt pushed much of the marginal investment into structured products, where supply of investment grade debt is higher.
Exhibit 4: The share of portfolio rated ‘BBB’ reached a 10-year high
Source: CreditSights, Inc., all rights reserved, Amherst Pierpont Securities
Longer duration
Durations on many insurance portfolios extended last year. Life portfolios tended to extend more than P&C portfolios (Exhibit 5). Most traditional life portfolios run slightly shorter than their liabilities—at least measured by key rate duration—since life insurance liabilities can run well beyond 30 years while most bond debt runs 30 years or shorter. The yield concession for shorter maturities last year created extra incentive to extend. However, the longer maturities also could signal changes to the business mix, M&A or other developments that might bring longer liabilities onto the books.
Exhibit 5: Insurance portfolios tended to add duration last year

Note: GAAP fixed maturity of 10-years or greater excluding ABS.
Source: CreditSights, Inc., all rights reserved, Amherst Pierpont Securities.
More private placements
Low rates gave another boost to the role of private placements in insurers’ fixed income portfolios. The share in life portfolios rose to 37.6% and in P&C portfolios to an estimated 17.2%. Private placements generally yield substantially more than public securities, compensation for lower liquidity, ratings from smaller agencies and other terms. Life portfolios typically can more illiquidity than P&C portfolios since lifers are not subject to the same surges in claims that may hit P&C portfolios after storms, earthquakes, fires or other natural disasters.
Exhibit 6: Private placement took up a larger share of fixed income

Note: 2020 P&C share estimated.
Source: CreditSights, Inc., all rights reserved, Amherst Pierpont Securities.
Likely directions in 2021
Despite the extraordinary twists and turns in 2020, insurers generally came out of the year in good shape. Insurer capital and surplus generally grew, suggesting good asset-liability management and steady profitability.
Life portfolios continue to face pressure from relatively low rates, especially in books of business originally priced assuming much higher rates. A number of life insurers lately have announced material changes to their assumptions about long term rates. Both MetLife and CNA recently lowered their US 10-year rate assumption by 100 bp to 2.75%. Brighthouse and Principal lowered their US 10-year rate assumption by 75 bp to 3.00% and 3.25%, respectively. And Lincoln National and Prudential both dropped their assumption by 50 bp to 3.00% and 3.25%, respectively. That helps the insurers price new business, but legacy books likely face reinvestment rates below their pricing assumptions. That holds as well for portfolios funded through fixed-rate annuities priced at higher rates. That should create incentives to continue adding duration and taking illiquidity premium through private placements and other instruments.
P&C insurers generally should have an easier time of it this year than life insurers. P&C liabilities reset more often—an auto insurance policy, for instance, usually runs in 6-month terms—and allow insurers to adjust premiums to offset major shifts in investment returns. P&C insurers are having a relatively easy time raising premiums, so that should take pressure off the investment portfolio to stretch.
Market impact
Insurers dominate investment grade corporate and structured credit, and that is where the hunt for duration and incremental yield should play out. The heavy flow of insurers into investment grade credit has already tightened spreads there back to pre-pandemic levels or tighter. Flows into that market should continue. The CLO market, which generally pays a significant liquidity premium, should tighten to investment grade corporate debt on the back of steady insurer demand.
* * *
The view in rates
The FOMC meets on April 28, and one possible change might be the rate on the Fed’s reverse repo facility. Overnight Treasury repo and SOFR remain at 1 bp, with the rate on the Fed’s RRP at 0 bp. The Fed at the last FOMC noted it had low repo rates on its radar. It has already expanded the amount it will take at the RRP from any one counterparty, presumably a prelude to soaking up more cash from the system. The RRP sets the floor for the system and could lift SOFR in the process.
The 10-year note has finished the most recent session at 1.558%, down 2 bp from a week before. The market clearly is looking past many of the strong economic numbers that have come in lately. The term structure of inflation expectations has started shifting with 5-year breakeven inflation slipping from 262 bp a week ago to 244 bp at the most recent close, 10-year breakeven slipping from 237 bp to 234 bp and 5-year 5-year forward breakeven rising from 221 bp to 225 bp. Real rates, meanwhile, continue to fall suggesting some doubts in the rates markets about long-term growth and its ability to absorb the overhang of liquidity.
The Treasury yield curve has finished its most recent session with 2s10s at 140 bp, flatter by 18 bp since mid-March. The 5s30s curve has finished at 142 bp, flatter by 20 bp since mid-March. Although 10-year and longer rates have potential to rise back toward 2.0% if growth comes in above the current consensus of 6.2% real GDP growth this year, most of the action should come on the shorter end of the curve as the market reprices the Fed’s response to growth, inflation and employment.
The view in spreads
The tightening of MBS spreads suggests banks are slowly getting back to the business of buying. Add steady Fed buying and a slowing of new MBS origination as primary mortgage rates rise, and it’s a recipe for tighter spreads. Steady buying by banks and the Fed should keep spread tight and the dollar roll in MBS special.
In credit, support from insurers and money managers should keep spreads tightening. The latest $1.9 trillion round of fiscal stimulus, easy monetary policy and a narrowing pandemic has already started showing up in the economic numbers. Major gains in employment are likely the next phase. Weaker credits should outperform stronger credits, with high yield topping investment grade debt and both topping safe assets such as agency MBS and Treasury debt. The consumer balance sheets has come out of 2020 stronger than ever—at least on average—and consumer credit should outperform corporate credit.
The big risk to spreads should come when the Fed starts making noise about approaching its targets for employment and inflation and tapering asset purchases. Keep those antennae tuned.
The view in credit
Consumers continue to show great strength. Aggregate savings are up, home values are up and investment portfolios are up. Consumers have not added much debt. Although there is an underlying distribution of haves and have nots, the aggregate consumer balance sheet is strong. Corporate balance sheets have taken on substantial amounts of debt and will need earnings to rebound for either debt-to-EBITDA or EBITDA-to-interest-expense to drop back to better levels. But strong economic growth in 2021 and 2022 should lift most EBITDA and continue easing credit concerns. Eventually, rising interest expense should compete with EBITDA growth. But not yet.