


Uncategorized
US bank earnings recap
admin | April 16, 2021
This material is a Marketing Communication and does not constitute Independent Investment Research.
Additional reserve releases help drive another quarter of record earnings for the big US banks.
JP Morgan (JPM: A2/A-/AA-) was the first of the US money center banks to report first quarter earnings that shattered expectations on a huge reserve release and better than expected performance in investment banking and trading operations. Nevertheless, investors were focused on the lack of loan demand causing shares to sell-off modestly in early trading. JPM recorded EPS of $4.50 on record net income of $14.3 billion in the quarter, finishing well ahead of the $3.01 consensus estimate. The bank released $5.2 billion in reserves against net charge-offs of $1.1 billion, resulting in a net benefit to earnings of $4.2 billion. JPM broke down the release with the bulk of it coming from the cards portfolio. That followed a $2.9 billion reserve release in the prior quarter for a net benefit of $1.9 billion to earnings in the fourth quarter of 2020. Credit reserves now stand at $26 billion, which management stated are “appropriate and prudent,” meaning future releases may be limited. 1Q21 top-line managed revenue of $33.1 billion increased 14% year-over-year and also came in well ahead of consensus expectations. CEO Jamie Dimon spoke very optimistically about the prospect for an extreme period of robust economic growth in the US over the next few years, but investors appeared more focused on the anemic 1% uptick in average loans versus the 36% explosion in average deposits reported in the first quarter. Total trading revenue jumped 25% year-over-year to $9.1 billion. Fixed income (FICC) revenue grew 15% to $5.8 billion while equities jumped 47% to $3.3 billion, both well ahead of estimates. Investment banking revenue once again saw a tremendous year-over-year gain, as activity was severely curbed in the first quarter of 2020 outside of investment grade debt underwriting. Investment Banking fees jumped 57% to $3.0 billion. Advisory was up 35% to $680 million, equity underwriting up 219% to $1.1 billion and debt underwriting up 17% to $1.3 billion. Asset and wealth management saw 28% growth in assets under management (AUM) to $2.8 trillion
Bottom-line: Our sector weighting view on domestic banks remains marketweight since late 2020, reflecting tighter valuation in spreads and still present headwinds in the industry, such as low rates, constrained loan demand, and the relatively flat (albeit improving) yield curve. As the nation’s largest lender and premiere franchise among US money center banks, JPM remains a core holding within the segment. While JPM is trading tight to peers, the bank’s “fortress balance sheet” and extraordinary capital position, as well as its continued strong performance in the challenging operating environment, dictate its leading stature among US money center banks.
Exhibit 1: We maintain our preference for JPM intermediate paper, as there does not appear enough additional spread available in WFC to compensate for lingering reputational and regulatory risk
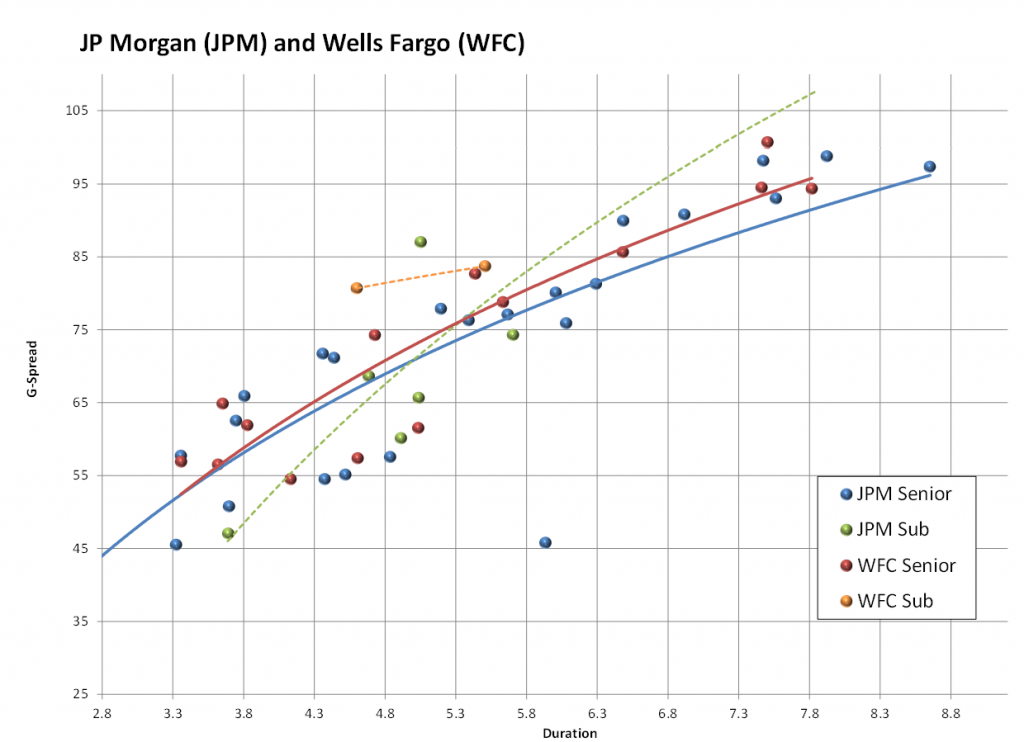
Source: Amherst Pierpont, Bloomberg/TRACE G-spread Indications
For the first time in several quarters, Wells Fargo (WFC: A2/BBB+/A+) was not forced to book substantial one-time charges for restructuring costs and customer remediation. Instead, the bank released $1.6 billion in reserves ($1.1 billion net of $523 million in charge-offs), resulting in EPS of $1.05 on net income of $4.7 billion – well ahead of the consensus estimate ($0.68) and a massive gain of the $0.01 recorded a year ago. First quarter 2021 results also included a $208 million gain on the continued sale of student loans and A $104 million write-down of related goodwill, which contributed a net impact of $0.02 to EPS. Top-line revenue of $18.0 billion also came in well ahead of consensus expectations. Shares are trading up following the conclusion of the earnings call, as investors appear optimistic about management’s comments regarding improving interest income and the prospect of dividend growth in the near-term. Average loans declined 9% year-over-year while average deposits increased by 4% for a second consecutive quarter, a modest gain relative to the double digit increases at peers. On the cost front, the efficiency ratio improved to 77% from the disappointing 83% posted in the prior quarter but was still up year-over-year versus the 74% reported in the first quarter of 2020.
Bottom-line: WFC’s first-quarter results appeared to be a step in the right direction, with the absence of restructuring charges and a sharp improvement to profitability versus the past several quarters. Shares are up more than 5% in response to the earnings report, while bond spreads remain largely unchanged with the broader peer group. WFC is still working toward repairing its severely bruised reputation but appears to be making some headway amidst the difficult operating environment. We remain buyers of WFC credit on short-term operational or headline related weakness, but our current preference is for JPM paper as bonds are trading too close to compensate investors for additional risks.
Goldman Sachs (GS: A2/BBB+/A) posted record top-line and earnings for the first quarter, resulting in the best EPS performance in over a decade. Net revenue more than doubled year-over-year to $17.7 billion, as record net earnings of $6.84 billion resulted in EPS of $18.60. Total trading revenue jumped 47% year-over-year to $7.6 billion in 1Q21. Fixed income (FICC) was 31% higher at $3.9 billion, while equities was up a staggering 68% to $3.7 billion, which could threaten to retake the top spot in the industry from peer Morgan Stanley. Revenue from investment banking spiked 73% year-over-year to $3.8 billion, led by a massive 315% year-over-year increase in equity underwriting to $1.6 billion. Advisory was up 43% to $1.1 billion and debt underwriting was up 51% to $880 million. All told, it is hard to classify GS’ first-quarter performance as anything but a rousing success, and a stark reminder of what the firm is capable of delivering when execution is at its peak. Unlike the previous quarter, there were no special charges for litigation and regulatory proceedings, as GS seems to have moved past the direct financial impacts of the 1MDB scandal. While there remains an overhang, and the prospect of additional, perhaps unrelated, global regulatory issues arising in the near-term, it does appear the largest elements of the scandal have been settled.
Bottom-line: Goldman had been subject to quarter-to-quarter fluctuations in performance in recent years, but the past year has demonstrated tremendously consistent execution in volatile markets, which is a traditional, long-term hallmark of the GS. We had always maintained our view that quarterly fluctuations remained mainly an equity story more than an actual concern for GS credit. The playing field does appear to have been leveled a bit with closest peer Morgan Stanley over the past few quarters, and GS may have regained its top spot among all equity trading shops on the street. We continue to see good relative value in GS intermediate bonds versus the broader peer group of US money center banks.
After two consecutive quarters of earnings that didn’t quite live up to the expectations created by rivals, Bank of America (BAC: A2/A-/A+) delivered what appear to be solid results in the context of the peer group. Profit more than doubled year-over-year to $8.1 billion or EPS of $0.86, twenty cents ahead of the consensus expectation. Earnings were aided by a $2.7 billion reserve release, which resulted in a net benefit of $1.9 billion after approximately $823 million in net charge-offs. BAC had taken a $6.6 billion provision for credit costs in the same period last year, which investors expressed at the time might not have been sufficient to cover the economic downturn of the global pandemic. Total allowance for loan losses now stands at $18 billion. BAC reported record investment banking fees in 1Q21, which increased 62% year-over-year to $2.2 billion, as equity underwriting fees skyrocketed by 218% to $900 million and advisory fees rose 49% to $400 million. Trading revenue increased 17% to $5.1 billion (ex DVA), with fixed income (FICC) up 22% to $3.3 billion and equities up 10% $1.8 billion. Despite BAC’s success, tepid loan demand was on display as total loan and lease balances declined 7% year-over-year versus a 25% increase in deposits.
Bottom-line: We maintain our view that investors in BAC credit remain properly compensated for the risk, particularly given the relative stability of the sector. Our preference between the two names remains with closest peer Citigroup on better risk/reward.
Exhibit 2. We continue to see better risk/reward in Citigroup intermediate paper over Bank of America
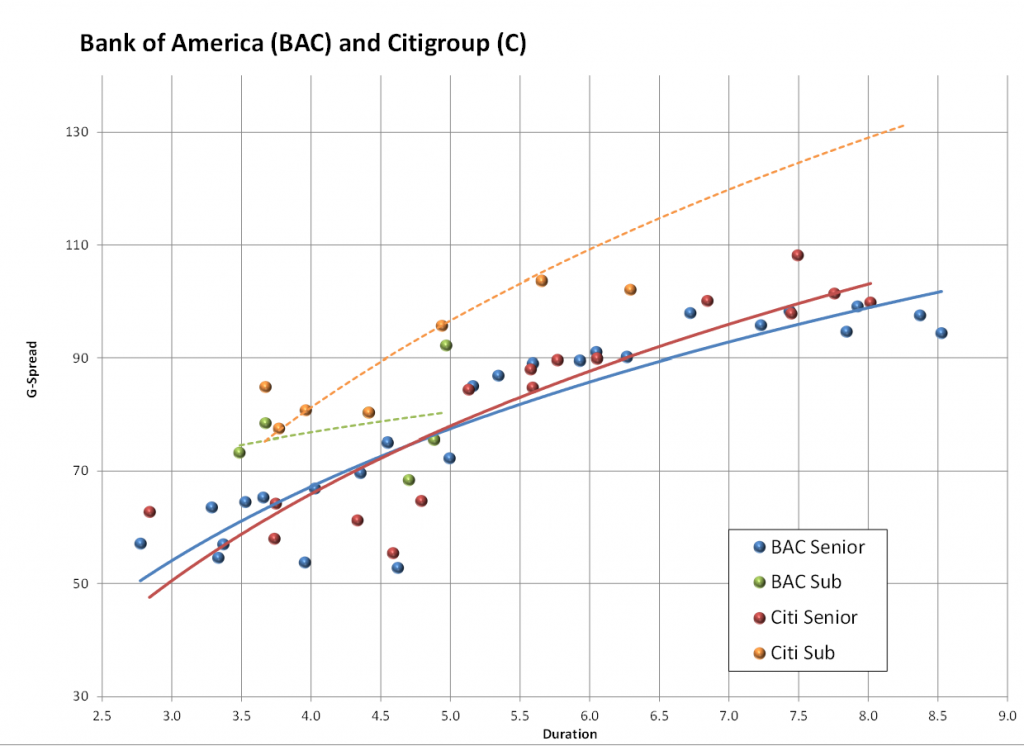
Source: Amherst Pierpont, Bloomberg/TRACE G-spread Indications
Citigroup (C: A3/BBB+/A) appears to have shaken off the regulatory issues from late 2020, delivering solid results that were in-line with peers over the past two quarters, and helping smooth the transition for new CEO Jane Fraser. Net income rose to a record $7.9 billion or EPS of $3.62, well ahead of the $2.47 ($5.1 billion) consensus estimate. Top-line revenue declined 7% to $19.3 billion, which was at the high-end of the range of expectations. Citi released $3.8 billion in reserves in 1Q21, which provided an earnings benefit of $2.1 billion net of $1.7 billion in credit costs. Total trading revenue increased 2% year-over-year to $6.7 billion. Fixed Income trading revenue was down 5% year-over-year to $4.6 billion, but moderately ahead of estimates, while equities trading revenue was up 26% year-over-year to $1.5 billion, also ahead of expectations. Investment banking revenue increased an impressive 46% to $2.0 billion, led by a jump in equity underwriting to $876 million from just $180 million in the prior year period. That gain helped offset a 27% year-over-year dip in advisory fees to $281 million and a flatter performance in debt underwriting, up just 4% year-over-year to $816 million.
Bottom-line: The bank took an additional step toward normalcy after the regulatory issues that plagued outgoing management in late 2020. Shares are roughly flat in reaction to earnings, versus a loss in closest peer BAC, which investors perceive had a weaker performance in the quarter. Spreads meanwhile are about +4 bp wider in both names in conjunction with the broader peer group, in part due to the large supply coming from post-earnings issuance from JPM and GS. We maintain our view that Citi remains among the preferred risk/reward picks in the Big Bank peer group, within the context of our marketweight for domestic banks within the IG Index.
Morgan Stanley (MS: A1/BBB+/A) is the last of the big 6 US money center banks to report 1Q21 results, recording an adjusted EPS of $2.22 (vs the $1.68 consensus estimate) as net income more than doubled to a record $4.1 billion. Top-line revenue also hit a record at $15.7 billion, a 60% increase over 1Q20. MS posted a $911 million loss tied to the Archegos Capital trading scandal, which while manageable was the only meaningful charge of its kind among the Big 6 this quarter. Initial reactions to the results have been mixed with shares selling off modestly in pre-market trading. Total trading revenue increased 30% year-over-year to $5.8 billion. Equity net revenues were up 17% year-over-year to $2.9 billion, but the bank conceded the top spot in overall production in equities revenue to peer Goldman Sachs in 1Q21 after a long stretch as the top producer in the industry. Fixed income (FICC) net trading revenue increased 44% year-over-year to $3.0 billion, coming in well ahead of the consensus expectations. Keeping pace with the peer group, MS saw huge gains in investment banking revenue, which was up 128% year-over-year to $2.6 billion. Equity underwriting increased nearly 3.5x year-over-year to $1.5 billion, while debt underwriting increased 41% year-over-year to $631 million and M&A advisory rose 33% year-over-year to $480 million.
Bottom-line: For another consecutive quarter, closest peer GS appeared to post the more impressive operating results, but it is very hard to argue with a continued record-breaking performance by MS for both the top and bottom line. The Archegos hit represents little more than noise for the current quarter, but time will tell if this is in any way an indication of potential lapses in global risk management systems for the firms that booked losses. We still believe MS maintains the preferred longer-term franchise for retail brokerage over GS, and it will be interesting to monitor how the firm intends to integrate its purchase of E*Trade to potentially further its edge across these platforms. Furthermore, the recent acquisition of Eaton Vance should bolster the bank’s expanding presence in Investment and Wealth Management. Both MS and GS remain core holdings for the US Banking segment–which we currently view as an Marketweight. Our preference has been for the spread pick in GS over MS in the intermediate part of the curve when available.
Exhibit 3. Spreads have gotten very tight between GS and MS, but we still prefer the spread pick-up in GS where available in the intermediate part of the curve
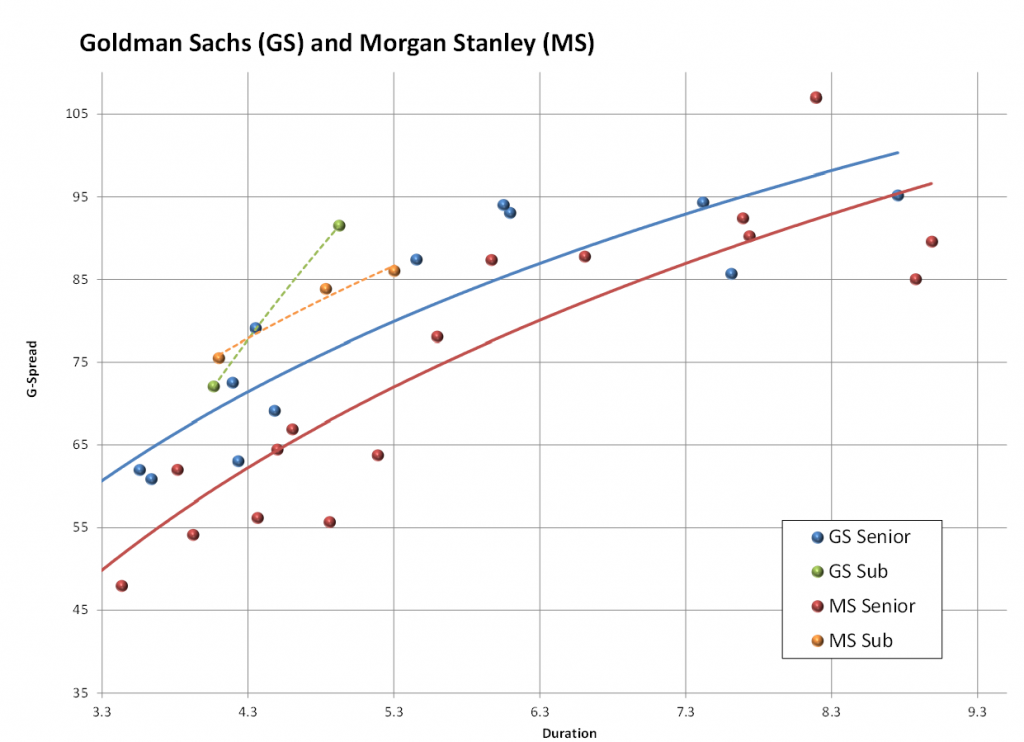
Source: Amherst Pierpont, Bloomberg/TRACE G-spread Indications