Uncategorized
Diving in on delinquency trends in non-QM
admin | April 16, 2021
This material is a Marketing Communication and does not constitute Independent Investment Research.
Investors in non-QM securitizations have seen a precipitous decline in delinquency rates on loans backing these trusts. But that steady improvement has begun to fade in recent months and, in some cases, tick back up after accounting for both delinquencies and certain types of modifications, Investors should keep a close eye on potential changes to servicer behavior as borrowers exit forbearance and on delinquency trends across different borrower attributes.
Nearly a year removed from peak stresses in the non-QM market, the cohort has seen a pronounced recovery. That recovery has begun to stall, leaving investors to question whether lagging performance is merely a function of borrowers coming to the end of forbearance. Alternatively, current delinquencies could reflect the tail of borrowers experiencing material hardship from pandemic. Recent upticks in delinquency and modification rates in certain sectors of the market may be signaling the latter.
On balance, it’s fair to say that credit performance across non-QM collateral has been resilient relative to other mortgage credit cohorts. Delinquency rates have fallen 55% since peak levels in June last year and currently sit at just over 10% for the cohort, roughly 350 bp higher than those in April last year. Sectors of the market that were areas of concern at the onset of the pandemic, such as loans underwritten with limited documentation or those that used a property’s rental income instead of the borrowers, have fared relatively well when compared to fully underwritten ones.
There are some areas of the market that should garner increased surveillance. There is somewhat material divergence in overall delinquency, modification and roll rates across major non-QM shelves, likely driven by the types of loans backing different sponsors’ trusts as well as some potential recent changes in servicer behavior. One potential cause for concern among non-QM investors is that after accounting for both delinquency and modification rates, some shelves are seeing a modest uptick in those rates in recent months due to increases in capitalization modifications by servicers. An increasing incidence of capitalization modifications may be a function of borrowers exiting forbearance with an inability to repay past due balances. Given this, the servicer may capitalize those arrearages which may result in a loss to the trust (Exhibit 1).
Exhibit 1: Tracking shelf level delinquencies and modifications across non-QM
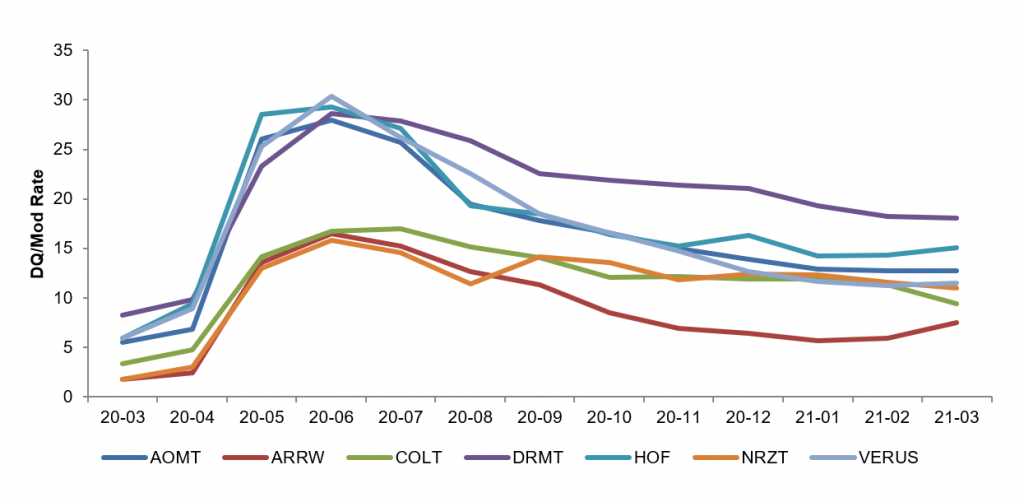
Source: CoreLogic, Amherst Pierpont
Looking at month-over-month roll rates across major non-QM shelves shows that relatively stagnant delinquency rates are mainly a function of large populations of loans previously 90 days or more past due remaining seriously delinquent. There is limited variance across shelves. Between 82.3% and 86.9% of loans seriously delinquent in February remained so in March across larger non-QM shelves. While serious delinquency status remained relatively consistent across all major sponsors there were some differences across issuers when looking at cure and prepay rates for loans that transitioned out of serious delinquency.
WAMCO’s ARRW and New Residential’s NRZT shelf saw the highest amounts of seriously delinquent loans roll back to current in March at 8.4% and 8.8% respectively. However, some of these cure rates appear to be primarily fueled by the incidence of capitalization modifications as 1.9% of all loans backing ARRW deals received a capitalization modification in March while 0.2%% of loans backing the NRZT shelf received capitalization modifications. In both instances, these modifications resulted in losses to their respective trusts. While capitalization modifications are somewhat commonplace across the NRZT shelf, more so in called legacy re-securitizations than in non-QM deals, the uptick in those modifications in March are new to the ARRW shelf and may be a harbinger of increased incidence of them going forward across other non-QM shelves as borrowers exit forbearance. Of course, it may be somewhat servicer dependent. And while Pretium’s DRMT shelf had the lowest amount of loans remain in late-stage delinquency, this was fueled by a combination of cures and prepayments as well as the highest concentration of loans that rolled to foreclosure, REO and liquidation. In fact, the DRMT shelf was the only major shelf that had any loans, albeit a very small amount, roll to REO or liquidation (Exhibit 2).
Exhibit 2: Tracking roll rates across seriously delinquent non-QM loans
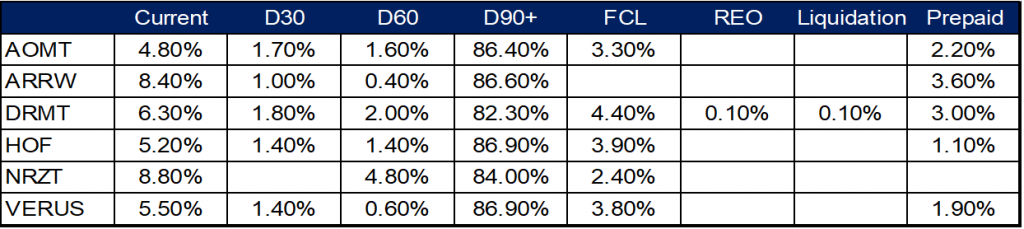
Source: CoreLogic, Amherst Pierpont
Looking at performance across loan attributes
While non-QM investors should know how servicers are treating borrowers exiting forbearance, they should also continue to keep an eye on the relative performance of different loan attributes across the sector. One example of this is the relatively strong performance of limited documentation loans, where overall delinquency rates on those loans totaled just 9.2% in March, only 30 bp greater than those of fully documented borrowers. The relatively strong performance on limited documentation loans is likely a function of the presence of compensating credit characteristics, quite often in the form of lower LTV ratios at origination. Another area of relative strength in the non-QM market is the performance of non-owner occupied loans. Delinquency rates on both investor loans and second homes are tracking somewhat substantially below those of owner-occupied ones. Delinquency rates on investor loans and second homes were 9.1% and 8.5% respectively in March while they tallied nearly 12% for owner-occupied borrowers. Within the subset of investor loans, delinquency rates on loans underwritten using the property’s rental income or DSCR are only modestly higher than those traditionally underwritten using the borrowers income. Delinquency rates on DSCR loans stood at roughly 9.5% last month, roughly 110 bp higher than those of traditionally underwritten investor loans. Ultimately the relative resilience of non-QM credit should be a positive for the growth of the asset class going forward however investors may be subject to existing trusts facing some near term losses as borrowers exit forbearance and arrearages accrued during forbearance are passed through to those trusts.
This material is intended only for institutional investors and does not carry all of the independence and disclosure standards of retail debt research reports. In the preparation of this material, the author may have consulted or otherwise discussed the matters referenced herein with one or more of SCM’s trading desks, any of which may have accumulated or otherwise taken a position, long or short, in any of the financial instruments discussed in or related to this material. Further, SCM may act as a market maker or principal dealer and may have proprietary interests that differ or conflict with the recipient hereof, in connection with any financial instrument discussed in or related to this material.
This message, including any attachments or links contained herein, is subject to important disclaimers, conditions, and disclosures regarding Electronic Communications, which you can find at https://portfolio-strategy.apsec.com/sancap-disclaimers-and-disclosures.
Important Disclaimers
Copyright © 2026 Santander US Capital Markets LLC and its affiliates (“SCM”). All rights reserved. SCM is a member of FINRA and SIPC. This material is intended for limited distribution to institutions only and is not publicly available. Any unauthorized use or disclosure is prohibited.
In making this material available, SCM (i) is not providing any advice to the recipient, including, without limitation, any advice as to investment, legal, accounting, tax and financial matters, (ii) is not acting as an advisor or fiduciary in respect of the recipient, (iii) is not making any predictions or projections and (iv) intends that any recipient to which SCM has provided this material is an “institutional investor” (as defined under applicable law and regulation, including FINRA Rule 4512 and that this material will not be disseminated, in whole or part, to any third party by the recipient.
The author of this material is an economist, desk strategist or trader. In the preparation of this material, the author may have consulted or otherwise discussed the matters referenced herein with one or more of SCM’s trading desks, any of which may have accumulated or otherwise taken a position, long or short, in any of the financial instruments discussed in or related to this material. Further, SCM or any of its affiliates may act as a market maker or principal dealer and may have proprietary interests that differ or conflict with the recipient hereof, in connection with any financial instrument discussed in or related to this material.
This material (i) has been prepared for information purposes only and does not constitute a solicitation or an offer to buy or sell any securities, related investments or other financial instruments, (ii) is neither research, a “research report” as commonly understood under the securities laws and regulations promulgated thereunder nor the product of a research department, (iii) or parts thereof may have been obtained from various sources, the reliability of which has not been verified and cannot be guaranteed by SCM, (iv) should not be reproduced or disclosed to any other person, without SCM’s prior consent and (v) is not intended for distribution in any jurisdiction in which its distribution would be prohibited.
In connection with this material, SCM (i) makes no representation or warranties as to the appropriateness or reliance for use in any transaction or as to the permissibility or legality of any financial instrument in any jurisdiction, (ii) believes the information in this material to be reliable, has not independently verified such information and makes no representation, express or implied, with regard to the accuracy or completeness of such information, (iii) accepts no responsibility or liability as to any reliance placed, or investment decision made, on the basis of such information by the recipient and (iv) does not undertake, and disclaims any duty to undertake, to update or to revise the information contained in this material.
Unless otherwise stated, the views, opinions, forecasts, valuations, or estimates contained in this material are those solely of the author, as of the date of publication of this material, and are subject to change without notice. The recipient of this material should make an independent evaluation of this information and make such other investigations as the recipient considers necessary (including obtaining independent financial advice), before transacting in any financial market or instrument discussed in or related to this material.
Important disclaimers for clients in the EU and UK
This publication has been prepared by Trading Desk Strategists within the Sales and Trading functions of Santander US Capital Markets LLC (“SanCap”), the US registered broker-dealer of Santander Corporate & Investment Banking. This communication is distributed in the EEA by Banco Santander S.A., a credit institution registered in Spain and authorised and regulated by the Bank of Spain and the CNMV. Any EEA recipient of this communication that would like to affect any transaction in any security or issuer discussed herein should do so with Banco Santander S.A. or any of its affiliates (together “Santander”). This communication has been distributed in the UK by Banco Santander, S.A.’s London branch, authorised by the Bank of Spain and subject to regulatory oversight on certain matters by the Financial Conduct Authority (FCA) and the Prudential Regulation Authority (PRA).
The publication is intended for exclusive use for Professional Clients and Eligible Counterparties as defined by MiFID II and is not intended for use by retail customers or for any persons or entities in any jurisdictions or country where such distribution or use would be contrary to local law or regulation.
This material is not a product of Santander´s Research Team and does not constitute independent investment research. This is a marketing communication and may contain ¨investment recommendations¨ as defined by the Market Abuse Regulation 596/2014 ("MAR"). This publication has not been prepared in accordance with legal requirements designed to promote the independence of research and is not subject to any prohibition on dealing ahead of the dissemination of investment research. The author, date and time of the production of this publication are as indicated herein.
This publication does not constitute investment advice and may not be relied upon to form an investment decision, nor should it be construed as any offer to sell or issue or invitation to purchase, acquire or subscribe for any instruments referred herein. The publication has been prepared in good faith and based on information Santander considers reliable as of the date of publication, but Santander does not guarantee or represent, express or implied, that such information is accurate or complete. All estimates, forecasts and opinions are current as at the date of this publication and are subject to change without notice. Unless otherwise indicated, Santander does not intend to update this publication. The views and commentary in this publication may not be objective or independent of the interests of the Trading and Sales functions of Santander, who may be active participants in the markets, investments or strategies referred to herein and/or may receive compensation from investment banking and non-investment banking services from entities mentioned herein. Santander may trade as principal, make a market or hold positions in instruments (or related derivatives) and/or hold financial interest in entities discussed herein. Santander may provide market commentary or trading strategies to other clients or engage in transactions which may differ from views expressed herein. Santander may have acted upon the contents of this publication prior to you having received it.
This publication is intended for the exclusive use of the recipient and must not be reproduced, redistributed or transmitted, in whole or in part, without Santander’s consent. The recipient agrees to keep confidential at all times information contained herein.


