


Uncategorized
Another round for my friends
admin | April 16, 2021
This material is a Marketing Communication and does not constitute Independent Investment Research.
Congress authorized a third round of rebate checks to households in March, the largest round yet. This piled onto an already massive buildup of savings by households since the pandemic began, as government payments have more than offset the loss of wages and salaries over the past year. The surge in March retail sales undoubtedly reflected the influx of more government cash into household coffers. The impact should continue in April before dissipating.
Lifetime income hypothesis
Economic theory going back to Milton Friedman in the 1960s tells us that households will spend only a fraction of any one-off government payment because they tend to smooth their consumption over time based on expectations of lifetime income. If the government permanently cuts your taxes or offers you an annuity, theory says that you would be inclined to spend most of the proceeds because the windfall is recurring. However, a one-off payment, even a large one, is likely to barely move the needle for most households’ assumptions about their lifetime income.
There should be two types of households that would spend most of a one-off payment, however. Some households are operating under a liquidity constraint. Consider a young college graduate, who expects to have a successful and lucrative career but is currently in an entry-level, modestly paying job. This person would like to spend more to smooth their consumption over time but is not in a position to borrow enough to do so. For this person, a government rebate check would allow them to boost their current consumption level to something closer to their expected lifetime average. Second, for those living hand-to-mouth, these theoretical calculations probably never come into play. For them, a one-off payment might mean being able to pay the rent or buy groceries for another month or two. For everyone else, including the households responsible for the vast majority of consumer spending, a one-off payment will mostly be saved or used to pay down debt.
Another round for my friends
The concept of rebate checks had been tried before the pandemic. Checks were sent in the mail in 2001 and again twice more during the 2000s. Economic research done in subsequent years found that households spent something like 30% of the checks.
Nevertheless, the concept of rebate checks was tried again in the March 2020 CARES Act. If there was ever a situation that called for a round of one-off payments to households, the lockdowns in March and April of 2020 would appear to fit the bill. Employment fell by more than 22 million, and millions more saw their hours and paychecks cut. The rebate checks were thought of as a bridge for personal finances until the economy could reopen.
In the end, the pandemic lasted much longer than initially expected when the CARES Act was put together, but the economy bounced back more quickly and more vigorously than feared. Moreover, the unemployment insurance program distributed a massive amount of payments to households on top of the rebate checks. As a result, personal income exceeded pre-pandemic levels from April 2020 forward, and by late last year, it was already evident that household balance sheets were in far better shape in the aggregate than they had been before Covid.
Nonetheless, politicians from both parties saw the checks as a highly popular strategy for wooing voters, and the December Covid relief package included a smaller round of checks paid out in early January. Then, once Democrats took control of the U.S. Senate and the White House, focus turned to offering massive additional help, including a third round of rebate checks, the largest one yet.
Gauging the response
Researchers at the New York Fed have used the Bank’s monthly Survey of Consumer Expectations to assess households’ response to the rebate checks. They asked about the first round of checks in June, about a hypothetical second round in August, then about the actual second round of checks in January, and finally in March about actual and expected usage of the latest round of payments. The results have been remarkably consistent (Exhibit 1).
Exhibit 1: New York Fed survey results
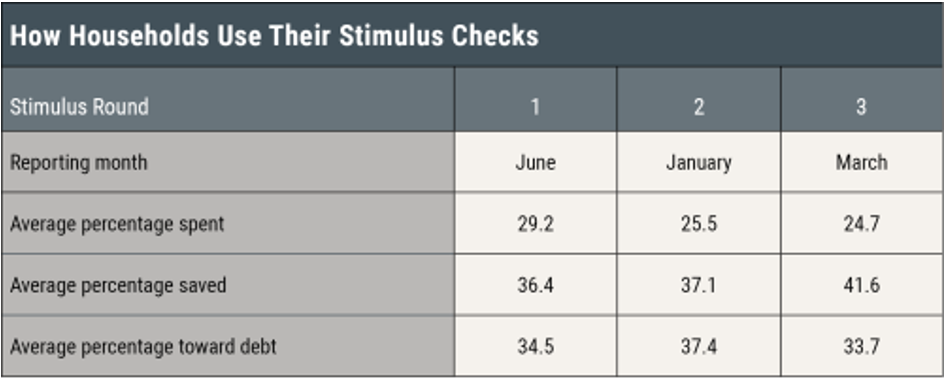
Notes: Round 1 results are based on 1,423 respondents to the June 2020 special SCE survey who reported receiving a stimulus check. Rounds 2 and 3 results are based on 1,062 and 1,007 respondents to the January and March 2021 Core SCE surveys, respectively, who received or expected to receive second- and third-round stimulus checks.
Source: New York Fed Survey of Consumer Expectations (SCE).
The results are quite consistent with the consensus of economic research regarding what economists refer to as households’ marginal propensity to consume, which simply means the proportion of an extra dollar of income that a household would spend. The June 2020 survey results suggest that households spent about 30 cents of every dollar of rebate checks and saved the rest by either increasing savings or paying down debt. Despite the unique set of circumstances in the spring of 2020, it appears that household behavior reverted to the prior pattern.
By early 2021, millions of people had returned to work and, with vaccines being rolled out, there was more assurance that the pandemic would be ending in a reasonable period of time. Moreover, household finances were in stellar shape. It makes sense that the marginal propensity to consume has declined somewhat for each round of checks. By the latest round, households were planning to spend only about a quarter of the windfall.
Quantifying the boost
The first round of rebate checks distributed in April and May of 2020 totaled about $268 billion. Applying the NY Fed estimate of a 30% spend rate, the boost to consumer spending would have been around $80 billion over the April-June period. Of course, there was so much more going on at that time that it would be extremely difficult to apportion credit for consumer spending trends to the checks as opposed to the wild swings in employment and income.
In January 2021, Treasury distributed about $139 billion in the second round of checks. Using the NY Fed’s 25% estimate for the spend rate, the boost to consumption was likely in the neighborhood of $35 billion. There were other forces affecting spending estimates in January and February, including seasonal adjustment problems and weather swings. But the second round of checks undoubtedly contributed to the 7.7% jump in retail sales and the 3.0% increase in real consumer spending in the month. The dip in consumer spending in February (-1.2%) was partly due to the severe weather during the period but also partly reflected the dissipation of windfall outlays.
The latest round of rebate checks is easily the largest yet. Treasury paid out $339 billion in March and has distributed another $42 billion in April through Wednesday. When all is said and done, close to $400 billion may be disbursed. Even if consumers spend just under one-quarter of the windfall, as the NY Fed survey results suggest, that would be a nearly $100 billion bulge in consumer spending, all else equal.
As was the case in prior rounds, there is much else going on with consumer spending besides the rebate checks. In March, households were venturing out more as the pandemic receded and vaccinations picked up, a trend that will undoubtedly continue over the next several months. In addition, improved weather likely spurred activity last month. If we assume that the latest windfall is being spent over March and April, that might work out to something like a $50 billion bump in each month. Retail sales account for close to half of total consumer spending, so the March tally reported a few days ago may have included a rebate check boost of something like $25 billion. The 9.8% jump in retail sales amounted to about $55 billion, so the rebate check effect may have accounted for a little less than half of the rise, while the rest reflected improved weather and economic reopening.
If we assume that the April windfall impact will be similar, then the rebate checks would inflate the level of spending in April but would not impact the monthly change. Rather, the percentage increase of consumer spending in April would mostly reflect the underlying improving trend as the economy reopens and households begin to move about and spend more freely.
Consumer spending would be expected to drop in May, as the $50 billion boost to outlays seen in March and April evaporates. The underlying trend would still be firmly upward, so that the May drop in spending would be much smaller than the March gain, but I would expect an absolute decline in retail sales and in overall consumer spending for May.
Summing these numbers up, 1Q2021 real consumer spending should work out to a gain of around 10% annualized, driven in part but not entirely by the rebate checks. In contrast, outlays in the spring will be primarily propelled by a reopening economy. Even with a fading impact from rebate checks, look for real consumer expenditures to accelerate further to better than a 13% annualized jump in 2Q2021 before decelerating in the second half of the year.