Uncategorized
A strong start for private debt
admin | April 16, 2021
This material is a Marketing Communication and does not constitute Independent Investment Research.
Even though banks have stopped tightening lending standards, they have not started turning back the clock toward the days before pandemic. The door remains open for private credit, and the market so far likes what it sees. Business development companies, bellwethers for leveraged investing in private credit, have outperformed almost all sectors of fixed income lately and large sectors of equity. The prospects for private lending over the next few years still look good.
Valuations on private lenders have moved up since the beginning of the year more than 21%, roughly 10 percentage points more than the S&P 500 (Exhibit 1). Even after accounting for BDCs ability to lend to small and medium companies by using up to $2 of debt for every $1 of equity, the implied 7% gain on their loan portfolios—a lower bound since some BDCs run lower leverage—is still strong. BDCs and their underlying portfolios have outdistanced the unleveraged returns on leveraged loans and high yield, as well as returns in MBS and investment grade corporate debt.
Exhibit 1: Returns on BDCs imply strong performance in underlying private debt
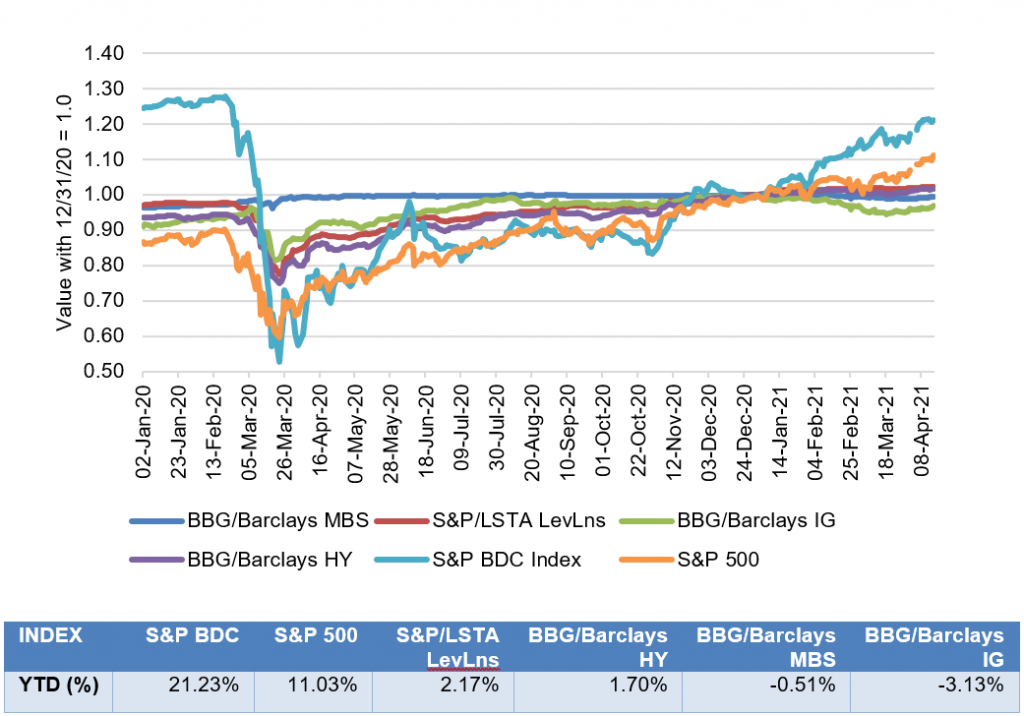
Source: Bloomberg, Amherst Pierpont Securities
The especially strong performance of private debt since October almost certainly reflects the growing cumulative effects of Fed policy, fiscal stimulus and progress on pandemic. A highly accommodative Fed, US fiscal stimulus unseen as a share of GDP since World War II and rapid progress on vaccination have all become clearer since October. Much of that good news is almost certainly baked in across fixed income. But since private debt is highly sensitive to all these developments, it should show strong relative performance.
One important element of private debt performance with upside is its interplay with bank lending. Private debt has grown quickly since regulation and banks’ own risk appetites after the 2008 financial crisis shifted lending boundaries. Smaller businesses with unusual cash flows, limited collateral, elevated debt-to-income, concentrated customer exposures or shorter operating histories have faced tighter terms at banks—if those borrowers found terms at all.
The pandemic has clearly narrowed bank lending and opened the door to private debt. Net tightening of bank credit to commercial and industrial borrowers, according to the Fed’s Senior Loan Officer Opinion Survey, has been significant since last March. At its peak in the third quarter last year, more than 70% of banks had tightened terms to small, medium and large C&I borrowers. The Fed reports no net easing yet. But, if history is a guide, the bank lending cycle has not played out.
Exhibit 2: C&I lending tightened during pandemic, opening a door for private debt
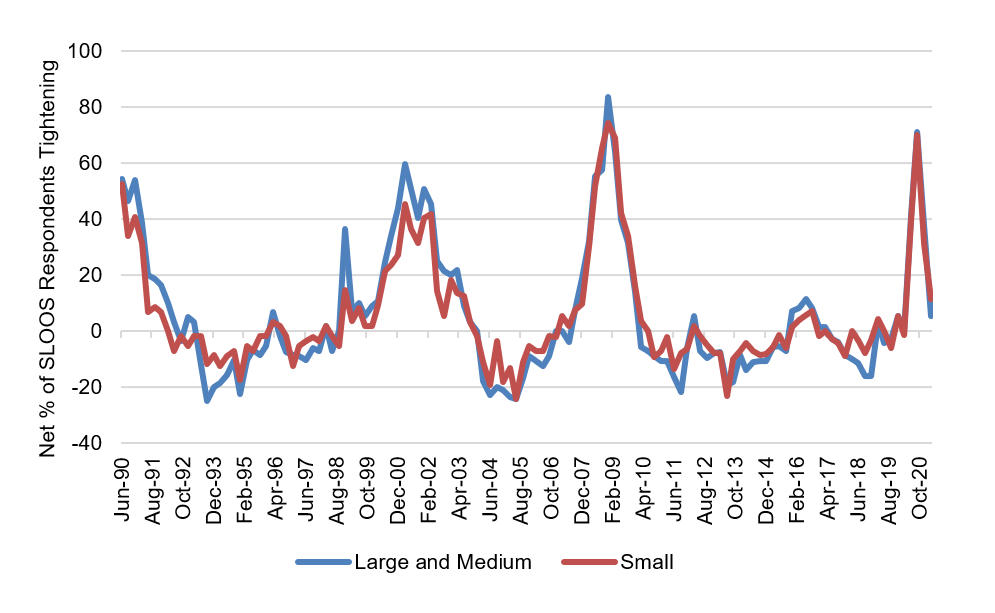
Source: Federal Reserve, Amherst Pierpont Securities
Banks historically have loosened lending standards after every episode of significant tightening since at least 1990. Banks loosened after the 1990 recession, the 2001 bursting of the Internet Bubble, the 2008 Great Recession and, in all likelihood, the 2020 recession. Looser lending will likely bring banks back into some of the same markets ceded in the last year to private credit, bolstering the balance sheets and improving the credit of companies in those markets. That should further improve valuations for the companies’ current lenders.
Capital markets investor without private lending efforts of their own still can get exposure. Some BDCs get financing through the CLO market. Others structure private financing with insurers or other investors through broker/dealer intermediaries.
Even though strong growth is likely built into valuations already, the flow of bank lending back into the markets now served by private debt likely is not. That should play out through 2021, 2022 and beyond, adding to performance for portfolios with private debt exposure.
* * *
The view in rates
Overnight Treasury repo and SOFR remain at 1 bp, but the Fed at the last FOMC suggested it might intervene between regularly scheduled meetings to raise the rate on its reverse repo facility, currently at zero. It has already expanded the amount it will take at the RRP from any one counterparty, presumably a prelude to soaking up more cash from the system. The RRP sets the floor for the system and could lift SOFR in the process.
The 10-year note has finished the most recent session at 1.588%, on the low side of the expected range of 1.50% to 1.95% for the balance of the year. Inflation expectations remain near their highest levels of the last five years with 5-year breakeven inflation at 262 bp, 10-year breakeven at 237 bp and 5-year 5-year forward breakeven at 221 bp. The culprit behind lower nominal rates in a 20 bp drop in real rates since mid-March.
The Treasury yield curve has finished its most recent session with 2s10s at 142 bp, flatter by 15 bp since mid-March The 5s30s curve has finished at 144 bp, flatter by 18 bp since mid-March. Although 10-year and longer rates have potential to rise back toward 2.0% if growth comes in above the current consensus of 6.2% real GDP growth this year, most of the action should come on the shorter end of the curve as the market reprices the Fed’s response to growth, inflation and employment.
The view in spreads
MBS spreads should be much more volatile than credit spreads until banks get solidly back to the business of buying. MBS duration has nearly doubled from 2 years at the start of February to 4 years lately, leaving many banks more exposed to interest rate risk than preferred and inclined to rebalance by reinvesting in cash assets. That takes a strong bid out of the MBS market. After February, it looked like it could take between one month and three months for deposit growth to force banks back into the market. The tightening of MBS spreads in recent weeks suggests a return is in progress.
In credit, support from insurers and money managers should keep spreads tightening. The latest $1.9 trillion round of fiscal stimulus, easy monetary policy and a narrowing pandemic has already started showing up in the economic numbers. Major gains in employment are likely the next phase. Weaker credits should outperform stronger credits, with high yield topping investment grade debt and both topping safe assets such as agency MBS and Treasury debt. The consumer balance sheets has come out of 2020 stronger than ever—at least on average—and consumer credit should outperform corporate credit.
The view in credit
Consumers continue to show great strength. Aggregate savings are up, home values are up and investment portfolios are up. Consumers have not added much debt. Although there is an underlying distribution of haves and have nots, the aggregate consumer balance sheet is strong. Corporate balance sheets have taken on substantial amounts of debt and will need earnings to rebound for either debt-to-EBITDA or EBITDA-to-interest-expense to drop back to better levels. But strong economic growth in 2021 and 2022 should lift most EBITDA and continue easing credit concerns.
This material is intended only for institutional investors and does not carry all of the independence and disclosure standards of retail debt research reports. In the preparation of this material, the author may have consulted or otherwise discussed the matters referenced herein with one or more of SCM’s trading desks, any of which may have accumulated or otherwise taken a position, long or short, in any of the financial instruments discussed in or related to this material. Further, SCM may act as a market maker or principal dealer and may have proprietary interests that differ or conflict with the recipient hereof, in connection with any financial instrument discussed in or related to this material.
This message, including any attachments or links contained herein, is subject to important disclaimers, conditions, and disclosures regarding Electronic Communications, which you can find at https://portfolio-strategy.apsec.com/sancap-disclaimers-and-disclosures.
Important Disclaimers
Copyright © 2026 Santander US Capital Markets LLC and its affiliates (“SCM”). All rights reserved. SCM is a member of FINRA and SIPC. This material is intended for limited distribution to institutions only and is not publicly available. Any unauthorized use or disclosure is prohibited.
In making this material available, SCM (i) is not providing any advice to the recipient, including, without limitation, any advice as to investment, legal, accounting, tax and financial matters, (ii) is not acting as an advisor or fiduciary in respect of the recipient, (iii) is not making any predictions or projections and (iv) intends that any recipient to which SCM has provided this material is an “institutional investor” (as defined under applicable law and regulation, including FINRA Rule 4512 and that this material will not be disseminated, in whole or part, to any third party by the recipient.
The author of this material is an economist, desk strategist or trader. In the preparation of this material, the author may have consulted or otherwise discussed the matters referenced herein with one or more of SCM’s trading desks, any of which may have accumulated or otherwise taken a position, long or short, in any of the financial instruments discussed in or related to this material. Further, SCM or any of its affiliates may act as a market maker or principal dealer and may have proprietary interests that differ or conflict with the recipient hereof, in connection with any financial instrument discussed in or related to this material.
This material (i) has been prepared for information purposes only and does not constitute a solicitation or an offer to buy or sell any securities, related investments or other financial instruments, (ii) is neither research, a “research report” as commonly understood under the securities laws and regulations promulgated thereunder nor the product of a research department, (iii) or parts thereof may have been obtained from various sources, the reliability of which has not been verified and cannot be guaranteed by SCM, (iv) should not be reproduced or disclosed to any other person, without SCM’s prior consent and (v) is not intended for distribution in any jurisdiction in which its distribution would be prohibited.
In connection with this material, SCM (i) makes no representation or warranties as to the appropriateness or reliance for use in any transaction or as to the permissibility or legality of any financial instrument in any jurisdiction, (ii) believes the information in this material to be reliable, has not independently verified such information and makes no representation, express or implied, with regard to the accuracy or completeness of such information, (iii) accepts no responsibility or liability as to any reliance placed, or investment decision made, on the basis of such information by the recipient and (iv) does not undertake, and disclaims any duty to undertake, to update or to revise the information contained in this material.
Unless otherwise stated, the views, opinions, forecasts, valuations, or estimates contained in this material are those solely of the author, as of the date of publication of this material, and are subject to change without notice. The recipient of this material should make an independent evaluation of this information and make such other investigations as the recipient considers necessary (including obtaining independent financial advice), before transacting in any financial market or instrument discussed in or related to this material.
Important disclaimers for clients in the EU and UK
This publication has been prepared by Trading Desk Strategists within the Sales and Trading functions of Santander US Capital Markets LLC (“SanCap”), the US registered broker-dealer of Santander Corporate & Investment Banking. This communication is distributed in the EEA by Banco Santander S.A., a credit institution registered in Spain and authorised and regulated by the Bank of Spain and the CNMV. Any EEA recipient of this communication that would like to affect any transaction in any security or issuer discussed herein should do so with Banco Santander S.A. or any of its affiliates (together “Santander”). This communication has been distributed in the UK by Banco Santander, S.A.’s London branch, authorised by the Bank of Spain and subject to regulatory oversight on certain matters by the Financial Conduct Authority (FCA) and the Prudential Regulation Authority (PRA).
The publication is intended for exclusive use for Professional Clients and Eligible Counterparties as defined by MiFID II and is not intended for use by retail customers or for any persons or entities in any jurisdictions or country where such distribution or use would be contrary to local law or regulation.
This material is not a product of Santander´s Research Team and does not constitute independent investment research. This is a marketing communication and may contain ¨investment recommendations¨ as defined by the Market Abuse Regulation 596/2014 ("MAR"). This publication has not been prepared in accordance with legal requirements designed to promote the independence of research and is not subject to any prohibition on dealing ahead of the dissemination of investment research. The author, date and time of the production of this publication are as indicated herein.
This publication does not constitute investment advice and may not be relied upon to form an investment decision, nor should it be construed as any offer to sell or issue or invitation to purchase, acquire or subscribe for any instruments referred herein. The publication has been prepared in good faith and based on information Santander considers reliable as of the date of publication, but Santander does not guarantee or represent, express or implied, that such information is accurate or complete. All estimates, forecasts and opinions are current as at the date of this publication and are subject to change without notice. Unless otherwise indicated, Santander does not intend to update this publication. The views and commentary in this publication may not be objective or independent of the interests of the Trading and Sales functions of Santander, who may be active participants in the markets, investments or strategies referred to herein and/or may receive compensation from investment banking and non-investment banking services from entities mentioned herein. Santander may trade as principal, make a market or hold positions in instruments (or related derivatives) and/or hold financial interest in entities discussed herein. Santander may provide market commentary or trading strategies to other clients or engage in transactions which may differ from views expressed herein. Santander may have acted upon the contents of this publication prior to you having received it.
This publication is intended for the exclusive use of the recipient and must not be reproduced, redistributed or transmitted, in whole or in part, without Santander’s consent. The recipient agrees to keep confidential at all times information contained herein.


