Uncategorized
March 2021 return attribution summary
admin | April 9, 2021
This document is intended for institutional investors and is not subject to all of the independence and disclosure standards applicable to debt research reports prepared for retail investors. This material does not constitute research.
Continued rate turbulence largely defined performance in the investment grade index, as March total return was -1.72% for the second consecutive month. Credit spreads rallied by 4 bp in aggregate to generate a positive 0.29% credit return, but not nearly enough to offset the sell-off in Treasuries. Highlights include a massive tightening by AT&T which helped drive communications to be the top performing sector for the month, and the ongoing recovery story in GE.
There are no changes to our sector weightings this month. Current positions reflect our expectations for a more rapid global economic recovery in 2021 than the market is currently anticipating. A summary of how APS expects sectors within the IG Index to perform for the next several months on an excess return basis (total return net of commensurate UST return) is shown in Exhibits 1 and 2. These weightings serve as a proxy for how portfolio managers should position their holdings relative to the broad IG corporate bond market.
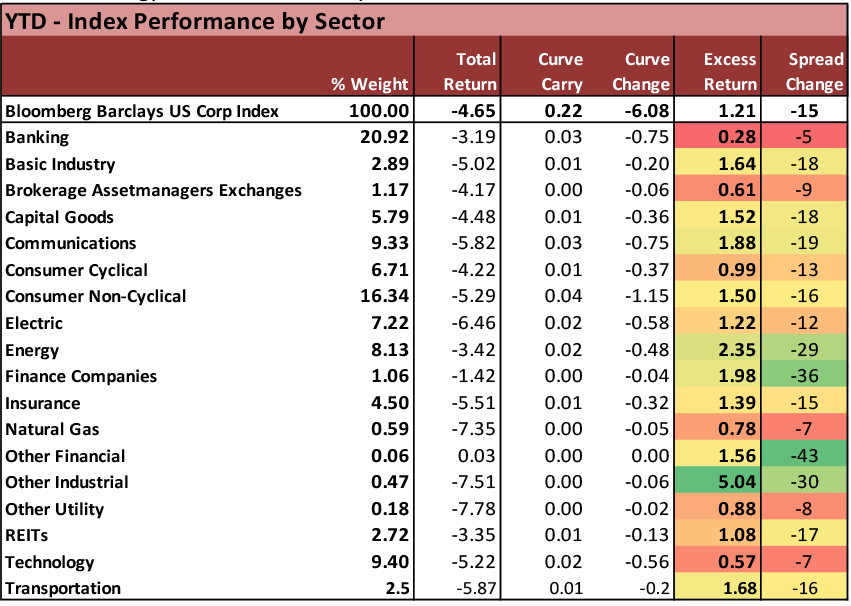
Exhibit 1 and 2. APS Sector Recommendations for April 2021

Source: Amherst Pierpont Securities, Bloomberg/Barclays US Corp Index

Source: Amherst Pierpont Securities, Bloomberg/Barclays US Corp Index
Communications (1.09% credit return) was the top performing sector in the index for March, led in part by extraordinary tightening in AT&T (T: Baa2/BBB/BBB+) credit throughout the month as well as the better spread performance among longer-dated segments of the market. Also among the top 5 performances were finance companies (0.85%), energy (0.70%), consumer non-cyclicals (0.57%) and transportation (0.49%). Top performing issuers for the month included airlines, healthcare facilities, select retailers (such as KSS) and the continued recovery story in General Electric (GE: Baa1/BBB+*+/BBB) – which received a huge bump from the announcement of the sale of GECAS (APS Strategy – GE sale of GECAS), and plans to use proceeds for debt reduction. The weaker sector performances were mostly delivered by financials, with banking (-0.23%), brokers/asset managers (-0.11%), and REITs (-0.06%) and insurance (0.19%) all among the bottom 5 sectors in March.
The IG new issue calendar came in well above expectations for $135 billion with $194 billion is total aggregate supply for the month. The grand total was bolstered by several jumbo deals that priced in March, particularly the landmark $25 billion debt launch from Verizon (VZ: Baa1/BBB+/A-), a $15 billion deal from Oracle (ORCL: Baa2/A/BBB+), and $10 billion in USD debt from Siemens AG (SIEGR: A1/A+). Despite the strong showing from issuers, the debt total came well short of the prior year month when backstopping from the Fed fueled a deluge of issuance in the early phases of the pandemic last year. High yield added an impressive $63 billion in March, and now accounts for the full amount of year-over-year growth in the total corporate bond market year-to-date.
Exhibit 3. Supply Recap – Jumbo deals help top estimates for the month

Source: Bloomberg LP
Exhibit 4. Financials are the clear loser in March as rate turbulence creates a mixed bag among the monthly winners

Source: Bloomberg Barclays US Corp Index
Exhibit 5. Credit preference somewhat mixed as investors sought safety of AAs but were not immune to BBB risk

Source: Bloomberg Barclays US Corp Index
Exhibit 6. Once again, the long-end of the curve sees the most spread compression as rates continued to sell off

Source: Bloomberg Barclays US Corp Index
Exhibit 7. Airlines and Healthcare facilities shine while Financials largely among the mixed group of bottom performers

Source: Bloomberg Barclays US Corp Index
Exhibit 8. Energy trade has remained prominent YTD
Source: Bloomberg Barclays US Corp Index
Exhibit 9. Investors seeking higher yielding, lower rated credits YTD

Source: Bloomberg Barclays US Corp Index
Exhibit 10. Treasuries sell-off has heavily influenced spreads YTD

Source: Bloomberg Barclays US Corp Index
Exhibit 11. Airline credits lead the charge

Source: Bloomberg Barclays US Corp Index
This material is intended only for institutional investors and does not carry all of the independence and disclosure standards of retail debt research reports. In the preparation of this material, the author may have consulted or otherwise discussed the matters referenced herein with one or more of SCM’s trading desks, any of which may have accumulated or otherwise taken a position, long or short, in any of the financial instruments discussed in or related to this material. Further, SCM may act as a market maker or principal dealer and may have proprietary interests that differ or conflict with the recipient hereof, in connection with any financial instrument discussed in or related to this material.
This message, including any attachments or links contained herein, is subject to important disclaimers, conditions, and disclosures regarding Electronic Communications, which you can find at https://portfolio-strategy.apsec.com/sancap-disclaimers-and-disclosures.
Important Disclaimers
Copyright © 2024 Santander US Capital Markets LLC and its affiliates (“SCM”). All rights reserved. SCM is a member of FINRA and SIPC. This material is intended for limited distribution to institutions only and is not publicly available. Any unauthorized use or disclosure is prohibited.
In making this material available, SCM (i) is not providing any advice to the recipient, including, without limitation, any advice as to investment, legal, accounting, tax and financial matters, (ii) is not acting as an advisor or fiduciary in respect of the recipient, (iii) is not making any predictions or projections and (iv) intends that any recipient to which SCM has provided this material is an “institutional investor” (as defined under applicable law and regulation, including FINRA Rule 4512 and that this material will not be disseminated, in whole or part, to any third party by the recipient.
The author of this material is an economist, desk strategist or trader. In the preparation of this material, the author may have consulted or otherwise discussed the matters referenced herein with one or more of SCM’s trading desks, any of which may have accumulated or otherwise taken a position, long or short, in any of the financial instruments discussed in or related to this material. Further, SCM or any of its affiliates may act as a market maker or principal dealer and may have proprietary interests that differ or conflict with the recipient hereof, in connection with any financial instrument discussed in or related to this material.
This material (i) has been prepared for information purposes only and does not constitute a solicitation or an offer to buy or sell any securities, related investments or other financial instruments, (ii) is neither research, a “research report” as commonly understood under the securities laws and regulations promulgated thereunder nor the product of a research department, (iii) or parts thereof may have been obtained from various sources, the reliability of which has not been verified and cannot be guaranteed by SCM, (iv) should not be reproduced or disclosed to any other person, without SCM’s prior consent and (v) is not intended for distribution in any jurisdiction in which its distribution would be prohibited.
In connection with this material, SCM (i) makes no representation or warranties as to the appropriateness or reliance for use in any transaction or as to the permissibility or legality of any financial instrument in any jurisdiction, (ii) believes the information in this material to be reliable, has not independently verified such information and makes no representation, express or implied, with regard to the accuracy or completeness of such information, (iii) accepts no responsibility or liability as to any reliance placed, or investment decision made, on the basis of such information by the recipient and (iv) does not undertake, and disclaims any duty to undertake, to update or to revise the information contained in this material.
Unless otherwise stated, the views, opinions, forecasts, valuations, or estimates contained in this material are those solely of the author, as of the date of publication of this material, and are subject to change without notice. The recipient of this material should make an independent evaluation of this information and make such other investigations as the recipient considers necessary (including obtaining independent financial advice), before transacting in any financial market or instrument discussed in or related to this material.


