By the Numbers
Built-for-rent likely to drive growth of single-family rentals
This material is a Marketing Communication and does not constitute Independent Investment Research.
A collision between limited supply and rising demand for single-family housing is creating a new opening for the single-family rental market. Institutional SFR operators and investors have already earmarked $10 billion of equity for built-for-rent programs. A 3-to-1 leverage ratio typical for the sector implies operators could raise $30 billion of debt financing in 2021-2022 with a further ramp up in the following years.
Outstanding public financing for SFR currently totals $26 billion, all backed by portfolios of existing properties. The footprint of institutional SFR operators has grown to 2% of single-family rental homes, but their ability to respond to the sharp increases in demand is complicated by a housing shortage that has been building for a decade. The response in the industry, as discussed in Ten Billion Reasons Why There Is A Built-For-Rent Land Rush, has been for SFR equity investors to seek out opportunities to build homes for rent instead of competing to purchase existing homes (Exhibit 1).
Exhibit 1: Major capital firms’ investments in built-for-rent in 2020
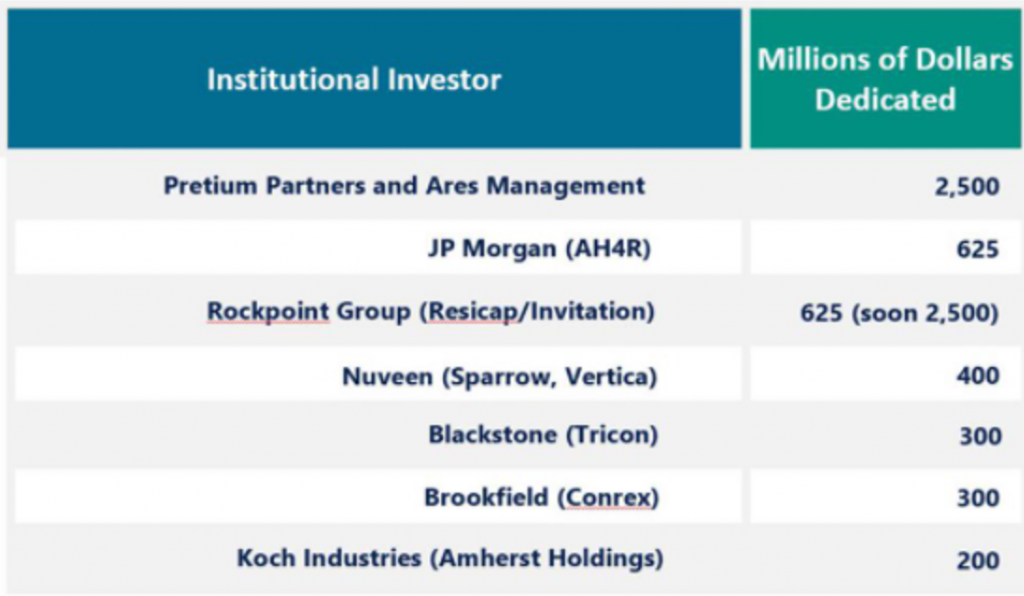
Note: Equity funds earmarked during 2020 for SFR/BFR in millions of dollars. The total equity deployment for 2021 will be over $10 billion, according to projections by Hunter Housing Economics.
Source: Hunter Housing Economics and CBRE Research
Major homebuilders such as Toll Brothers and Lennar Homes have formed joint ventures with financial partners and institutional SFR operators to invest in the built-for-rent (BFR) space. Others are known to be in discussions or have plans to build rental communities in multiple markets.
A housing shortage exacerbated by the pandemic
New household formation has averaged 1.2 million per year over the past 20 years. Census Bureau projections are that the pace of new household formation should increase to 1.5 million a year over the next decade as millennials and generation Z move out of their parent’s homes and form households of their own. The pandemic actually triggered a 128,000 contraction in the number of households from 2019 to 2020 – the first outright drop in household formation since the Census Bureau began estimating the data in 1940.
A U.S. housing shortage has been developing ever since the pace of new single-family home construction fell dramatically during the housing crisis as home sales plunged (Exhibit 2). Prior to the pandemic the housing market was already facing a shortage of 2.5 million units, particularly in the low- to moderate-income categories favored by first time homebuyers. In a December 2018 research report, The Major Challenges of Inadequate U.S. Housing Supply, Freddie Mac analysts identified two reasons for the low level of housing production relative to the population:
- An increase in home building costs, driven higher by both the cost of land and regulatory costs due to zoning restrictions on lot sizes, building height and open space designations; and
- A shortage of skilled labor.
Local opposition by residents to new and affordable home developments in many communities put further restrictions on new construction.
The slow pace of home building still remains the logjam. After a decade of gradually increasing, total new single-family home construction recently broke 600,000 units per year, still below the 650,000 units of new supply averaged during the early 2000s.
Exhibit 2: New and existing single-family home sales and new homes under construction
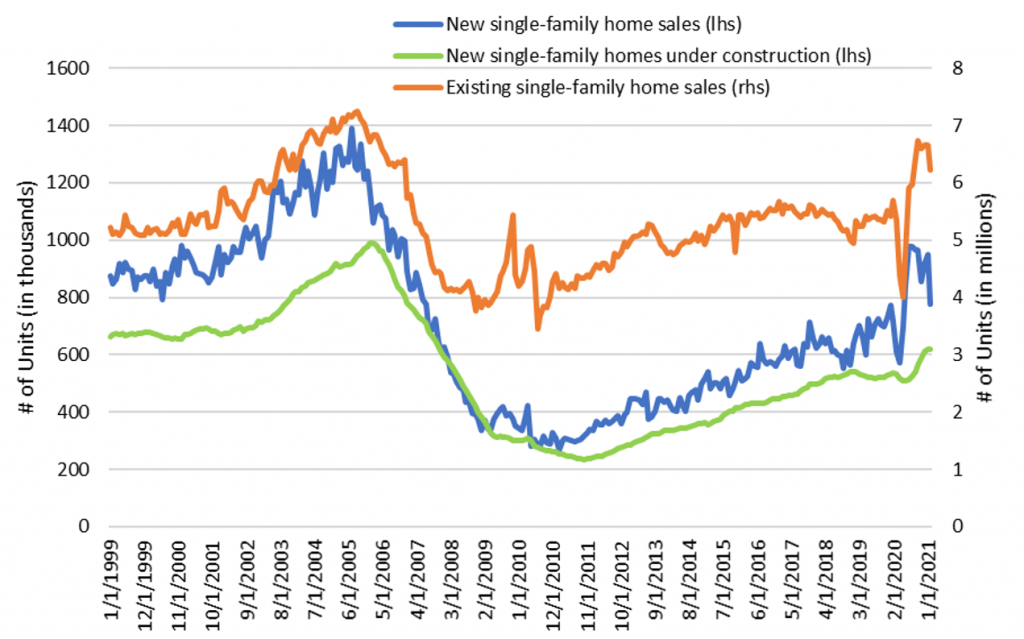
Note: Number of units at a seasonally adjusted annualized rate.
Source: US Census Bureau, National Association of Realtors, Bloomberg, Amherst Pierpont Securities
The estimated housing deficit rises from 2.5 million to 3.3 million units when considering only those states that have a shortage of supply. States like West Virginia, Alabama, North Dakota and Ohio, where the population has decreased, have faced increasing vacancy rates amid a relative surplus of housing. Those surplus units cannot balance out the intensifying supply shortage in states such as California, Texas, Florida, Oregon and Colorado. Twenty-nine states have a net deficit of housing supply, while 21 states are oversupplied, according to the report. The high costs of housing in the states with a significant shortage are hitting young adults the hardest – driving up home prices and constraining household formation.
The housing shortage in single-family homes is particularly acute as the pandemic accelerated home purchases. The inventory of existing single-family homes for sale dropped to a historic low of two month’s supply in January 2021, while the inventory of new single-family homes for sale rebounded slightly off a recent low of 3.5 months to 4.8 months (Exhibit 3).
Exhibit 3: Inventory of single-family homes for sale (month’s supply)
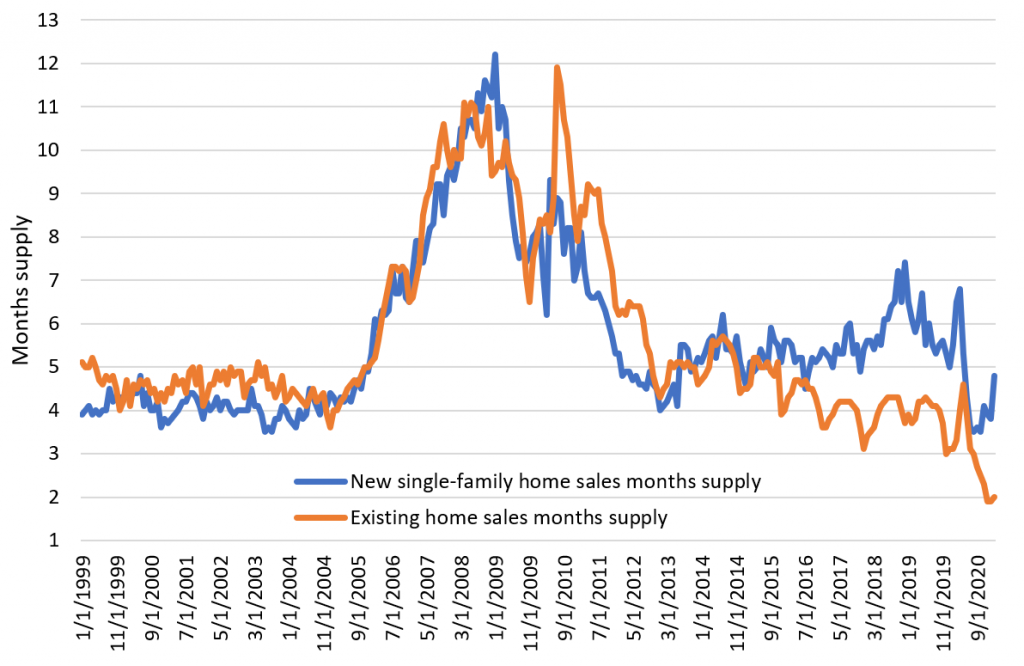
Source: US Census Bureau, National Association of Realtors, Bloomberg, Amherst Pierpont Securities
A strong trend towards renting exacerbated by the pandemic
Since 2007 there has been a 25% increase in the number of rental households compared to a 4% increase in owner households, according to Census Bureau data. This was primarily the result of the decline in the homeownership rate from a June 2004 peak of 69.2% to a local June 2016 trough of 62.9%. Before the pandemic the homeownership rate had rebounded to just above 65% but the majority of new household formation was going straight into rental housing. Moreover, many renters found themselves shut out of homeownership.
The problem is that the tightening of mortgage credit in response to the financial crisis never abated (Exhibit 4). Subprime mortgage originations – those for borrowers with credit scores below 660 (blue and yellow bars) – remain a small fraction of total volume.
Exhibit 4: Mortgage originations by credit score*
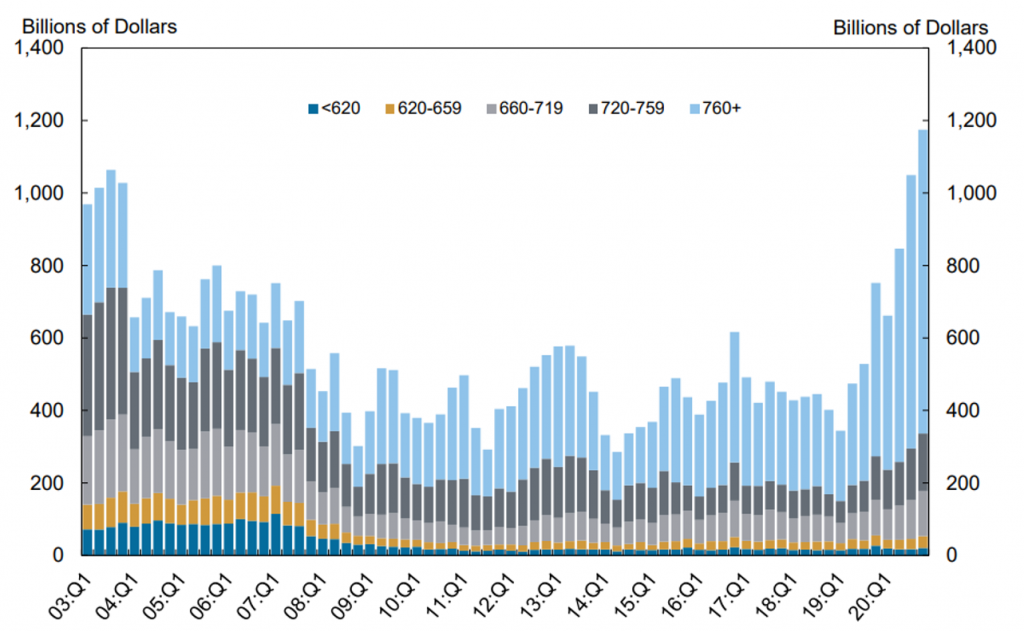
Note: *Credit score is Equifax Riskscore 3.0. Data through the fourth quarter of 2020.
Source: New York Fed Consumer Credit Panel/Equifax, from Quarterly Report on Household Debt and Credit (page 6, as numbered).
This tightening of credit accelerated during the pandemic, as record low mortgage rates and a huge surge in demand for single-family homes drove home price appreciation up by 12% in 2020. This put homeownership even further out of reach for those without stellar credit. The credit scores for mortgage originations rose across all percentiles, with the average credit score for even the lowest 10 percent of borrowers rising from 650 to 690 (Exhibit 5). The rise in credit scores is partially due to the impact of the government stimulus payments: many households chose to pay down credit cards and reduce consumer debt outstanding. Unfortunately, this did not increase the share of mortgage originations to borrowers with lower credit scores.
Exhibit 5: Credit score at mortgage* origination
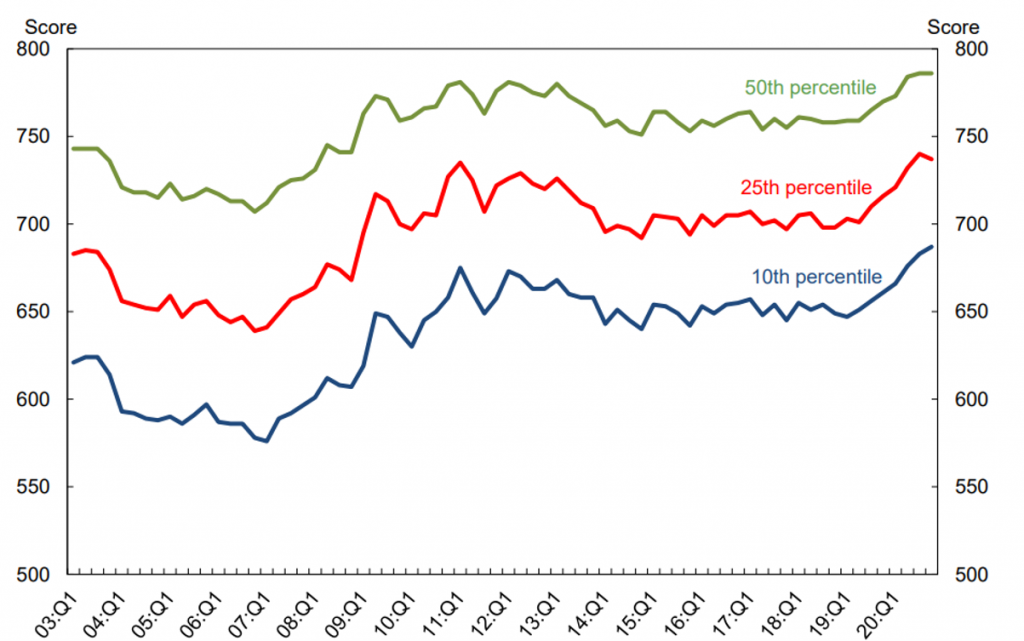
Note: *Credit score is Equifax Riskscore 3.0. Data through the fourth quarter of 2020.
Source: New York Fed Consumer Credit Panel/Equifax, from Quarterly Report on Household Debt and Credit (page 7, as numbered).
Outlook for single-family rentals
The combination of the housing shortage and tight mortgage credit should keep homeownership out of reach of many households as the pace of new household formation rises. The trend towards less urban living in large multifamily buildings and towards single-family rentals will likely persist even as the pandemic recedes as more companies accommodate flexible work arrangements. The ability of institutional SFR operators and BFR programs to scale up rapidly and respond to the demand should become visible over the next few years. This will hopefully provide a supply of high quality, consistently priced, well-managed properties in the suburbs or exurbs of high demand areas to provide affordable housing options for those locked out of homeownership or who prefer to rent.
This material is intended only for institutional investors and does not carry all of the independence and disclosure standards of retail debt research reports. In the preparation of this material, the author may have consulted or otherwise discussed the matters referenced herein with one or more of SCM’s trading desks, any of which may have accumulated or otherwise taken a position, long or short, in any of the financial instruments discussed in or related to this material. Further, SCM may act as a market maker or principal dealer and may have proprietary interests that differ or conflict with the recipient hereof, in connection with any financial instrument discussed in or related to this material.
This message, including any attachments or links contained herein, is subject to important disclaimers, conditions, and disclosures regarding Electronic Communications, which you can find at https://portfolio-strategy.apsec.com/sancap-disclaimers-and-disclosures.
Important Disclaimers
Copyright © 2026 Santander US Capital Markets LLC and its affiliates (“SCM”). All rights reserved. SCM is a member of FINRA and SIPC. This material is intended for limited distribution to institutions only and is not publicly available. Any unauthorized use or disclosure is prohibited.
In making this material available, SCM (i) is not providing any advice to the recipient, including, without limitation, any advice as to investment, legal, accounting, tax and financial matters, (ii) is not acting as an advisor or fiduciary in respect of the recipient, (iii) is not making any predictions or projections and (iv) intends that any recipient to which SCM has provided this material is an “institutional investor” (as defined under applicable law and regulation, including FINRA Rule 4512 and that this material will not be disseminated, in whole or part, to any third party by the recipient.
The author of this material is an economist, desk strategist or trader. In the preparation of this material, the author may have consulted or otherwise discussed the matters referenced herein with one or more of SCM’s trading desks, any of which may have accumulated or otherwise taken a position, long or short, in any of the financial instruments discussed in or related to this material. Further, SCM or any of its affiliates may act as a market maker or principal dealer and may have proprietary interests that differ or conflict with the recipient hereof, in connection with any financial instrument discussed in or related to this material.
This material (i) has been prepared for information purposes only and does not constitute a solicitation or an offer to buy or sell any securities, related investments or other financial instruments, (ii) is neither research, a “research report” as commonly understood under the securities laws and regulations promulgated thereunder nor the product of a research department, (iii) or parts thereof may have been obtained from various sources, the reliability of which has not been verified and cannot be guaranteed by SCM, (iv) should not be reproduced or disclosed to any other person, without SCM’s prior consent and (v) is not intended for distribution in any jurisdiction in which its distribution would be prohibited.
In connection with this material, SCM (i) makes no representation or warranties as to the appropriateness or reliance for use in any transaction or as to the permissibility or legality of any financial instrument in any jurisdiction, (ii) believes the information in this material to be reliable, has not independently verified such information and makes no representation, express or implied, with regard to the accuracy or completeness of such information, (iii) accepts no responsibility or liability as to any reliance placed, or investment decision made, on the basis of such information by the recipient and (iv) does not undertake, and disclaims any duty to undertake, to update or to revise the information contained in this material.
Unless otherwise stated, the views, opinions, forecasts, valuations, or estimates contained in this material are those solely of the author, as of the date of publication of this material, and are subject to change without notice. The recipient of this material should make an independent evaluation of this information and make such other investigations as the recipient considers necessary (including obtaining independent financial advice), before transacting in any financial market or instrument discussed in or related to this material.
Important disclaimers for clients in the EU and UK
This publication has been prepared by Trading Desk Strategists within the Sales and Trading functions of Santander US Capital Markets LLC (“SanCap”), the US registered broker-dealer of Santander Corporate & Investment Banking. This communication is distributed in the EEA by Banco Santander S.A., a credit institution registered in Spain and authorised and regulated by the Bank of Spain and the CNMV. Any EEA recipient of this communication that would like to affect any transaction in any security or issuer discussed herein should do so with Banco Santander S.A. or any of its affiliates (together “Santander”). This communication has been distributed in the UK by Banco Santander, S.A.’s London branch, authorised by the Bank of Spain and subject to regulatory oversight on certain matters by the Financial Conduct Authority (FCA) and the Prudential Regulation Authority (PRA).
The publication is intended for exclusive use for Professional Clients and Eligible Counterparties as defined by MiFID II and is not intended for use by retail customers or for any persons or entities in any jurisdictions or country where such distribution or use would be contrary to local law or regulation.
This material is not a product of Santander´s Research Team and does not constitute independent investment research. This is a marketing communication and may contain ¨investment recommendations¨ as defined by the Market Abuse Regulation 596/2014 ("MAR"). This publication has not been prepared in accordance with legal requirements designed to promote the independence of research and is not subject to any prohibition on dealing ahead of the dissemination of investment research. The author, date and time of the production of this publication are as indicated herein.
This publication does not constitute investment advice and may not be relied upon to form an investment decision, nor should it be construed as any offer to sell or issue or invitation to purchase, acquire or subscribe for any instruments referred herein. The publication has been prepared in good faith and based on information Santander considers reliable as of the date of publication, but Santander does not guarantee or represent, express or implied, that such information is accurate or complete. All estimates, forecasts and opinions are current as at the date of this publication and are subject to change without notice. Unless otherwise indicated, Santander does not intend to update this publication. The views and commentary in this publication may not be objective or independent of the interests of the Trading and Sales functions of Santander, who may be active participants in the markets, investments or strategies referred to herein and/or may receive compensation from investment banking and non-investment banking services from entities mentioned herein. Santander may trade as principal, make a market or hold positions in instruments (or related derivatives) and/or hold financial interest in entities discussed herein. Santander may provide market commentary or trading strategies to other clients or engage in transactions which may differ from views expressed herein. Santander may have acted upon the contents of this publication prior to you having received it.
This publication is intended for the exclusive use of the recipient and must not be reproduced, redistributed or transmitted, in whole or in part, without Santander’s consent. The recipient agrees to keep confidential at all times information contained herein.


