


The Big Idea
Better returns in lower tiers of credit
Steven Abrahams | March 26, 2021
This material is a Marketing Communication and does not constitute Independent Investment Research.
The next leg of spread recovery is likely to come in lower rated tiers of corporate and structured credit. Most investment grade debt today trades tighter than pre-pandemic marks, but lower rated debt still trades wide. That points to the imprint of heavy flows from regulated investors. The crowding of capital into investment grade debt leaves better risk-adjusted returns in the lower tiers.
IG trades inside pre-pandemic spreads, HY trades wide
Stronger credits have almost all rebounded from pandemic. The average ‘AAA’ corporate, for example, trades inside its tightest February 2020 mark by 4 bp, the average ‘AA’ trades wider by 7 bp, the average ‘A’ wider by 2 bp and the average ‘BBB’ tighter by 7 bp (Exhibit 1). Speculative grade names are not even close. The average ‘BB’ trades wider by 58 bp and the average ‘B’ wider by 39 bp.
Exhibit 1: IG spreads have rebounded from pandemic while HY still trades wide
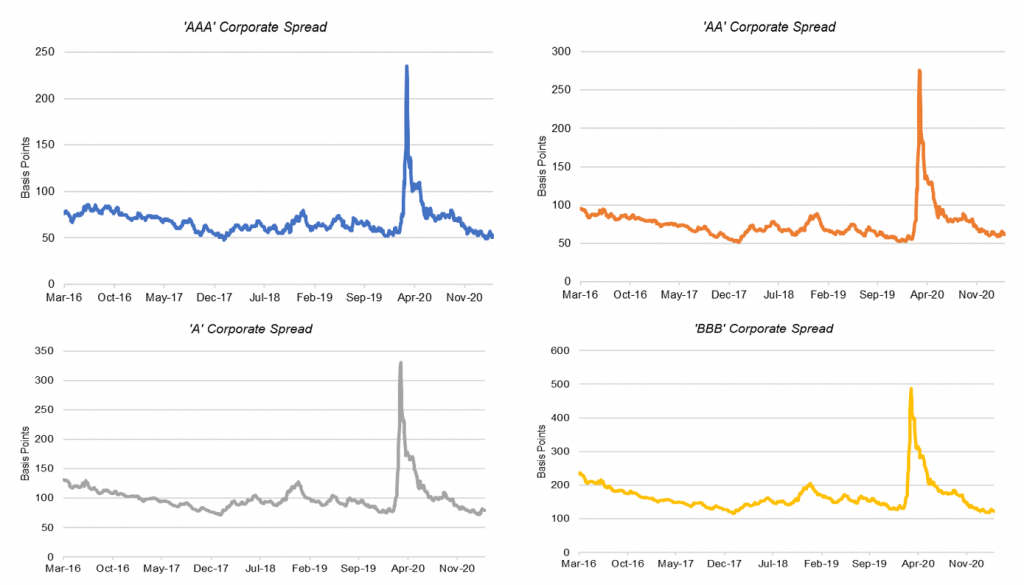
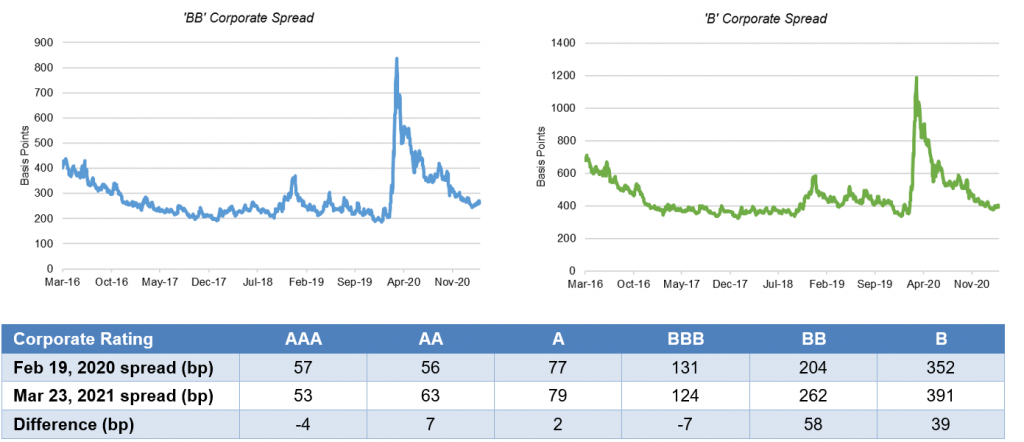
Source: ICE BofA US Corporate OAS from FRB St. Louis, Amherst Pierpont Securities
Spreads do not line up with equity vol
Given where equity volatility is, spreads inside of pre-pandemic tights makes no sense. Implied equity volatility measured by the VIX lately is near 20 compared to levels last February near 14—so tighter spreads in corporate credit would come as a surprise to anyone just looking at the VIX. Equity options say the risk to corporate earnings and valuations is higher today than before pandemic, implying all corporate spreads should be wider.
But spreads do line up with investor flows
The VIX obviously is not the whole picture, and spreads instead show the likely impact of capital flows biased toward investment grade debt (Exhibit 2). Insurers last year were the single largest marginal investor in corporate debt, and insurer capital treatment favors investment grade over speculative grade debt. ‘AAA’ through ‘A’ debt requires 40 bp in pre-tax capital for a life insurer, ‘BBB’ debt 130 bp and ‘BB’ debt 430 bp and ‘B’ 1000 bp. P&C capital is not as punitive, but it still leans strongly toward investment grade. Mutual funds, closed end funds and ETFs bought the second largest block of corporate debt last year. In aggregate, funds allocate across fixed income in proportion to outstanding debt, so the second largest flow last year was likely a neutral influence on spreads. And marginal flows from the rest of the world likely reflects a mix of insurers biased toward investment grade debt and funds with an aggregate neutral impact.
Exhibit 2: Changes in investor corporate debt exposure in 2020
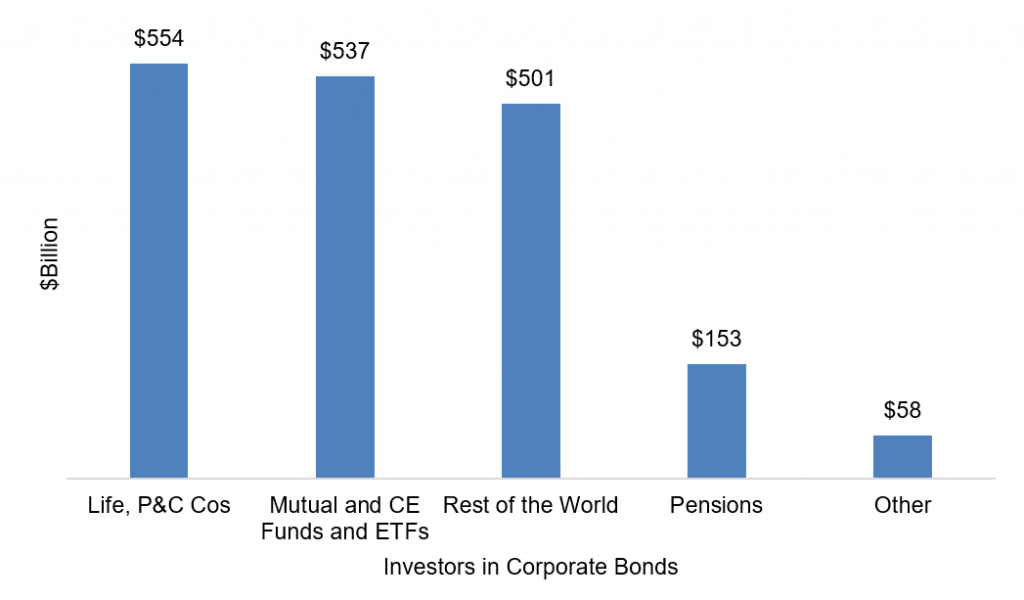
Note: Data show 1Y change in market value of corporate holdings.
Source: CreditSights, Inc., all rights reserved, Amherst Pierpont Securities
With regulatory capital crowded into investment grade debt, speculative grade should have better risk-adjusted return. With speculative grade debt also more leveraged to the course of the economy, the high likelihood of upside surprise to growth in 2021 and 2022 should help, too.
CLOs also have rebounded, although ‘BB; is notably wide
In one area of structured credit with long and transparent spread history, the CLO market, the split between investment grade and speculative grade also shows up, although ‘BBB’ CLO debt is notably wide. CLO debt historically trades wide to corporate debt with the same rating, arguably a concession for a narrower investor base, less liquidity, and, in the case of investment grade debt, the callability of the CLO debt. In all rating categories except ‘BBB’, CLO spreads to corporate debt now sit at or inside the spreads of February 2020 (Exhibit 3).
Exhibit 3: CLOs have also rebounded from pandemic with ‘BBB’ an outlier wide
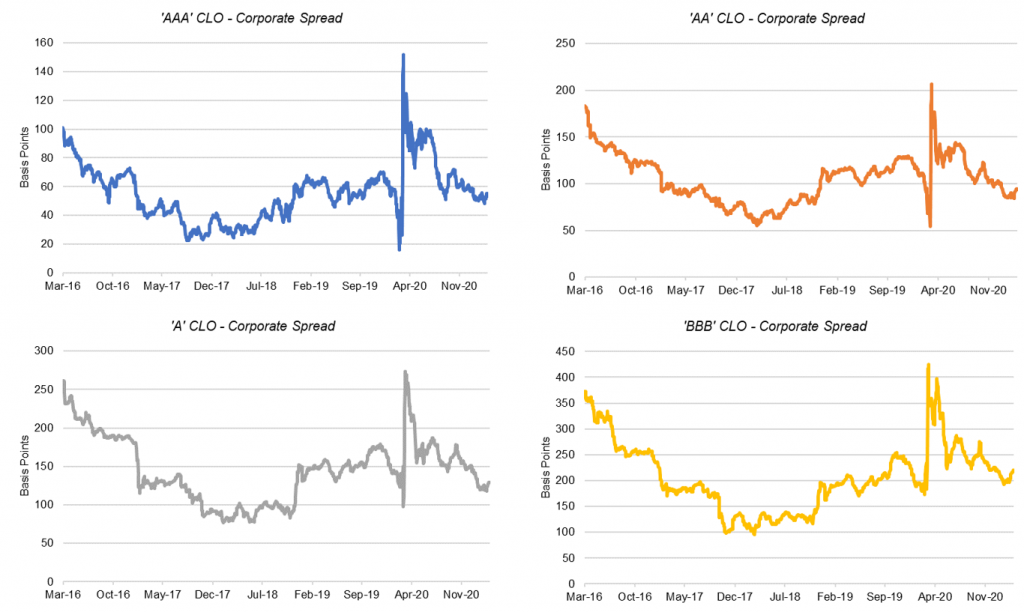
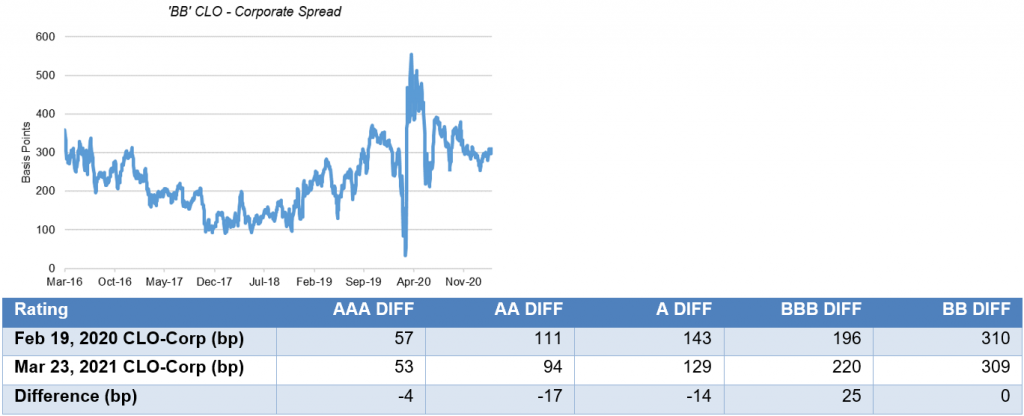
Note: Data show difference between CLO discount margin and corporate OAS in the same rating category.
Source: ICE BofA US Corporate OAS from FRB St. Louis, Amherst Pierpont Securities
Regulated capital again is the largest investor in investment grade CLOs. Banks invest in ‘AAA’ with insurers in ‘AAA’ through ‘BBB.’ Asset managers play across all rating categories with hedge funds concentrated in ‘BB’, ‘B’ and equity. Lower rated CLO debt should outperform higher rated.
With the most transparent credit spreads largely back to pre-pandemic levels, investors can go around the table on whether the market has fully priced in potential growth and earnings upside. But one thing that is clearly different is the efforts of the Fed. QE and its knock-on fueling of bank investment will almost surely absorb the market’s safest assets for the balance of this year and crowd remaining capital into risks a tier or two above their normal habitat. The lower tiers of credit should see some of that new capital and should outperform higher rated debt.
* * *
The view in rates
The rates markets will likely be a little nervous until the Fed tips its hand on SLR. The Fed will likely carve reserves out of the calculation for SLR but leave Treasury debt in. The weighted average maturity of bank Treasury holdings through September stood at 3.6 years, so the belly of the curve has the most exposure.
The 10-year note has finished the most recent session at 1.67%, a bit lower than a week ago and solidly in the middle of the expected range of 1.50% to 1.95% for the balance of the year. My colleague, Stephen Stanley, is expecting extraordinary growth and inflation pressure this year, a start to tapering in October and Fed liftoff by the spring of 2022. If that unfolds, the 10-year note could jump above 2.00%. Equilibrium is probably at 2.50%, but that should take much more evidence of sustainable growth and inflation beyond the surge anticipated as pandemic ends and monetary and fiscal policy kick in.
The Treasury yield curve has finished its most recent session with 2s10s at 151 bp, only 3 bp flatter than a week ago. The 5s30s curve has bounced sideways since mid-February. As 30-year rates approach 2.50%, they should have less room to move up, and the 5s30 curve should start to flatten. Inflation expectations measured by the spread between 10-year notes and TIPS have moved up a bit over the last week to 236 bp, a new high for the last five years. Real rates have bounced sideways through March. Volatility has jumped back above levels last seen around the elections in November and back to levels of last April.
A heavy supply of cash continues to reduce repo rates, Treasury bill yields and LIBOR. SOFR recently printed at 1 bp.
The view in spreads
MBS spreads should be much more volatile than credit spreads until banks get solidly back to the business of buying. MBS duration has nearly doubled from 2 years at the start of February to 4 years lately, leaving many banks more exposed to interest rate risk than preferred and inclined to rebalance by reinvesting in cash assets. That takes a strong bid out of the MBS market. Spreads should eventually tighten back towards pre-February levels as a heavy flow of cash forces banks back into their usual habitat. In credit, support from insurers and money managers should keep spreads tightening. The new $1.9 trillion round of fiscal stimulus, easy monetary policy and a narrowing pandemic should start showing up in growth and earnings over the next few quarters. Weaker credits should outperform stronger credits, with high yield topping investment grade debt and both topping safe assets such as agency MBS and Treasury debt. The consumer balance sheets has come out of 2020 stronger than ever—at leave on average—and consumer credit should outperform corporate credit.
The view in credit
Consumers in aggregate are coming out of 2020 with a $12 trillion surge in net worth. Aggregate savings are up, home values are up and investment portfolios are up. Consumers have not added much debt. Although there is an underlying distribution of haves and have nots, the aggregate consumer balance sheet is strong. Corporate balance sheets have taken on substantial amounts of debt and will need earnings to rebound for either debt-to-EBITDA or EBITDA-to-interest-expense to drop back to better levels. Credit should improve as warmer weather and better vaccine distribution allows more opening of economic activity. Distribution and vaccine uptake through the end of 2021 should put a floor on fundamental risk with businesses and households most affected by pandemic—personal services, restaurants, leisure and entertainment, travel and hotels—bouncing back the most.
The original version of this article mistakenly indicated notably wide spreads on ‘BB’ CLO debt. Corrected to ‘BBB’ CLO debt on 3/29/2021 at 8:23a ET.