


The Big Idea
Messages from the rates markets
Steven Abrahams | March 12, 2021
This document is intended for institutional investors and is not subject to all of the independence and disclosure standards applicable to debt research reports prepared for retail investors. This material does not constitute research.
The rates markets have had a lot to say lately about inflation, the Fed, the returns available for taking interest rate risk and whether any of it will keep up with the cost of a good cup of coffee, among other things. The messages are in breakeven spreads, futures, forwards, term premiums and real rates. And they imply a rate range, the next phase in the yield curve and point to strategies for covering that cup of coffee.
Inflation will follow the arc of Fed policy
The market view of inflation follows an arc the Fed first laid out last year, one should keep rates from rising materially above the Fed’s targeted neutral rate of 2.50%. The inflation view comes in three easy pieces (Exhibit 1):
- The spread between 5-year Treasury notes and TIPS says the market expects inflation over the next five years to average 258 bp.
- The spread between 10-year notes and TIPS says the market expects inflation over the next 10 years to average 227 bp.
- And those benchmarks imply 5-year inflation starting five years from now should average 207 bp.
For anyone sitting in a Fed chair, that is a beautiful story and good reason for the Fed to remain aggressively easy until expectations for 5-year inflation five years from now go much higher, possibly to 225 bp or more.
Exhibit 1: Implied 5- and 10-year inflation, and 5-year forward 5-year inflation
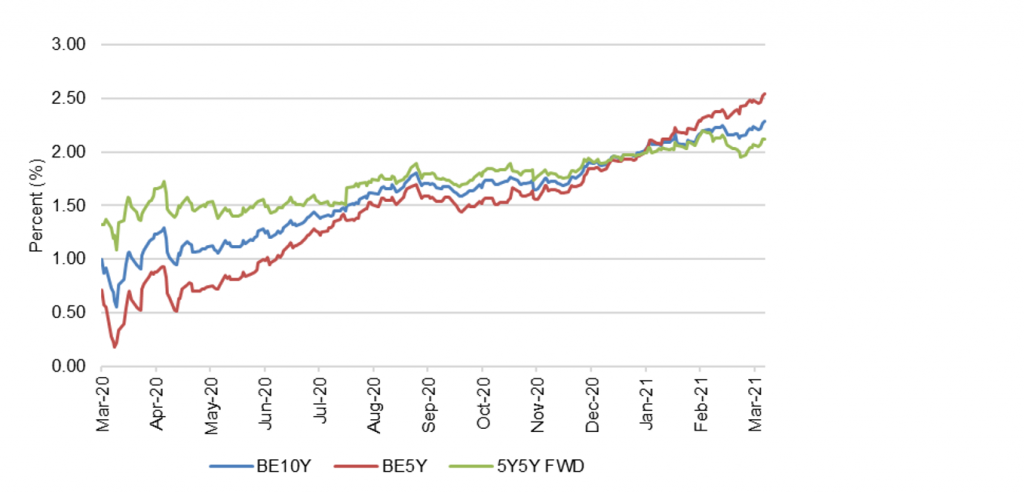
Note: Data through 11 Mar 2021.
Source: Bloomberg, Amherst Pierpont Securities
That inflation rainbow follows the story of flexible average inflation targeting first told by the Fed last year at Jackson Hole. Inflation over the next few years will run above the Fed’s 2% target, the story goes, as the Fed focuses on shortfalls in employment. But after running above target for a while, the Fed’s tools of rate hikes and balance sheet normalization will bring inflation back home. The inflation markets first adjusted expectations up late last August just after Jackson Hole. Since US elections last November, the market increasingly has bought the Fed’s willingness for inflation to rise—helped, no doubt, by $5.5 trillion in fiscal stimulus over the last year—and the Fed’s ability and willingness to eventually hammer higher rates of inflation back down.
The market does expect the Fed to tighten sooner than the Fed indicated in the most recent set of dots from last December, and presumably the market expects the Fed to taper in concert. Fed dots imply a Fed on hold through 2023, but fed funds futures on March 11 imply a 74% chance of a hike by the end of 2023 with the OIS curve implying a 174% chance.
Exhibit 2: Both fed funds futures and OIS imply a Fed hike by the end of 2023

Note: fed fund futures on 11 Mar 2021 imply a 74% chance of a hike by the end of 2023, with OIS implied forward rates implying a 174% chance.
Source: Bloomberg, Amherst Pierpont Securities
The Fed has also put a flag in the sand at 2.50% for a terminal value on fed funds, enough to cover 2.00% inflation and a 0.50% real rate, and that should have an important influence on the entire yield curve. It should anchor expectations about the path of short rates, leaving only term premium—compensation left after accounting for the path of short rates—for setting final nominal rates. Term premiums have run low for years, at least based on the Adrian, Crump and Moench model. The premium over the last five years for 2-year Treasury debt has averaged -31 bp, for 5-year debt, -26 bp, and for 10-year debt, -18 bp. The most recent Philly Fed Survey of Professional Forecasters shows an expected average 10-year rate over the next decade of 2.76%, implying a low term premium over the Fed’s neutral rate. Demand for safe, liquid assets has frequently pushed term premiums below zero since the Great Financial Crisis. And perhaps as important, a credible, transparent Fed should lower market premiums for taking interest rate risk over all horizons.
The market’s view of inflation is bad news for the short-maturity curve and good news for the long-maturity curve. Realized inflation and the Fed’s response should make shorter rates much more volatile. Sell out-of-the-money volatility against longer rates through options, caps, callables or MBS. Strikes above 2.50% could look especially interesting. Buy volatility against shorter rates.
Better value in longer rates will flatten the curve
Term premiums also make a case for a yield curve ready to slow the pace of steepening and possibly flatten over the next few months. The 2-year premium stands at -25 bp, the 5-year at 4 bp and the 10-year at 41 bp (Exhibit 3). That is a significant change from as recently as early February, when all were negative. And it is a dramatic change from late 2019 through last fall when the term premium curve was inverted, with premiums that became more negative at longer maturities. The current 66 bp spread between the 10-year and 2-year premiums is 2.2 standard deviations above the average spread over the last five years of 13 bp. And after the spread last approached these levels in late 2016, the 2s10s curve began to flatten.
Exhibit 3: Term premiums have turned positive and steepened in the last month

Note: ACM term premiums.
Source: Bloomberg, Amherst Pierpont Securities
Rising term premiums and the steepening of the premium curve reflect uncertainty about the net impact of easy monetary policy, the fiscal stimulus working its way through the economy over the next year and the easing of pandemic. Investors get paid more to take that risk in 10-year notes than in 5-year, and more in 5-year than in 2-year. The relatively high premiums in the long end of the curve should start to draw investors in, and the relatively low premiums in the short end should start to pull investors out. The move to higher rates should slow in the long end of the curve relative to shorter rates, and the curve should start to flatten in coming months.
Outright flattening positions in rates look expensive in terms of carry and roll down the curve, but investors could mitigate the cost by taking longer key rate risk in spread products—investment grade corporates or MBS—and setting hedges in shorter key rates.
Riskless assets are not as riskless as they seem
Even though positive term premiums imply longer debt will beat returns from simply rolling over short investments, the market also implies that inflation will beat returns along most of the curve except long bonds. Returns for passing on a cup of coffee today and putting the money in Treasuries might not cover that cup at maturity. That is the message in negative real rates on TIPS all along the Treasury curve except for 30-year debt (Exhibit 4). Real yields—yields after stripping out the impact of inflation—have moved sharply higher since the start of February but still stand at -183 bp for 5-year Treasury debt, -76 bp for 10-year and 6 bp for 30-year.
Exhibit 4: Real yields run negative along most of the Treasury curve

Source: Bloomberg, Amherst Pierpont Securities
Real yields went deeply negative before the current episode during Fed QE and easy monetary policy after the Great Financial Crisis, reflecting Fed efforts then to get inflation back to target while effectively holding down rates along the Treasury curve. There’s a little déjà vu. The Fed is now trying to get inflation moderately above target while effectively holding down rates. In that context, negative real rates seem rational.
Riskless rates in this market become a misnomer since inflation is in play. Investors stand to lose buying power and have clear incentives to take risk. That’s especially true with the deeply negative real rates along the front of the curve. Short assets at tight spreads lose to inflation, if the Fed’s game plan for inflation plays out.
Investors should look for risks—credit, prepayment, liquidity, volatility or some combination—sufficient to offset negative real rates. For endowments, pensions and other portfolios that have to fund real expenses, offsetting negative real rates becomes more important. The futher out on the yield curve, the less incremental risk required.
* * *
The view in rates
The 10-year rate for the balance of the year should range between 1.50% and 1.95%, which was exactly its range in the six months before pandemic. Equilibrium is probably at 2.50%, but that should take much more evidence of sustainable growth and inflation. The Biden administration’s $1.9 trillion stimulus package has become law, and the surge of cash and federal spending should continue to push growth and concern about inflation. But much of that is priced in.
The Treasury yield curve has finished its most recent session with 2s10s at 148 bp, a new high for the last five years. The pace of steeping should start to slow. The 5s30s curve has finished its latest session at 154 bp, still down from its recent peak. As 30-year rates approach 2.50%, they should have less room to move up, and the 5s30 curve should start to flatten. Inflation expectations measured by the spread between 10-year notes and TIPS have moved up a bit over the last week to 227 bp, the highest level in five years. Real rates have moved up sharply as nominal rates rise. Volatility has jumped back up to levels last seen around the elections in November, but it is still at the average of the last five years.
A heavy supply of cash continues to reduce repo rates, Treasury bill yields and LIBOR. Yields on 2-year notes have moved a few basis points higher in the last week despite much larger moves up at longer maturities.
The view in spreads
Spreads in credit should start to tighten back towards pre-February levels. The new $1.9 trillion round of fiscal stimulus, easy monetary policy and a narrowing pandemic should start showing up in growth and earnings over the next few quarters. In MBS, rising rates have widened spreads, and uneven bank demand should leave them softer and more volatile than they have been for the last few months. The Treasury cash tsunami should keep short yields low and spreads on highest quality assets tight. Weaker credits should outperform stronger credits, with high yield topping investment grade debt and both topping safe assets such as agency MBS and Treasury debt. Consumer credit should outperform corporate credit.
The view in credit
Consumers in aggregate are coming out of 2020 with a $12 trillion surge in net worth. Aggregate savings are up, home values are up and investment portfolios are up. Consumers have not added much debt. Although there is an underlying distribution of haves and have nots, the aggregate consumer balance sheet is strong. Corporate balance sheets have taken on substantial amounts of debt and will need earnings to rebound for either debt-to-EBITDA or EBITDA-to-interest-expense to drop back to better levels. Credit should improve as warmer weather and better vaccine distribution allows more opening of economic activity. Distribution and vaccine uptake through the end of 2021 should put a floor on fundamental risk with businesses and households most affected by pandemic—personal services, restaurants, leisure and entertainment, travel and hotels—bouncing back the most.