


The Big Idea
The bank response to MBS extension
Steven Abrahams | March 5, 2021
This material is a Marketing Communication and does not constitute Independent Investment Research.
REITs and other leveraged MBS portfolios may get the big headlines when sudden shifts in interest rates set off a scramble to rebalance risk, but the bigger headlines should go to banks. Banks and other depositories hold leveraged MBS portfolios, too. But while REITs and similar portfolios hold 6% of MBS, depositories hold 34%. While REITs take a fast approach to reigning in risk, banks take a slower but no less important one. The move in rates through February has almost certainly triggered bank risk adjustments and should significantly change bank investment activity for the next few months.
A shift in investment activity in coming months
The average bank looks likely to shift its investment activity through March and possibly through May into shorter securities and cash assets. Since banks added more than $515 billion in MBS after March last year and more than $316 billion in Treasury debt, the shift could soften MBS spreads, change demand in the CMO market and help steepen the yield curve. But the shift should be temporary. A tsunami of deposits heading toward bank balance sheets should eventually press banks to invest much the same way they did before February.
The likely shift in bank demand reflects the quick rise in interest rates in February and the extension of MBS duration. The 10-year Treasury rate rose through the month from 1.08% to 1.41%, a 33 bp gain. The Bankrate.com national average 30-year mortgage rate moved from 2.84% to 3.25%, a 41 bp jump. And the duration of the core MBS market moved from 2.20 years to 3.38 years, a 1.18-year extension.
Exhibit 1: The duration of core MBS in February extended by 1.18 years
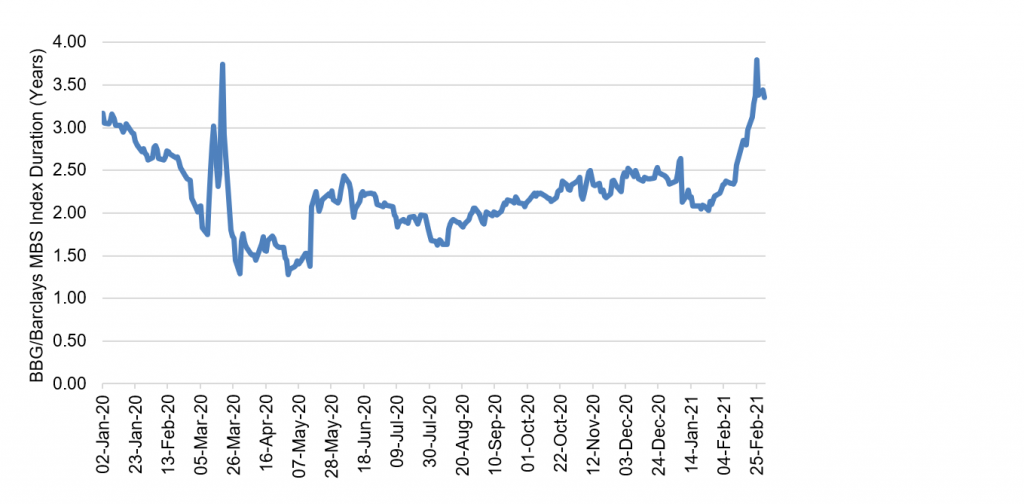
Note: the data show the estimated effective duration of the Bloomberg Barclays MBS Index.
Source: Bloomberg, Amherst Pierpont Securities
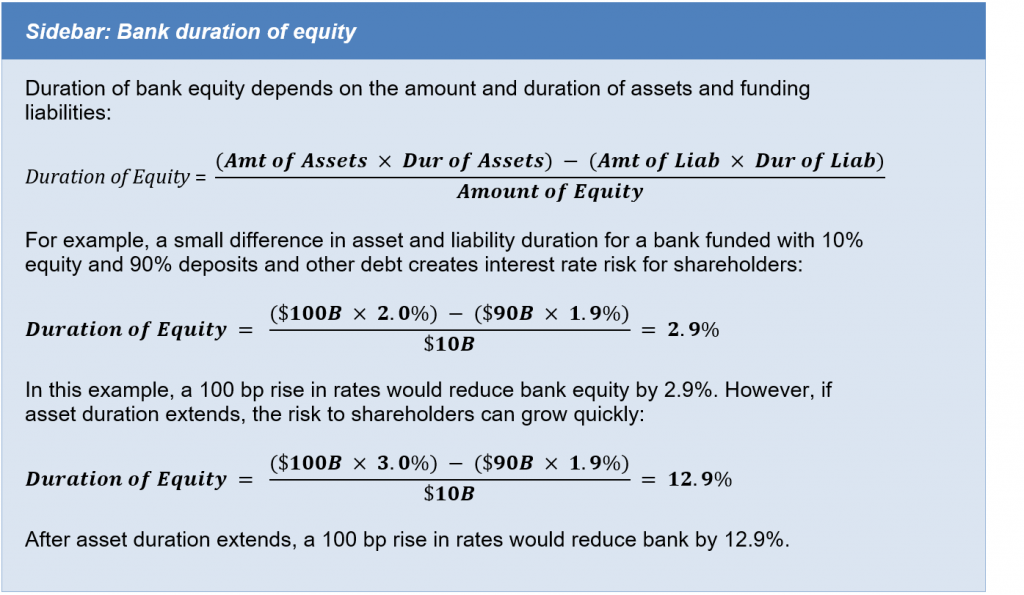
Banks may be offsides on duration of equity
The longer MBS duration has changed a critical part of the risk picture for almost every depository: its duration of equity, or the sensitivity of shareholder capital to shifts in interest rates. Both bank assets and funding liabilities—deposits and other borrowings—shift in value with rates. The combination of asset duration, liability duration and balance sheet leverage can create interest rate risk for the equity (see Sidebar: Bank duration of equity). Banks set a target duration of equity that represents balance sheet tolerance for risk. Since the average bank holds $10.2 of equity for every $100 of assets—a relatively high leverage ratio—the recent rise in MBS duration has likely increased interest rate risk for equity. A further rise in interest rates likely will reduce the value of bank equity much faster than many shareholders want. Some banks have already estimated their exposure while others will get their first picture as the books close on February performance.
Banks can rebalance by letting deposits flow onto the balance sheet
Most banks will respond to this duration extension in part by letting cash and new deposits build up on the balance sheet and by investing in only very short assets. The deposits flow onto the balance with their own duration—negative duration since deposits are a liability. The accumulation of liability duration eventually offsets the extension in MBS.
Bank reliance on accumulating negative deposit duration stands in sharp contrast to REITs and other leveraged MBS portfolios that use market value hedges. A REIT could sell short Treasury debt, sell Treasury futures or pay fixed on a swap to offset the longer duration of its MBS. But using short positions or derivatives to offset MBS duration entails complex accounting for most banks that limits the share of risk that management can hedge and exposes the bank to earnings volatility.
Estimating a timeline for rebalancing
Banks have incentives to wait for cash and deposits to slowly rebalance to target duration of equity, but the pace depends on some critical assumptions:
- The deviation from target
- The duration of inflowing deposits
- The speed of cash inflows
- Other available tools for managing balance sheet rate exposure
Based on reasonable assumptions, it looks likely banks will take between one month and three months to let inflows offset the recent extension in MBS before getting back to their previous investment pace. The particulars:
Deviation from target. Banks routinely publish estimates of rate exposure for net interest income, but few if any publish duration of equity. It is hard to know where banks stood relative to target at the beginning and end of February. The quick drop in interest rates last March and the shortening of MBS duration left most banks well below target, and many spent the year aggressively adding MBS and Treasury duration to catch up. Anecdotally, a recent slowing of bank investment and rising demand for short investments suggests most banks have ended February too long. It is also hard to pinpoint the duration profile of bank MBS. The largest banks that need size and liquidity may buy production coupons and assemble over time a portfolio that looks like the MBS index. Others buy CMOs with very different duration and convexity. It seems reasonable to assume that banks in aggregate look like the MBS index and assume that banks could be anywhere from right on target to as much as 1.18 years too long. If banks ended February right on target, then bank investing should proceed as usual. If banks ended a half year in duration too long, they will need to offset $13 billion in excess MBS dollar duration. And if banks ended 1.18 years too long, they will have to offset $30 billion in excess MBS dollar duration (Exhibit 2).
Exhibit 2: Depending on deviation from target duration of equity, banks could have to offset up to $30 billion in extra dollar duration from MBS extension
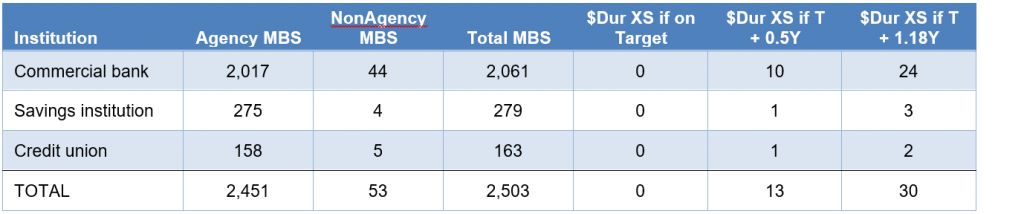
Note: all numbers in $ billions. MBS holdings as of 30 Sep 2020.
Source: Inside Mortgage Finance, Amherst Pierpont Securities.
The duration of inflowing deposits. Discussions with several bank asset-liability managers suggest many expect wholesale deposits to dominate new inflows this year with an assumed duration of negative two years. However, there is a fair case to make that inflows derived from Fed QE and reductions in US Treasury cash balances could have a weighted average life of more than eight years and, properly hedged, a similar duration. The volume of deposits needed to offset excess MBS duration is very sensitive to assumptions about deposit duration (Exhibit 3). For example, if duration of equity is off target by 1.18 years and by $30 billion—and if deposits flow in at a negative 2-year duration—then banks need $1.477 trillion in deposits to offset the excess. If deposit duration is negative 4-year, then banks need $738 billion. And if deposit duration is negative 8-year, then banks need only $369 billion.
Exhibit 3: Depending on deviation from target duration of equity, banks could need a wide range of deposit inflows
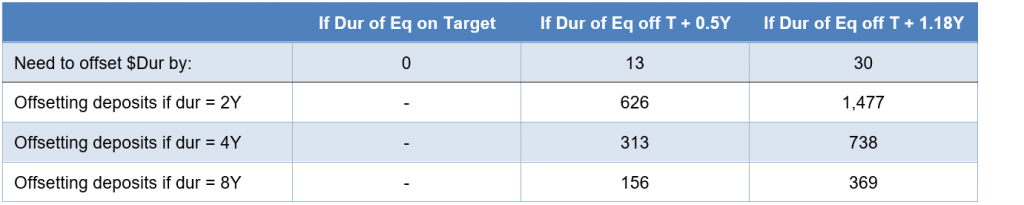
Note: all numbers in $ billions.
Source: Inside Mortgage Finance, Amherst Pierpont Securities.
The speed of cash inflows. Under normal circumstances a small deviation from target duration could entail waiting a long time for enough offsetting deposits to roll in. But banks are likely to see $2.2 trillion in cash hit the aggregate balance sheet from a few identifiable channels through July (Exhibit 4). More than $400 billion should arrive through MBS prepayments; since the deposits funding the MBS already are on balance sheet, this only helps if reinvested in low or zero-duration assets. However, roughly $720 billion should flow from QE and another $1.1 trillion from Treasury as it reduces its cash balances. These should arrive with negative duration.
Exhibit 4: Likely bank cash inflows through July from key sources
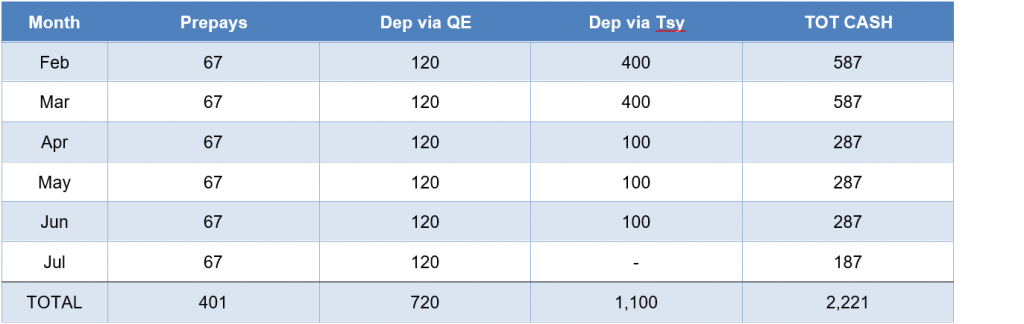
Note: all numbers in $ billion. Assumes an average 30 CPR on bank MBS. Timing of Treasury cash flow based on latest quarterly refunding announcement.
Source: Amherst Pierpont Securities
Assuming most banks see themselves as off their target duration of equity by somewhere between 0.5 years and 1.18 years—and that most deposits will flow onto the balance sheet with a duration of negative two years—banks look likely to need inflows for somewhere between one month and three months to offset excess duration (Exhibit 5). With more negative deposit durations, the timeline gets a lot shorter.
Exhibit 5: Heavy cash flow this year should close any duration gap within months
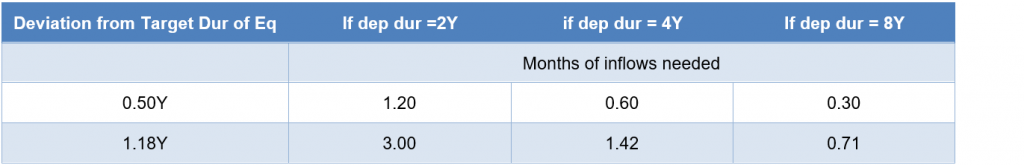
Source: Amherst Pierpont Securities
Other available tools. Banks do have other levers they can pull to reign in duration. Some banks use last-of-layer hedges to offset some risk in MBS, CMBS and other prepayable assets, and a bank can add new last-of-layer hedges to existing assets to help bring duration back to target. Away from MBS portfolios, some banks swap loans and other assets from floating to fixed by using swaps that match the cash flows of the asset. A bank can take a 5-year loan with a floating interest rate, for example, and receive fixed on the swap and pay floating. In the current situation, banks can enter into a new swap to offset the existing cash flow hedge and bring the asset back to floating, shortening its duration. If some banks conclude they are well off their duration target and do not want to wait for deposit inflows, they could use these kinds of strategies to move balance sheet duration faster.
Other considerations
It is worth noting a couple of other considerations:
- Alternatives to waiting. Instead of waiting for deposits to flow in while reinvesting in zero-duration assets, banks could choose instead to reinvest in short securities to preserve some net interest income and simply take longer to get back to target duration. Banks could also raise wholesale funds and invest in their usual mix of securities, also preserving net interest income, and then repay the wholesale funds with deposits anticipated later in the year. Of course, either of these approaches could push duration of equity temporarily further off target
- Differences based on bank size. The bigger a bank is, the greater the chance it will use deposit inflows to slowly rebalance. GSIBs, for example, are so large that using derivative hedges or other means to shorten duration of equity is of limited use. Banks with assets of less than $250 billion and especially less than $100 billion have more flexibility, and those banks could use derivatives, wholesale borrowings and other strategies to stay invested in a usual mix of securities and continuing adding income.
Market implications
The likely slowdown in bank activity should show up in the main markets where banks normally invest. In particular:
- Plan to buy MBS over the next few months on any substantial widening beyond pre-Feb levels; banks should eventually come back into the market and, in concert with the Fed, retighten spreads
- Plan to see the short end of the Treasury and CMO curve richen as banks try to keep reinvestment focused on short assets
- Expect the pace of yield curve steepening to slow after banks close any current duration gap and begin buying duration again
* * *
The view in rates
The 10-year rate for the balance of the year should range between 1.50% and 1.95%, which was exactly its range in the six months before pandemic. Equilibrium is probably at 2.50%, but that should take much more evidence of sustainable growth and inflation. The Biden administration’s $1.9 trillion stimulus package looks likely to pass through reconciliation, and the surge of cash and federal spending should continue to push growth and concern about inflation. But much of that is priced in.
The Treasury yield curve has finished its most recent session with 2s10s at 143 bp, a new high for the last five years. It should continue to steepen. The 5s30s curve has finished its latest session at 150 bp, down from its recent peak. As 30-year rates approach 2.50%, they should have less room to move up, and the 5s30 curve should start to flatten. Inflation expectations measured by the spread between 10-year notes and TIPS have moved up a bit over the last week to 223 bp, within a basis point of the highest level in five years. Real rates have moved up sharply as nominal rates rise. Volatility has jumped back up to levels last seen around the elections in November, but it is still at the average of the last five years.
A heavy supply of cash continues to reduce repo rates, Treasury bill yields and LIBOR. Yields on 2-year notes have moved a few basis points higher in the last week despite much larger moves up at longer maturities.
The view in spreads
Spreads in credit should continue to tighten slightly despite being near or at historic tights. In MBS, rising rates have widened spreads and uneven bank demand should leave them softer and more volatile than they have been for the last few months. The Treasury cash tsunami should keep short yields low and spreads on highest quality assets tight. QE absorbs MBS, the relatively riskless spread asset, at least regarding credit. Fiscal stimulus, pandemic recovery and Fed policy should also keep spreads steadily tighter through 2021. Weaker credits should outperform stronger credits, with high yield topping investment grade debt and both topping safe assets such as agency MBS and Treasury debt. Consumer credit should outperform corporate credit.
The view in credit
Consumers in aggregate are coming out of 2020 with a $5 trillion gain in net worth. Aggregate savings are up, home values are up and investment portfolios are up. Consumers have not added much debt. Although there is an underlying distribution of haves and have nots, the aggregate consumer balance sheet is strong. Corporate balance sheets have taken on substantial amounts of debt and will need earnings to rebound for either debt-to-EBITDA or EBITDA-to-interest-expense to drop back to better levels. Credit should improve as warmer weather and better vaccine distribution allows more opening of economic activity. Distribution and vaccine uptake through the end of 2021 should put a floor on fundamental risk with businesses and households most affected by pandemic—personal services, restaurants, leisure and entertainment, travel and hotels—bouncing back the most.