


The Big Idea
What’s cooking?
Stephen Stanley | February 19, 2021
This material is a Marketing Communication and does not constitute Independent Investment Research.
The restaurant industry has been among the most prominent victims of pandemic restrictions over the last year. Restaurant receipts show that the industry has broadly tracked the ups and downs in the spread of Covid. With warmer weather on its way in and Covid on its way out, there seem to be better times ahead. The surprising rebound in the category in January retail sales hopefully offers a taste of things to come, although underlying demand may not have strengthened as much as the retail sales data suggest.
Restaurant roller coaster
The restaurant industry has been on a roller coaster since the pandemic widened last March. The pre-pandemic level of restaurant and bar receipts was approximately $65 billion a month (Exhibit 1). Retail sales in the sector fell by 30% in March and then another 34% in April to only $30 billion—less than half the pre-pandemic level, as, during the early months of the pandemic, most restaurants could only sell food for delivery or takeout. As Covid eased in May and June, state governors began allowing restaurants to reopen, especially for outdoor dining. Receipts rebounded by 31% in May and by another 27% in June, returning the level back to $50 billion, roughly 75% of the level of pre-pandemic revenues.
Exhibit 1: A retail sales for rollercoaster for restaurants
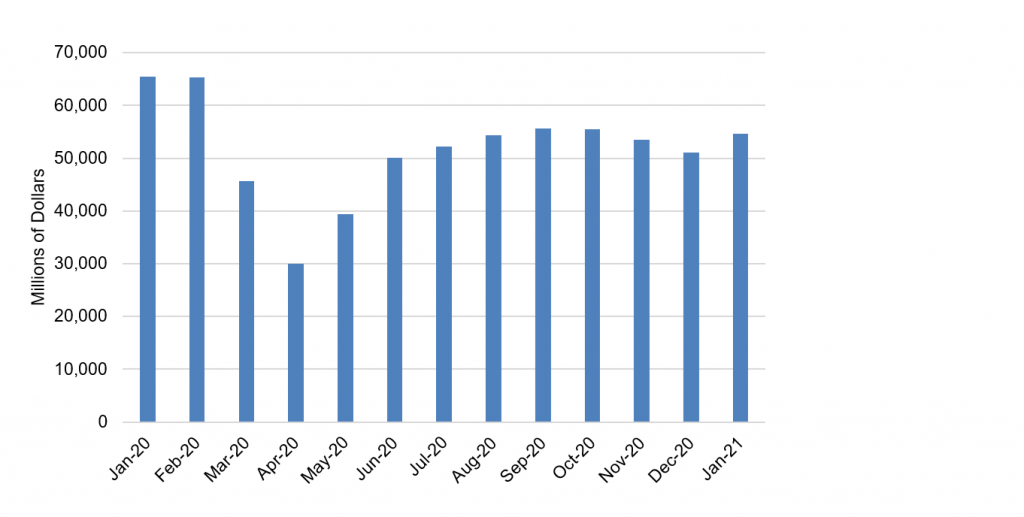
Note: Retail sales for “food services and drinking places.”
Source: Census Bureau.
Restaurants continued to recover throughout the summer, as outdoor dining became increasingly common. The summer surge in the virus seen mainly in the South slowed but did not halt the positive momentum. Restaurant receipts improved by more than 4% in July and in August and by about 2.5% in September. The September reading of $55.7 billion, about 85% of the pre-pandemic level, turned out to the be the high-water mark for the remainder of the year.
The combination of worsening weather and the onset of another jump in the spread of the virus sent restaurant receipts back down in the fourth quarter, marginally in October and then by hefty margins of 3.6% in November and 4.6% in December. As a result, restaurants ended the year at $51.1 billion, back roughly to the June-July levels, near three-quarters of the pre-pandemic pace.
The latest Covid surge peaked in early January and has been ebbing rapidly since. However, restrictions on dining only began to ease very late in January and into February. Those tight rules along with winter weather argued for another lackluster month in January. However, surprisingly, retail sales receipts surged in January, increasing by about 7% to $54.6 billion, only $1 billion short of the post-pandemic high in September.
Restaurant employment
The broad contours of the story are similar for payroll employment at restaurants. Employment at restaurants fell by roughly half, from 12.3 million to 6.3 million in March and April (Exhibit 2). About half of that job loss reversed in May and June. Then restaurants were able to add another 1 million or so positions from July through October. The movements since October were muted relative to the swings in retail sales. Payrolls fell by about 4% in November and December—about half of the drop in receipts—and were close to flat in January.
Exhibit 2: Payroll employment for restaurants
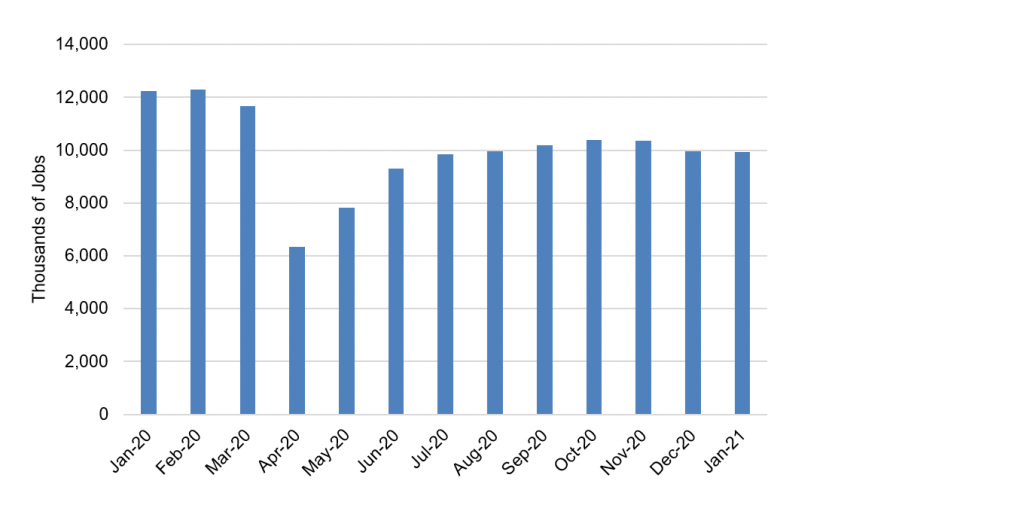
Source: BLS.
There is an important point to consider in comparing the results of retail sales and employment for January. The payroll survey reference period falls in the second full week of each month. As a result, there will be times when, if something big happens in the second half of a month, the payroll figures may not reflect it until the following month. For example, restaurant receipts fell by 30% in March 2020, but payroll employment in the sector, which was measured for the week just before national lockdowns were imposed, only declined by about 5%. Then the payroll figures caught up in April.
There is some chance that a similar phenomenon occurred in January, as rebate checks were mostly distributed early in the month, but the full boost to retail sales generally and to restaurants specifically may have been disbursed across, say, the final three weeks of the month, in which case, the employment survey for January would not have caught the entire effect.
Seasonal noise
However, while the rebate checks deserve credit for some portion of the January bounce in restaurant receipts, seasonal noise likely accounted for the bulk of the swings in December and January. Note that retail sales at restaurants fell by nearly 9% in the final three months of 2020, while payrolls for the sector only declined by about 4%. In contrast, the two had tracked almost exactly up to that point, dropping by roughly half during the initial lockdowns, retracing a little over half of that loss in the next two months and then improving by another 10% or so through the summer.
The seasonally adjusted retail sales figures may have been distorted to some extent by the fact that the normal seasonal jump in activity that occurs late in the year failed to happen in 2020. Restaurants usually benefit from a variety of factors late in the year, including corporate year-end parties, large celebrations by families and friends for Christmas, and elevated travel during the holidays. With none of that occurring, retail sales failed to come close to registering the increase that the seasonal factors expected. Note that retail sales were relatively flat on an unadjusted basis in December and January, rising by 1.6% in December and retreating by 0.3% in January.
While it is possible that retail sales registered a massive bounceback in the second half of January, too late to be reflected in the January payroll numbers, the more plausible explanation is that the weakness in November and in particular in December was more an artifact of seasonal factors that were ill-equipped to handle the 2020 experience. And, in turn, the relatively steady unadjusted performance in January was transformed by the seasonals to a spectacular increase.
Implications
There are three important takeaways from the January retail sales results for restaurants:
First, the softness in restaurant receipts and more broadly for retail sales generally in late 2020 was probably exaggerated. To be sure, there was legitimate weakness late last year as the intensification of the virus led to a reimposition of severe restriction on various forms of economic activity, with a particular focus on restaurants and bars. Nonetheless, the January revival in retail sales mostly erased in the case of restaurants and more than erased in the case of the broader core measures the Q4 softness.
Second, that the sole answer for why retail sales exploded higher in January is probably not as simple as the notion that household went out and splurged using their rebate checks. The dynamic described for retail sales extended well beyond restaurants. A number of categories posted sharp drops in December and explosive rebounds in January. For some, the rebate check story is plausible: furniture and electronics and appliances, for example. For others, it is not. Grocery store receipts dropped by 1.4% in December and surged by 2.4% in January. Nonstore retailers, mostly internet-only outlets, posted a 7.3% plunge in December, a highly implausible result for a socially distanced Christmas, and an 11% bounce in January (again, unadjusted, sales were up in December and down in January, just by less in each case than usual). There consequently is less reason to worry that retail sales will gyrate in the next few months, plunging in February as the purported rebate check boost dissipates and then spiking later if/when an even larger round of checks is distributed. The rebate checks clearly had some impact, but they likely do not offer the only or even the predominant explanation for the strength in adjusted retail sales last month.
Third, the dynamic for restaurants and retail sales is more consistent with the evolution of the virus. Cases and hospitalizations peaked in early January and were still sky-high for much of the month. It stands to reason that January should have been a relatively restrained month for retail sales and consumer spending more broadly. By that logic, February should be better, though weather may put a damper on this month’s spending, and, if current trends on Covid cases hold, March will be better still. A third round of rebate checks, which could be as large as the first two combined, would undoubtedly offer a short-term dose of rocket fuel to the consumer as well, but the pattern of consumer spending generally and restaurant receipts in particular should mostly follow the trajectory of the pandemic, as was the case in 2020.