


The Big Idea
The coming tsunami of cash
Steven Abrahams | February 19, 2021
This material is a Marketing Communication and does not constitute Independent Investment Research.
The money markets have proven over the years to be a good indicator of pending change across fixed income, and they are flashing warning signs. The signs point not to a drop in cash and liquidity but to an excess. And on top of the excess is a possible $1.1 trillion surge in cash coming out of the US Treasury between now and the end of June. The surge could further richen valuations in the money markets and flow into other parts of fixed income including the Treasury and MBS markets and beyond, richening valuations there, too.
A rumble from Treasury
The rumble of a cash tsunami came February 1 when the US Treasury announced it expected to draw down its cash balances through June by $1.1 trillion. The Treasury had built up cash from $418 billion in the middle of last March to a peak of $1.8 trillion in late July before settling at $1.6 trillion lately (Exhibit 1). The rationale was to stockpile cash ahead of possible legislated spending. But with a change of administration, the Treasury has reportedly decided it should only hold enough cash to meet up to five days of anticipated expenses. The Treasury’s financing estimates included an assumed cash balance by the end of June of $500 billion.
Exhibit 1: Pandemic triggered a historic rise in the Treasury’s cash balance
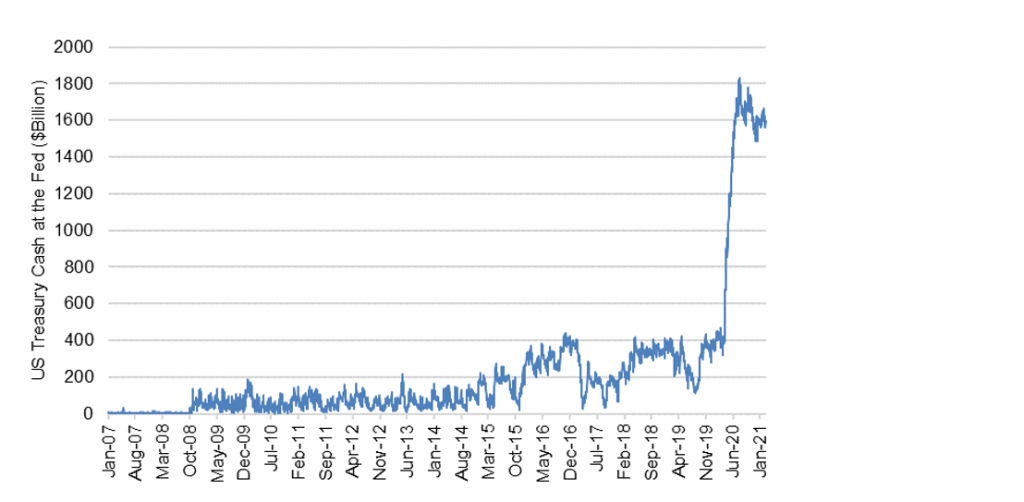
Source: Bloomberg, Amherst Pierpont Securities
The most likely path for the Treasury from $1.6 trillion to $500 billion would be by simply repaying investors as Treasury bills become due over the coming months and not issuing offsetting new debt. The Treasury likes issuing notes, bonds and TIPS on a regular and predictable schedule and has already announced its auction schedule, so the supply of bills would drop. The cash returned to investors would join a flood of cash already put into the financial system by the Fed through $120 billion of monthly QE, creating a wave of reinvestment demand across a range of markets. Of course, the parts of fixed income affected would depend on where the cash ends up, and who decides on reinvestment.
It is worth noting that the Treasury is only estimating it will need $500 billion in cash at the close of June. That would bring cash back down into the neighborhood of where balances stood before pandemic. Of course, cash needs could be higher or lower.
Following the money from QE
To understand the potential impact of the $1.1 trillion that could come out of Treasury, it helps to follow the money created by QE. The Fed has already bought $2.8 trillion in assets—Treasury debt, agency MBS and CMBS and corporate debt—since launching its latest round of QE last March 15. The QE has put $2.8 trillion of cash into the financial system. Almost all of it has ended up on bank balance sheets. Since early March, bank liabilities including deposits, borrowing and others have gone up by a total of $2.7 trillion. Banks consequently have controlled the investment of those funds.
Since March, banks have added $2.6 trillion in incremental assets. Of that, 87% has gone into one of only three markets (Exhibit 2):
- More than $1.44 trillion or 55% of purchases has gone into cash assets, including excess reserves held at the Fed
- Another $515 billion or 20% has gone into agency MBS, and
- More than $315 billion or 12% has gone into Treasury debt
Smaller amounts have gone into loans and other securities. It is worth noting that while total bank assets have gone up nearly 15%, loan and lease balances have gone up less than 3%.
Exhibit 2: Banks have allocated a QE-triggered deposit surge across assets
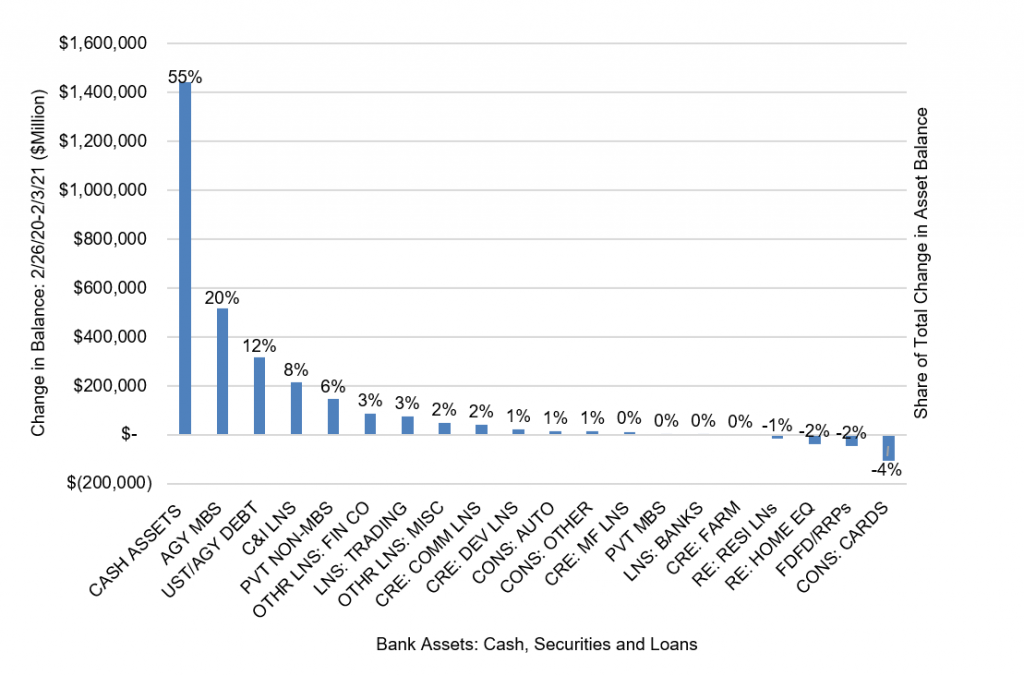
Source: Federal Reserve H.8, Amherst Pierpont Securities
Bank investment of QE-triggered deposit growth is a good indication of where banks would invest the $1.1 trillion that could come out of Treasury. It is also worth considering bank reinvestment of the likely $600 billion in deposits created through QE by the end of June. Loan demand may rise a bit into June as the economy recovers, but not fast enough to absorb the tidal wave of deposits. That wave and recent bank investment allocations suggests $935 billion of demand for excess reserves at the Fed, $340 billion of demand for agency MBS and $204 billion of demand for Treasury debt (Exhibit 3).
Exhibit 3: Likely reinvestment of a bank liquidity surge: February to June ($B)
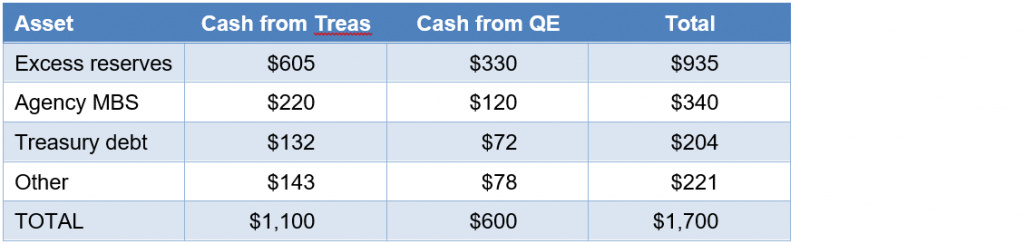
Note: Assuming marginal investment allocation matches Mar 2020-Jan 2021.
Source: Amherst Pierpont Securities
Recent bank Treasury holdings also point to the likely asset durations that banks would target. At the end of the third quarter, banks held 22% in Treasury debt with less than 1-year maturity and 56% in debt with maturity between one and five years, with the rest at longer maturities (Exhibit 4). Banks look likely to have significant demand for Treasury bills and short Treasury notes just as Treasury bill supply is set to drop by $1.1 trillion.
Exhibit 4: Bank Treasury holdings suggest demand for short maturities
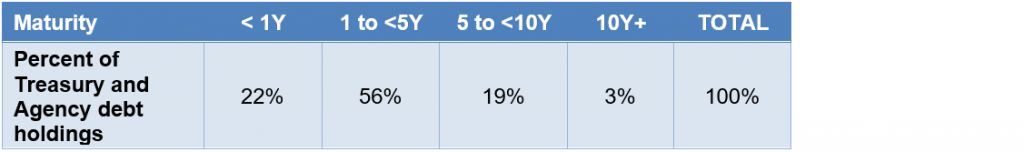
Note: shows maturity allocation of US bank Treasury holdings 3Q2020. Source: US Treasury, Amherst Pierpont Securities
Wildcard: the supplemental leverage ratio
There is one wildcard that could shift the flow of liquidity and reinvestment from banks to other channels, such as money market mutual funds. It is a temporary set of rules that govern banks’ supplemental leverage ratio or SLR, and the rules are set to expire on March 31, making it much more costly for large banks to let deposits flow onto their balance sheets.
Generally, regulators require banks with more than $250 billion in assets to have a minimum 5% ratio of Tier I capital to total assets—the SLR. In practice, banks prefer a healthy cushion above that. Last April the Fed announced it would exclude bank holdings of Treasuries and excess reserves from total assets in calculating SLR. That has allowed banks to accommodate more than $1.75 trillion in excess reserves and Treasury debt so far, and, if extended, would allow banks to soak up more as the Treasury releases cash and QE adds more.
So far, the Fed has said nothing about extending the temporary rules. JPMorgan reported an SLR of 6.9% at the end of 2020 and said without the temporary relief it would have dropped to 5.8%. JPMorgan called for extension and said otherwise it would have either raise equity, start turning away large deposits or do both. Citigroup has also called for extending the rules.
If the rules lapse, bank efforts to discourage deposits through fees, negative rates or similar means could divert cash to money market mutual funds, where the allowable set of investment is much more restricted. MMMFs invest heavily in Treasury repo and short government, agency and other debt (Exhibit 5). MMMF demand would likely pressure repo rates lower along with yields in Treasury bills and similar debt just as the Treasury is trimming bill supply by $1.1 trillion.
Exhibit 5: Current MMMF holdings point to reinvestment of surging liqudity

Source: Federal Reserve, Amherst Pierpont Securities
Money markets: a case study in what excess cash can do to asset valuations
Money market mutual funds, Fannie Mae and Freddie Mac, broker/dealers and others that cannot deposit excess cash at the Fed have been forced to compete with banks in markets where demand overlaps—mainly the short end of the Treasury curve. This has helped keep short Treasury yields low, especially in Treasury bills. And low bill yields have forced many of these non-banks into other markets, such as Treasury repo. To make matters worse, Fannie Mae and Freddie Mac’s regulator also proposed rules in December that gave the GSEs significant incentives to move a portion of their month repo investments from MBS to Treasury debt, and the GSEs began acting on the proposed rules in January. The Secured Overnight Financing Rate, or SOFR, which reflects rates in recent months on more than $900 billion in daily Treasury repo, dropped well below IOER right after the start of pandemic when many investors grabbed cash and invested in the safest assets, including Treasury repo (Exhibit 6). SOFR hovered a few basis points below IOER through most of the summer and fall. But since the start of January, the gap to IOER has widened. That brings the discussion back to Treasury cash balances: as the Treasury has put cash back out into the market and drawn down the supply of bills, rising cash has had to chase a declining set of investors that need to finance Treasury bill holdings, driving down Treasury repo rates.
Exhibit 6: Treasury repo, reflected by SOFR, lately has dropped below IOER
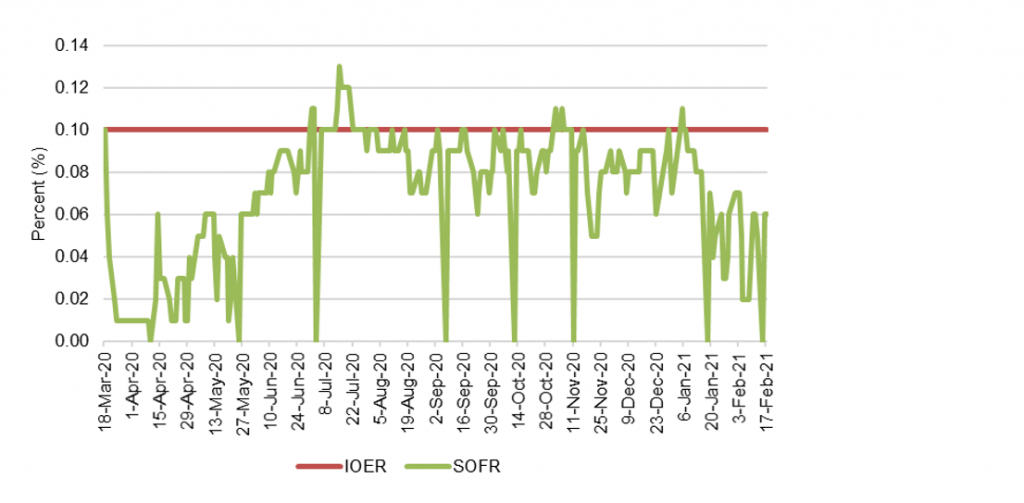
Source: Bloomberg, Amherst Pierpont Securities
A potential pressure valve
If money markets continue to show signs of excess liquidity, the Fed does have a mechanism to relieve some of the pressure: the Fed’s reverse repo facility. This facility allows the Fed to post Treasury debt, agency debt or agency MBS and borrow against the collateral at a set rate. Banks, the GSEs, MMMFs and broker/dealers can all lend to the Fed through the reverse repo facility. But the current Fed reverse repo rate is 0%. If the Fed lifted the rate, it would likely attract trillion in cash from non-banks and consequently raise the floor on wholesale short-term rates such as SOFR.
Observations on market impact
A few observations to summarize the likely market impact of Treasury’s projected cash tsunami and the continued flow of liquidity from QE:
- At the highest level, this is an important source of orchestrated demand likely to keep yields low and risk spreads tight in the Treasury bill market and in Treasury and agency MBS with durations out to five years despite already rich valuations
- Much like QE absorbs the supply of safe assets and forces investors into higher tiers of risk to get yield, the Treasury tsunami will likely force some investors out of their habitat on the front end of the curve in search of yield, richening markets beyond those directly affected by bank or MMMF investment
- Most if not all the Treasury cash would find its most natural home on bank balance sheets and translate into clear demand for excess reserves, MBS and Treasury debt, setting new historical records for yields and spreads in those markets
- If the Fed does not extend the temporary exemption for excess reserves and Treasury debt in the SLR calculation, most banks with more than $250 billion in assets will eventually struggle with excess deposits and likely try to divert them into the MMMF market, where the cash will pressure rate in Treasury repo, Treasury bills, commercial paper, institutional bank CDs and other eligible investments
* * *
The view in rates
It’s simple math, but the 10-year rate in the six months before pandemic ranged between 1.50% and 1.95%. The Biden administration’s $1.9 trillion stimulus package has momentum, and the surge of cash and federal spending would likely push growth and concern about inflation higher. It would be highly likely by the end of 2021 at the latest that the market would price growth and inflation at least to the levels that prevailed before pandemic and probably higher. That leaves room for 10-year rates to rise from the current 1.34% mark. The Treasury yield curve has finished its most recent session with 2s10s at 123 bp, the highest in nearly four years, and 5s30s at 156 bp, a new high mark for at least the last five years. Inflation expectations measured by the spread between 10-year notes and TIPS have dropped 6 bp in the last week to 216 bp. Real rates have moved up sharply as nominal rates rise. Volatility has jumped back up to levels last seen around the elections in November, but it is still at the average of the last five years.
As noted, a heavy supply of cash is reducing repo rates, Treasury bill yields and LIBOR. Yields on 2-year notes have slipped lower lately despite higher rates in longer maturities.
The view in spreads
Spreads should continue to tighten slightly despite being near or at historic tights in many assets. The Treasury cash tsunami should keep short yields low and spreads on highest quality assets tight. QE absorbs MBS, the relatively riskless spread asset, at least regarding credit. Fiscal stimulus, pandemic recovery and Fed policy should also keep spreads steadily tighter through 2021. Weaker credits should outperform stronger credits, with high yield topping investment grade debt and both topping safe assets such as agency MBS and Treasury debt. Consumer credit should outperform corporate credit.
The view in credit
Consumers in aggregate are coming out of 2020 with a $5 trillion gain in net worth. Aggregate savings are up, home values are up and investment portfolios are up. Consumers have not added much debt. Although there is an underlying distribution of haves and have nots, the aggregate consumer balance sheet is strong. Corporate balance sheets have taken on substantial amounts of debt and will need earnings to rebound for either debt-to-EBITDA or EBITDA-to-interest-expense to drop back to better levels. Credit should improve as warmer weather and better vaccine distribution allows more opening of economic activity. Distribution and vaccine uptake through the end of 2021 should put a floor on fundamental risk with businesses and households most affected by pandemic—personal services, restaurants, leisure and entertainment, travel and hotels—bouncing back the most.