The Long and Short
CAGNY comments reinforce underperform view on GIS
This material is a Marketing Communication and does not constitute Independent Investment Research.
General Mills (GIS) is one of the tightest credits in the packaged food space, with net leverage now below the company’s 3.0x target. Management discussed further portfolio repositioning at the CAGNY conference, which is likely to consist of debt financed acquisitions as the company looks to build long term top line organic growth. While the pandemic has helped drive organic growth for packaged food companies not witnessed in years, that growth is likely to subside as life returns to a new normal. Conagra and Campbell soup bonds both offer investors better relative value, particularly in the long end of the curve.
General Mills (GIS) continues to trade well through its triple-B packaged food peers and has made good on its promise to delever post the Blue Buffalo acquisition which closed on 4/25/18. Packaged food companies may begin to look at a combination of M&A as well as shareholder rewards to keep the top line growing and to manage EPS.
On a relative value basis investors should swap out of GIS into both Campbell Soup (CPB – Baa2/BBB- (p)/BBB) and Conagra Brands (CAG – Baa3 (p)/BBB-/BBB-), particularly in the long end of the curve. A swap out of GIS 2048 into CAG 2048 bonds provides for a roughly 50 bp pick-up in spread. CAG still remains in debt reduction mode as it looks to delever post its acquisition of Pinnacle Foods. That spread pick up is more than enough to justify the one notch ratings differential between GIS and CAG.
Exhibit 1. BBB Packaged Food Curve
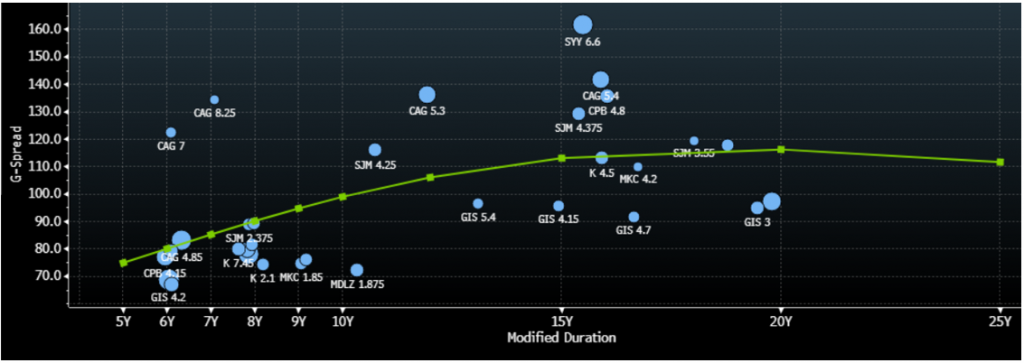
Source: Bloomberg TRACE; Amherst Pierpont Securities
Portfolio Reshaping = Increased M&A Activity
Management noted that portfolio reshaping will increase the level of both acquisitions and divestitures as the company targets long term organic net sales growth of 2%-3%. While management discussed bolt-on acquisitions, there is a potential for larger acquisitions particularly if it is accretive to growth and to shareholders. One thing management did note was that they do not need to wait for the pandemic to end to pursue growth opportunities, particularly since net leverage currently stands at 2.9x. Having leverage below their target provides GIS with the financial flexibility to pursue opportunities and return further cash to shareholders via dividend increases and share repurchases.
Exhibit 2. Long Term Capital Allocation Priorities
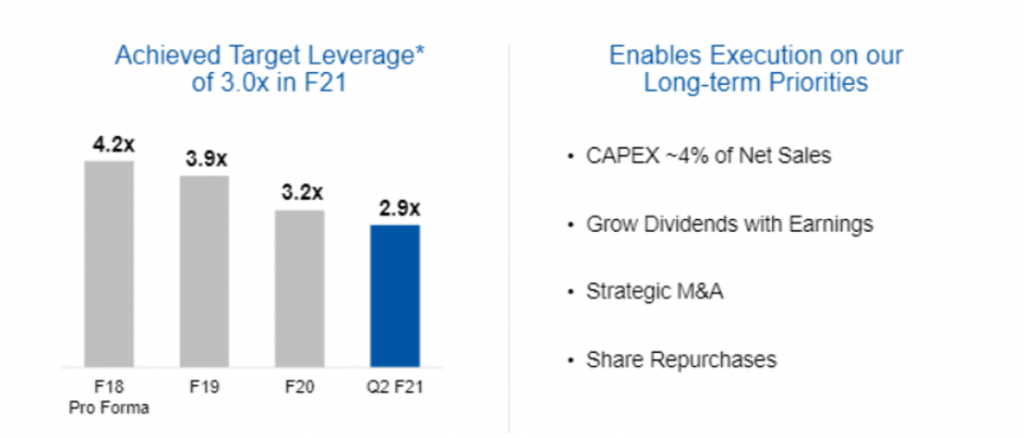
* Net Debt to Trailing 12-Month Adjusted-EBTIDA Ratio
Source: GIS CAGNY Presentation
The reason GIS may look to pursue debt financed acquisitions is rooted in the company’s shareholder rewards policy. Currently GIS is targeting converting 95% of adjusted net earnings to free cash flow, with 80%-90% of free cash flow allocated to shareholders via dividends and repurchases. With free cash flow estimates for fiscal 2021 (ending 5/31/21) of $2.4 billion, GIS is only looking at $240 to $420 million for acquisitions. While GIS could use divestitures to allocate further proceeds to acquisitions, the real transformation to GIS’ portfolio has come with larger acquisitions. Also, given the current interest rate environment, GIS could increase leverage up to the 4.0x range with the agencies providing them flexibility (18-24 months) in reducing debt back down to their 3.0x target.
Organic Top Line Growth Likely to Stall
While the pandemic has been a boost to the top line, mid to high single digit growth is unsustainable. In fact, consensus estimates for fiscal 2021 are only calling for 1% net sales growth at GIS, which remains below management’s long-term target of 2%-3%. Looking out further, street estimates put net sales growth in fiscal 2022 in negative territory. Pre-pandemic the packaged food companies were struggling to post top line growth, which is why acquisitions were so prevalent amongst GIS and its peers. Even with GIS’ exceptional growth in calendar year 2020 from pantry stocking, the stock is currently down 1.7% year-to-date. The equity price is largely reflecting the lack of growth expected once the pandemic subsides.
Fitch to Withdraw Ratings
While both Moody’s and S&P have stable outlooks on GIS’ mid-BBB ratings, Fitch still maintains a negative outlook, which reflects the possibility that gross leverage would remain above 3.5x in fiscal 2021. We estimate that gross leverage is currently 3.6x. Fitch noted that in order to revise the outlook to stable, GIS would need to reduce gross leverage to the 3.5x level in fiscal 2021. With EBITDA in fiscal 2021 expected to be similar to fiscal 2020, leverage was likely to rise two ticks by fiscal year end, absent any further debt reduction. On February 12, 2021, Fitch announced it plans to withdraw the rating on GIS on or about March 12, 2021. While no reason was cited for the withdrawal, Fitch noted that it reserves the right “to withdraw or maintain any rating at any time for any reason it deems sufficient”. Fitch is providing roughly 30 days’ notice of the rating withdrawal and can change its rating or outlook at any time between now and the actual withdrawal of the rating.
This material is intended only for institutional investors and does not carry all of the independence and disclosure standards of retail debt research reports. In the preparation of this material, the author may have consulted or otherwise discussed the matters referenced herein with one or more of SCM’s trading desks, any of which may have accumulated or otherwise taken a position, long or short, in any of the financial instruments discussed in or related to this material. Further, SCM may act as a market maker or principal dealer and may have proprietary interests that differ or conflict with the recipient hereof, in connection with any financial instrument discussed in or related to this material.
This message, including any attachments or links contained herein, is subject to important disclaimers, conditions, and disclosures regarding Electronic Communications, which you can find at https://portfolio-strategy.apsec.com/sancap-disclaimers-and-disclosures.
Important Disclaimers
Copyright © 2026 Santander US Capital Markets LLC and its affiliates (“SCM”). All rights reserved. SCM is a member of FINRA and SIPC. This material is intended for limited distribution to institutions only and is not publicly available. Any unauthorized use or disclosure is prohibited.
In making this material available, SCM (i) is not providing any advice to the recipient, including, without limitation, any advice as to investment, legal, accounting, tax and financial matters, (ii) is not acting as an advisor or fiduciary in respect of the recipient, (iii) is not making any predictions or projections and (iv) intends that any recipient to which SCM has provided this material is an “institutional investor” (as defined under applicable law and regulation, including FINRA Rule 4512 and that this material will not be disseminated, in whole or part, to any third party by the recipient.
The author of this material is an economist, desk strategist or trader. In the preparation of this material, the author may have consulted or otherwise discussed the matters referenced herein with one or more of SCM’s trading desks, any of which may have accumulated or otherwise taken a position, long or short, in any of the financial instruments discussed in or related to this material. Further, SCM or any of its affiliates may act as a market maker or principal dealer and may have proprietary interests that differ or conflict with the recipient hereof, in connection with any financial instrument discussed in or related to this material.
This material (i) has been prepared for information purposes only and does not constitute a solicitation or an offer to buy or sell any securities, related investments or other financial instruments, (ii) is neither research, a “research report” as commonly understood under the securities laws and regulations promulgated thereunder nor the product of a research department, (iii) or parts thereof may have been obtained from various sources, the reliability of which has not been verified and cannot be guaranteed by SCM, (iv) should not be reproduced or disclosed to any other person, without SCM’s prior consent and (v) is not intended for distribution in any jurisdiction in which its distribution would be prohibited.
In connection with this material, SCM (i) makes no representation or warranties as to the appropriateness or reliance for use in any transaction or as to the permissibility or legality of any financial instrument in any jurisdiction, (ii) believes the information in this material to be reliable, has not independently verified such information and makes no representation, express or implied, with regard to the accuracy or completeness of such information, (iii) accepts no responsibility or liability as to any reliance placed, or investment decision made, on the basis of such information by the recipient and (iv) does not undertake, and disclaims any duty to undertake, to update or to revise the information contained in this material.
Unless otherwise stated, the views, opinions, forecasts, valuations, or estimates contained in this material are those solely of the author, as of the date of publication of this material, and are subject to change without notice. The recipient of this material should make an independent evaluation of this information and make such other investigations as the recipient considers necessary (including obtaining independent financial advice), before transacting in any financial market or instrument discussed in or related to this material.
Important disclaimers for clients in the EU and UK
This publication has been prepared by Trading Desk Strategists within the Sales and Trading functions of Santander US Capital Markets LLC (“SanCap”), the US registered broker-dealer of Santander Corporate & Investment Banking. This communication is distributed in the EEA by Banco Santander S.A., a credit institution registered in Spain and authorised and regulated by the Bank of Spain and the CNMV. Any EEA recipient of this communication that would like to affect any transaction in any security or issuer discussed herein should do so with Banco Santander S.A. or any of its affiliates (together “Santander”). This communication has been distributed in the UK by Banco Santander, S.A.’s London branch, authorised by the Bank of Spain and subject to regulatory oversight on certain matters by the Financial Conduct Authority (FCA) and the Prudential Regulation Authority (PRA).
The publication is intended for exclusive use for Professional Clients and Eligible Counterparties as defined by MiFID II and is not intended for use by retail customers or for any persons or entities in any jurisdictions or country where such distribution or use would be contrary to local law or regulation.
This material is not a product of Santander´s Research Team and does not constitute independent investment research. This is a marketing communication and may contain ¨investment recommendations¨ as defined by the Market Abuse Regulation 596/2014 ("MAR"). This publication has not been prepared in accordance with legal requirements designed to promote the independence of research and is not subject to any prohibition on dealing ahead of the dissemination of investment research. The author, date and time of the production of this publication are as indicated herein.
This publication does not constitute investment advice and may not be relied upon to form an investment decision, nor should it be construed as any offer to sell or issue or invitation to purchase, acquire or subscribe for any instruments referred herein. The publication has been prepared in good faith and based on information Santander considers reliable as of the date of publication, but Santander does not guarantee or represent, express or implied, that such information is accurate or complete. All estimates, forecasts and opinions are current as at the date of this publication and are subject to change without notice. Unless otherwise indicated, Santander does not intend to update this publication. The views and commentary in this publication may not be objective or independent of the interests of the Trading and Sales functions of Santander, who may be active participants in the markets, investments or strategies referred to herein and/or may receive compensation from investment banking and non-investment banking services from entities mentioned herein. Santander may trade as principal, make a market or hold positions in instruments (or related derivatives) and/or hold financial interest in entities discussed herein. Santander may provide market commentary or trading strategies to other clients or engage in transactions which may differ from views expressed herein. Santander may have acted upon the contents of this publication prior to you having received it.
This publication is intended for the exclusive use of the recipient and must not be reproduced, redistributed or transmitted, in whole or in part, without Santander’s consent. The recipient agrees to keep confidential at all times information contained herein.


