


By the Numbers
The market edges out most managers through January
Steven Abrahams and Caroline Chen | February 5, 2021
This document is intended for institutional investors and is not subject to all of the independence and disclosure standards applicable to debt research reports prepared for retail investors. This material does not constitute research.
It was a tight competition between market returns in leveraged loans from November through January and returns in CLO loan portfolios, but the market notched a small win. The average CLO leveraged loan portfolio gained 4.34% over that period but, after adjusting for broad market exposure, or beta, fell behind the market by 0.10%. Still, nearly 40% of managers with five or more active deals outperformed. In a trend that has held since last spring, managers that held the riskiest loans again led the pack.
Loan returns rose steadily between November and January (Exhibit 1). The index has now surpassed its pre-coronavirus level, after nearly 10 months of sustained rally. After accounting for the various reporting dates of managers, the S&P/LSTA Index gained 4.30% between last November and January. Managers held portfolios with an average beta of 1.03, which meant the average manager should have gained 4.44%. With the actual average performance at 4.34%, the average manager trailed the index by 0.10%.
Exhibit 1: Loan returns rose above its pre-coronavirus level at the start of 2021
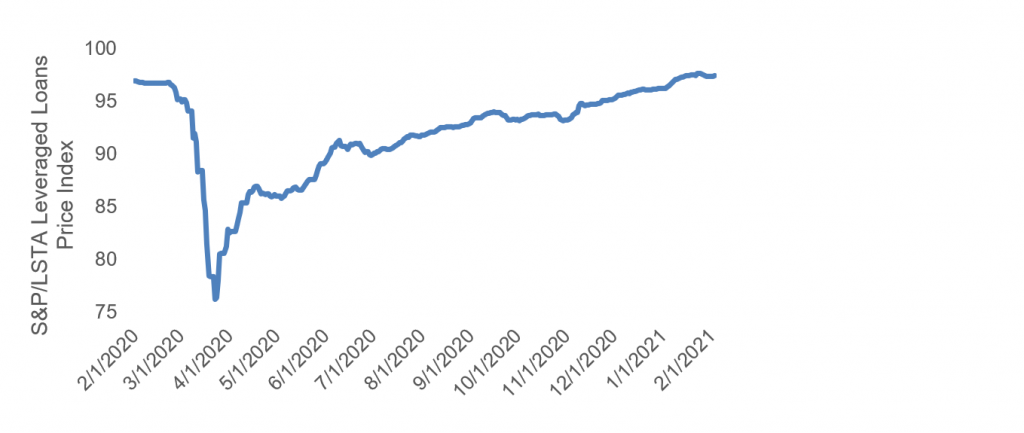
Source: Bloomberg, Amherst Pierpont Securities
About 39% of the managers led the index, a small uptick from the figures reported by Amherst Pierpont last month (Exhibit 2). Out of the 75 managers with five or more active deals tracked for November through January, one delivered excess return greater than 1% while three trailed the index by at least 1%, with one manager trailing by nearly 4%.
Exhibit 2: Almost 40% of managers beat the index from November to January
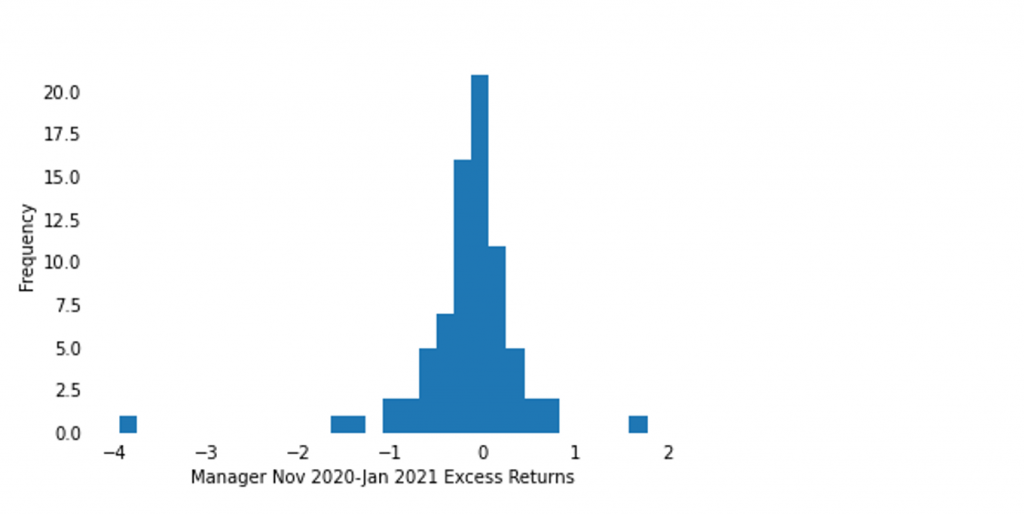
Note: data shows excess return only for active deals.
Source: Amherst Pierpont Securities.
The diversity score and second-lien exposure of the portfolio correlated most strongly with recent excess returns (Exhibit 3). Managers who held loans that are better diversified or held more second lien loans delivered higher returns. Additionally, higher weighted average rating factor and higher defaulted loan exposure correlated with more recent excess returns. These relationships indicate that managers holding the lowest rated loans while diversifying their portfolios tended to outperform between November and January.
Exhibit 3: Correlation of portfolio or manager features with recent excess return
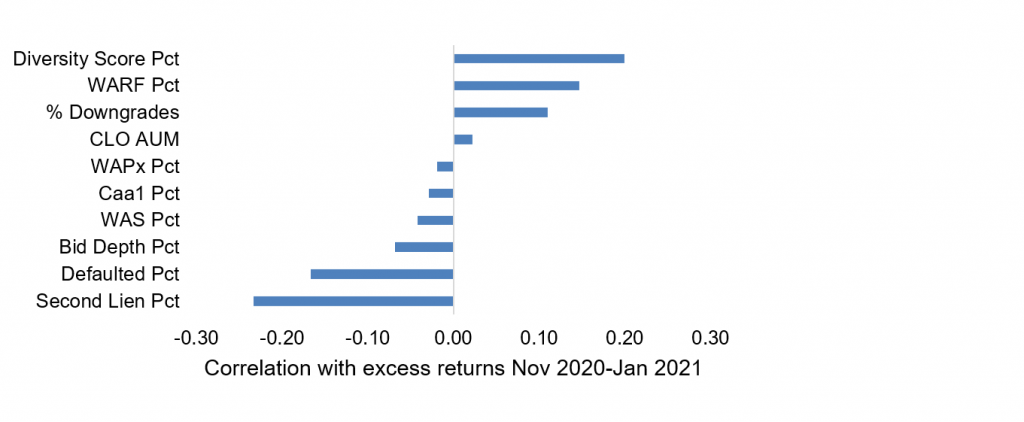
Note: data shows the correlation of manager or loan portfolio attribute with managers’ excess return or alpha from November through January only on active deals. Portfolio attributes measured as percentiles.
Source: Amherst Pierpont Securities.
A closer look at Moody’s downgrades on reinvesting CLOs from August to November 2020 shows that most managers had no CLO classes downgraded. Half of the managers have more than 2% of their CLO classes downgraded while 25% had more than 8% downgraded (Exhibit 4). Moreover, although the percentage of downgrades correlates weakly with the ensuing excess returns, it correlates much more strongly with beta, at 0.35. In other words, managers holding loan portfolios with a high beta to the S&P/LSTA index tended to run a higher risk of having debt classes downgraded. An earlier APS analysis shows that lower-rated loans have more market risks and consequently higher betas. The higher exposure to these riskier loans also leads to a higher likelihood of downgrades.
Exhibit 4: Half of managers have less than 2% downgrades on their reinvesting CLOs
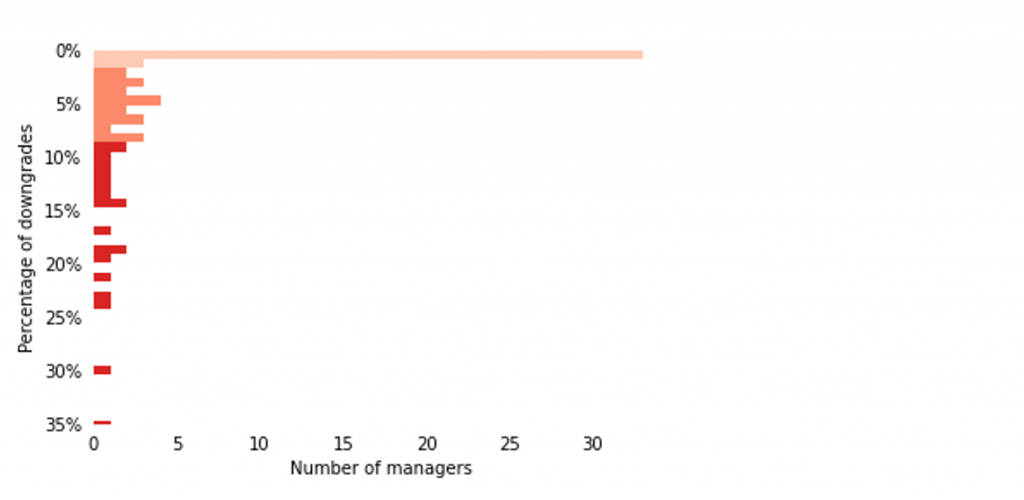
Note: Only Moody’s-rated reinvesting CLOs of managers with at least five deals tracked by APS are considered. This analysis compares ratings of CLOs on August 1, 2020 and November 1, 2020 to determine if there was a downgrade. The beige color above reflects managers with less than median level of downgrade, while the orange and red colors represent managers with higher than median and 75th percentile of downgrades, respectively.
Sources: Moody’s, Bloomberg, APS.
The following managers delivered positive alpha in the market between November and January (Exhibit 5). ZAIS Group, Bain Capital, and Canaras top the chart this time. The other Top 5 alpha leaders include Greywolf and KKR.
Exhibit 5: Alpha leaders in CLO portfolio performance November 2020-January 2021
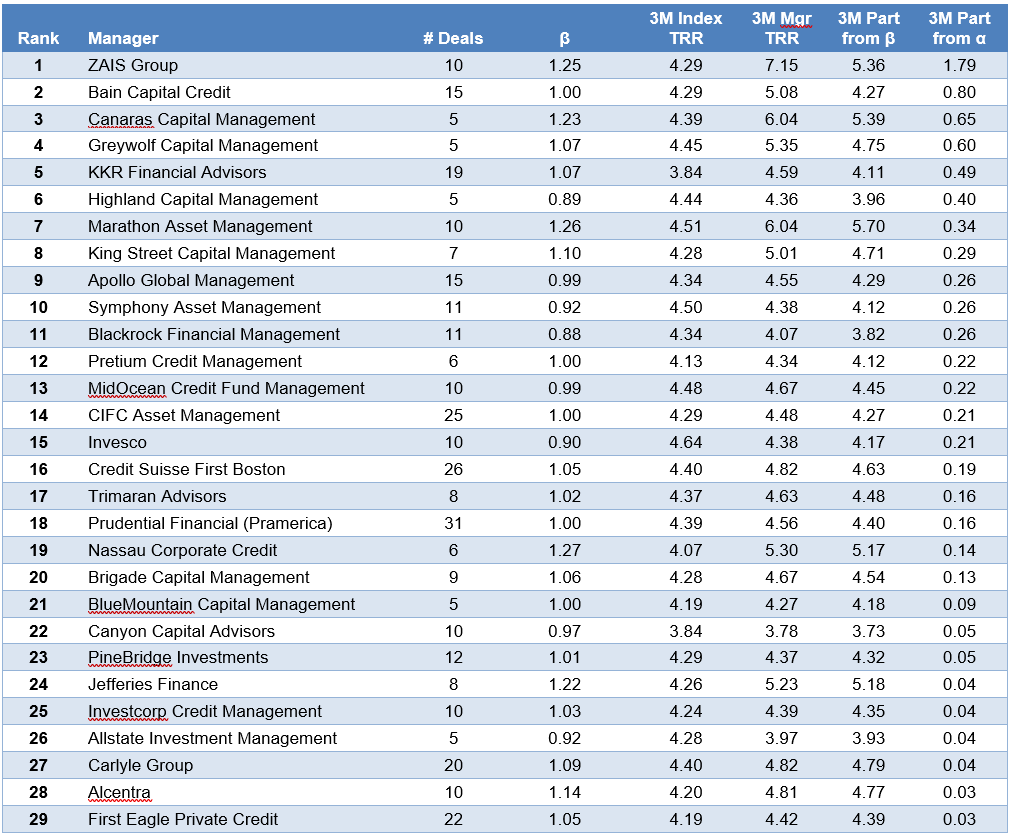
Note: Performance for managers with five or more deals tracked by APS. Performance attribution starts with calculated total return on the leveraged loan portfolio held in each CLO for the 3-month reporting period ending on the indicated date. CLOs, even with a single manager platform, may vary in reporting period. The analysis matches performance in each period to performance over the identical period in the S&P/LSTA Leveraged Loan Index. Where a deal has at least 18 months of performance history since pricing and no apparent errors in cash flow data, the analysis calculates a deal beta. The deal beta is multiplied by the index return to predict deal return attributable to broad market performance. Where no beta can be calculated, the analysis uses the average beta across each manager’s active deals weighted by the average deal principal balance over time. Any difference between performance attributable to beta and actual performance is attributed to manager alpha.
Source: Amherst Pierpont Securities.