By the Numbers
Historically tight spreads make relative value a challenge
This material is a Marketing Communication and does not constitute Independent Investment Research.
A confluence of factors have pushed most agency residential and commercial MBS spreads to historic tights. Spreads on current coupon TBA pass-throughs stand at a 35-year low, and sequential classes of standard Freddie Mac K-deals and 10/9.5 Fannie Mae DUS also price at new tights. More bespoke agency CMBS such as longer duration DUS pools and some ACES classes have lagged the move tighter and offer investors a little bit of extra yield.
The tailwinds in single-family and multifamily real estate are fairly broad. Fed QE has absorbed a material amount of supply in agency MBS and CMBS, as well as other markets, and broadly served as a backstop to spreads in risk assets. Heavy supply of Treasury debt has also helped tighten spreads. Fiscal stimulus has created an important safety net for parts of the economy, and vaccines have improved prospects for rebound from pandemic. In real estate specifically, single-family home prices continue to rise, multifamily rents—outside of urban core areas heavily affected by pandemic—are trending higher, and supply shortages in both sectors will likely persist for several more years.
The combination of these factors has tightened agency MBS and CMBS spreads to historic lows (Exhibits 1 and 2). Spreads in other fixed income products have been tightening as well. In private-label CMBS, broad measures of spreads are close to pre-pandemic lows, but the mix of property types in conduit deals include retail and lodging properties. Even the safest private-label ‘AAA’ securities have higher credit risk than agency CMBS.
Exhibit 1: Agency TBA nominal spread to Treasuries
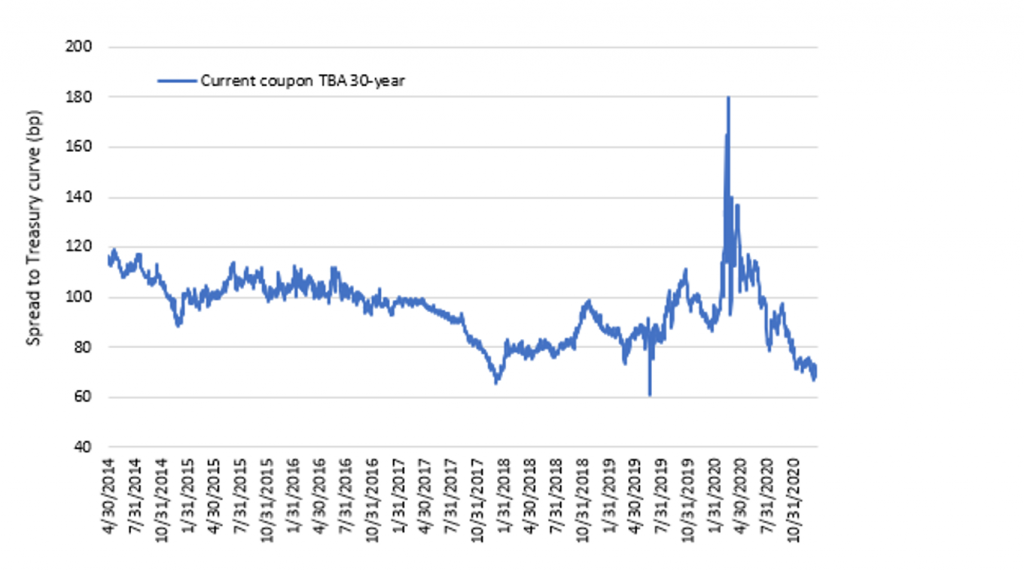
Note: The mortgage spread is the current coupon TBA yield (MTGEFNCL Index) versus a 50-50 blend of the on-the-run 5-year and 10-year Treasury yield.
Source: Bloomberg, Amherst Pierpont Securities
Exhibit 2: Agency CMBS and US CMBS Aaa-rated index option adjusted spreads (OAS)
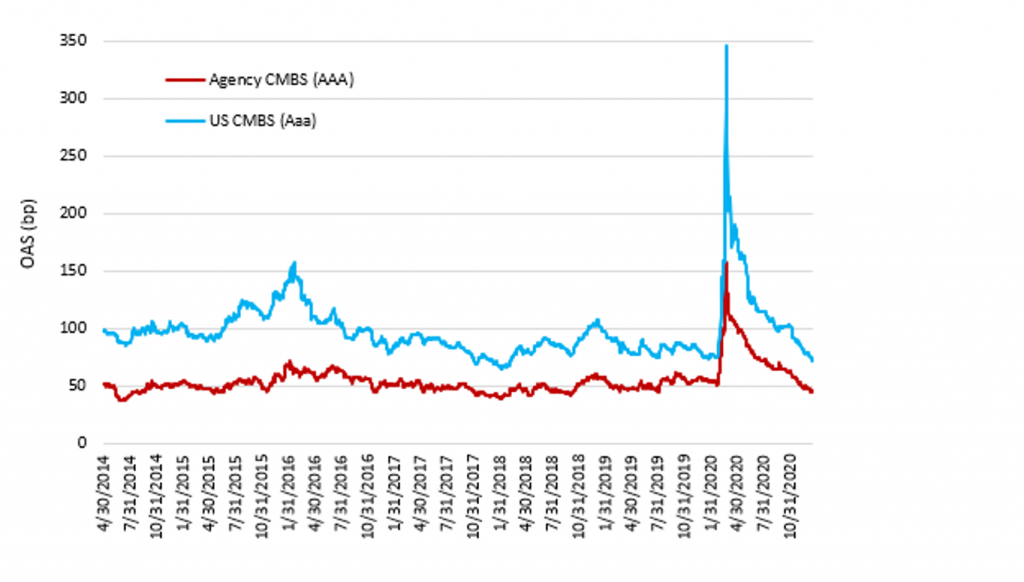
Source: Bloomberg, Amherst Pierpont Securities
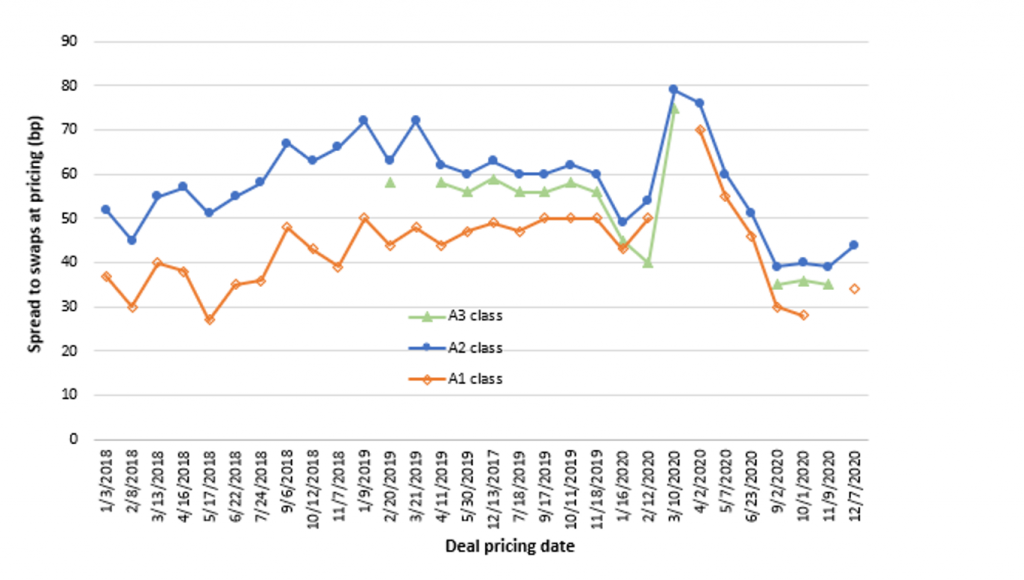
Robust demand for the benchmark of agency CMBS market depth and diversification – standard Freddie Mac K-deals – has contributed to a relentless collapse in spreads (Exhibit 3). The A1 class with the shortest weighted average life has recent deal spreads below 20 bp: the FHMS K123 A1 priced on January 21 at 18 bp. The larger, longer WAL A2 came at 21 bp and the A3 at 26 bp. All spreads were 8 bp through the early December levels of the K122 deal.
Exhibit 3: Freddie Mac K-deal class spreads at pricing
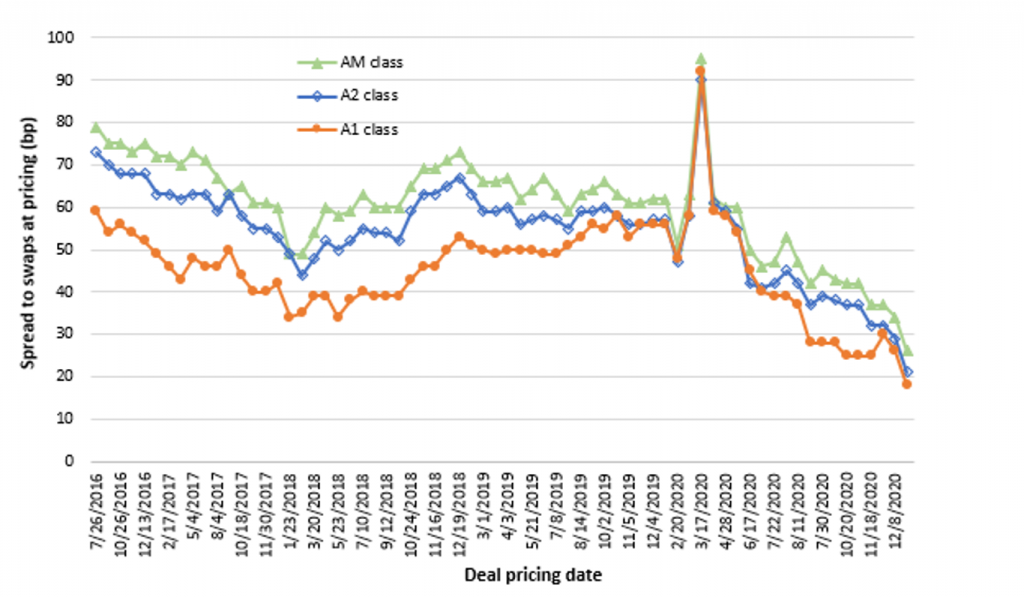
Note: Spreads are for standard K-deals only.
Source: Bloomberg, Freddie Mac, Amherst Pierpont Securities
Fannie Mae DUS pool spreads are also at historic lows, though they continue to trade back of similar WAL K-deal classes (Exhibit 4). The 10/9.5 pools in recent offerings have priced in the 25 bp to 27 bp range, with 12/11.5 at 33 bp and 15/14.5 at 41 bp.
Exhibit 4: Fannie Mae DUS pool spreads at pricing date
Note: Spreads are interpolated for classes between issuance dates. Source: Bloomberg, Fannie Mae, Amherst Pierpont Securities
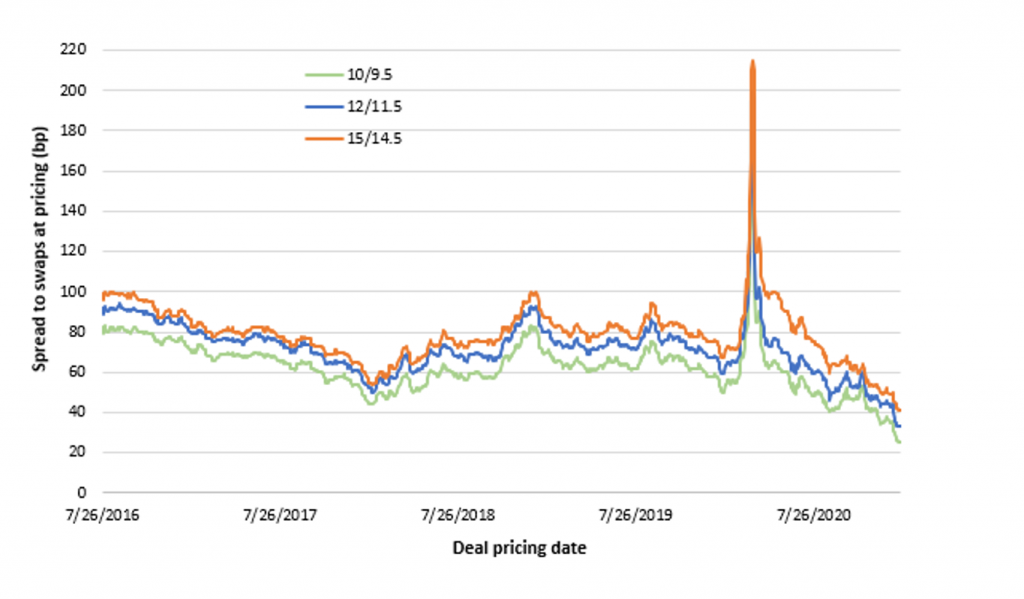
The spread difference between the 10/9.5 and the longer-duration pools had narrowed in the fourth quarter of last year, but has since widened back out somewhat (Exhibit 5). The potential for a more pronounced sell-off in the long-end of the Treasury curve may have tapered the duration appetite of some investors. Those willing to go out to 15/14.5 pools can pick up an additional 15 bp in yield, which is in-line with pre-pandemic levels.
Exhibit 5: Fannie Mae DUS 10/9.5 pool spreads vs 12/11.5 and 15/14.5
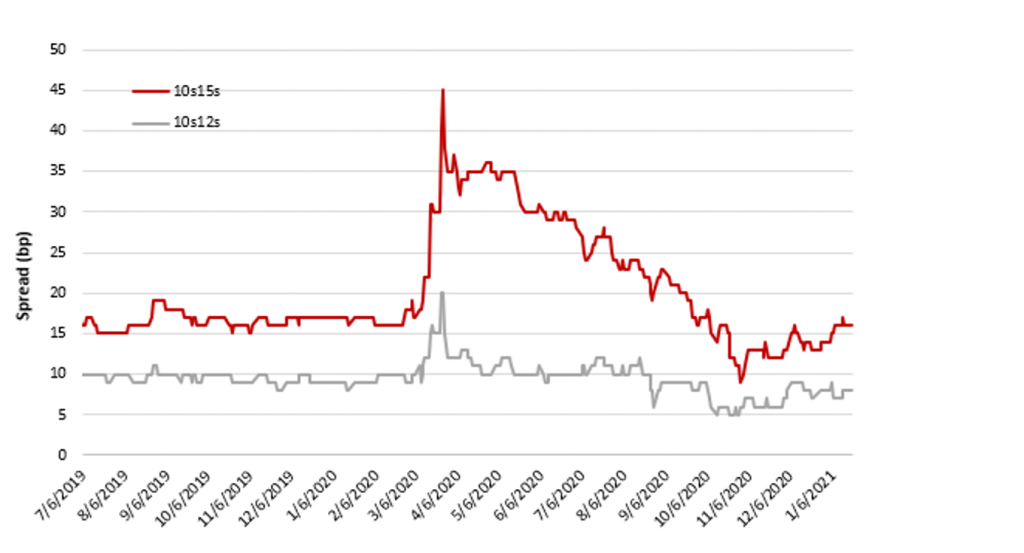
Source: Bloomberg, Fannie Mae, Amherst Pierpont Securities
There are other pockets of relative value in the agency CMBS new issue market. Fannie Mae ACES deal spreads have not compressed quite as much as those of DUS and K-deals based on early December spreads when the last large deal priced. Several deals are in the pipeline over the next few weeks, and new issue spreads will probably tighten but still look unlikely to reach the levels of comparable DUS issues. The A2 class of ACES deals looks similar to a collection of 10/9.5 DUS pools, with a similar WAL and comprising 65% to 85% of the deal. The A2s priced at 39 bp to 44 bp during the fourth quarter of 2020, or 5 bp to 8 bp wide of 10/9.5 DUS pools. The more idiosyncratic structures and less frequent issuance has made these deals a good pocket for investors who are willing to commit more time to capture additional yield.
Exhibit 6: Fannie Mae ACES deal class spreads at pricing
Note: Data only includes deals where spreads are tracked by Bloomberg. These tend to be larger sized ACES deals above $500 million in original face.
Source: Bloomberg, Fannie Mae, Amherst Pierpont Securities
This material is intended only for institutional investors and does not carry all of the independence and disclosure standards of retail debt research reports. In the preparation of this material, the author may have consulted or otherwise discussed the matters referenced herein with one or more of SCM’s trading desks, any of which may have accumulated or otherwise taken a position, long or short, in any of the financial instruments discussed in or related to this material. Further, SCM may act as a market maker or principal dealer and may have proprietary interests that differ or conflict with the recipient hereof, in connection with any financial instrument discussed in or related to this material.
This message, including any attachments or links contained herein, is subject to important disclaimers, conditions, and disclosures regarding Electronic Communications, which you can find at https://portfolio-strategy.apsec.com/sancap-disclaimers-and-disclosures.
Important Disclaimers
Copyright © 2026 Santander US Capital Markets LLC and its affiliates (“SCM”). All rights reserved. SCM is a member of FINRA and SIPC. This material is intended for limited distribution to institutions only and is not publicly available. Any unauthorized use or disclosure is prohibited.
In making this material available, SCM (i) is not providing any advice to the recipient, including, without limitation, any advice as to investment, legal, accounting, tax and financial matters, (ii) is not acting as an advisor or fiduciary in respect of the recipient, (iii) is not making any predictions or projections and (iv) intends that any recipient to which SCM has provided this material is an “institutional investor” (as defined under applicable law and regulation, including FINRA Rule 4512 and that this material will not be disseminated, in whole or part, to any third party by the recipient.
The author of this material is an economist, desk strategist or trader. In the preparation of this material, the author may have consulted or otherwise discussed the matters referenced herein with one or more of SCM’s trading desks, any of which may have accumulated or otherwise taken a position, long or short, in any of the financial instruments discussed in or related to this material. Further, SCM or any of its affiliates may act as a market maker or principal dealer and may have proprietary interests that differ or conflict with the recipient hereof, in connection with any financial instrument discussed in or related to this material.
This material (i) has been prepared for information purposes only and does not constitute a solicitation or an offer to buy or sell any securities, related investments or other financial instruments, (ii) is neither research, a “research report” as commonly understood under the securities laws and regulations promulgated thereunder nor the product of a research department, (iii) or parts thereof may have been obtained from various sources, the reliability of which has not been verified and cannot be guaranteed by SCM, (iv) should not be reproduced or disclosed to any other person, without SCM’s prior consent and (v) is not intended for distribution in any jurisdiction in which its distribution would be prohibited.
In connection with this material, SCM (i) makes no representation or warranties as to the appropriateness or reliance for use in any transaction or as to the permissibility or legality of any financial instrument in any jurisdiction, (ii) believes the information in this material to be reliable, has not independently verified such information and makes no representation, express or implied, with regard to the accuracy or completeness of such information, (iii) accepts no responsibility or liability as to any reliance placed, or investment decision made, on the basis of such information by the recipient and (iv) does not undertake, and disclaims any duty to undertake, to update or to revise the information contained in this material.
Unless otherwise stated, the views, opinions, forecasts, valuations, or estimates contained in this material are those solely of the author, as of the date of publication of this material, and are subject to change without notice. The recipient of this material should make an independent evaluation of this information and make such other investigations as the recipient considers necessary (including obtaining independent financial advice), before transacting in any financial market or instrument discussed in or related to this material.
Important disclaimers for clients in the EU and UK
This publication has been prepared by Trading Desk Strategists within the Sales and Trading functions of Santander US Capital Markets LLC (“SanCap”), the US registered broker-dealer of Santander Corporate & Investment Banking. This communication is distributed in the EEA by Banco Santander S.A., a credit institution registered in Spain and authorised and regulated by the Bank of Spain and the CNMV. Any EEA recipient of this communication that would like to affect any transaction in any security or issuer discussed herein should do so with Banco Santander S.A. or any of its affiliates (together “Santander”). This communication has been distributed in the UK by Banco Santander, S.A.’s London branch, authorised by the Bank of Spain and subject to regulatory oversight on certain matters by the Financial Conduct Authority (FCA) and the Prudential Regulation Authority (PRA).
The publication is intended for exclusive use for Professional Clients and Eligible Counterparties as defined by MiFID II and is not intended for use by retail customers or for any persons or entities in any jurisdictions or country where such distribution or use would be contrary to local law or regulation.
This material is not a product of Santander´s Research Team and does not constitute independent investment research. This is a marketing communication and may contain ¨investment recommendations¨ as defined by the Market Abuse Regulation 596/2014 ("MAR"). This publication has not been prepared in accordance with legal requirements designed to promote the independence of research and is not subject to any prohibition on dealing ahead of the dissemination of investment research. The author, date and time of the production of this publication are as indicated herein.
This publication does not constitute investment advice and may not be relied upon to form an investment decision, nor should it be construed as any offer to sell or issue or invitation to purchase, acquire or subscribe for any instruments referred herein. The publication has been prepared in good faith and based on information Santander considers reliable as of the date of publication, but Santander does not guarantee or represent, express or implied, that such information is accurate or complete. All estimates, forecasts and opinions are current as at the date of this publication and are subject to change without notice. Unless otherwise indicated, Santander does not intend to update this publication. The views and commentary in this publication may not be objective or independent of the interests of the Trading and Sales functions of Santander, who may be active participants in the markets, investments or strategies referred to herein and/or may receive compensation from investment banking and non-investment banking services from entities mentioned herein. Santander may trade as principal, make a market or hold positions in instruments (or related derivatives) and/or hold financial interest in entities discussed herein. Santander may provide market commentary or trading strategies to other clients or engage in transactions which may differ from views expressed herein. Santander may have acted upon the contents of this publication prior to you having received it.
This publication is intended for the exclusive use of the recipient and must not be reproduced, redistributed or transmitted, in whole or in part, without Santander’s consent. The recipient agrees to keep confidential at all times information contained herein.


