Uncategorized
Extracting upside to elevated prepayments in RPLs
This material is a Marketing Communication and does not constitute Independent Investment Research.
The structure of seasoned RPL transactions may play well this year in a market where spread tightening should be only a fraction of last year’s move. The return of principal sequentially to the most senior outstanding RPL class means the structure steadily deleverages, unlike pro-rata classes in non-QM structures or shifting interest classes in prime jumbo. But recent prepayment and delinquency performance across seasoned RPLs has been inconsistent. Investors should focus on attributes like relative amounts of forbearance and the population of loans with long current-pay strings to maximize potential deleveraging and spread tightening.
During the spring of last year delinquency rates in seasoned RPLs spiked and prepayment rates slowed as the pandemic affected borrowers across all sectors of mortgage credit. Borrower performance subsequently improved fairly materially and prepayment rates rose for the majority of the rest of the year. However, borrower performance in the sector took a downturn in the sector in December as prepayment rates broadly slowed and delinquency rates ticked up modestly (Exhibit 1). The change in the trajectory of both prepayment rates and credit performance last month illustrates the need for prudent asset selection in the sector as this downturn was not evident across all profiles.
Exhibit 1: Prepays slow and DQs rise in RPL collateral in December
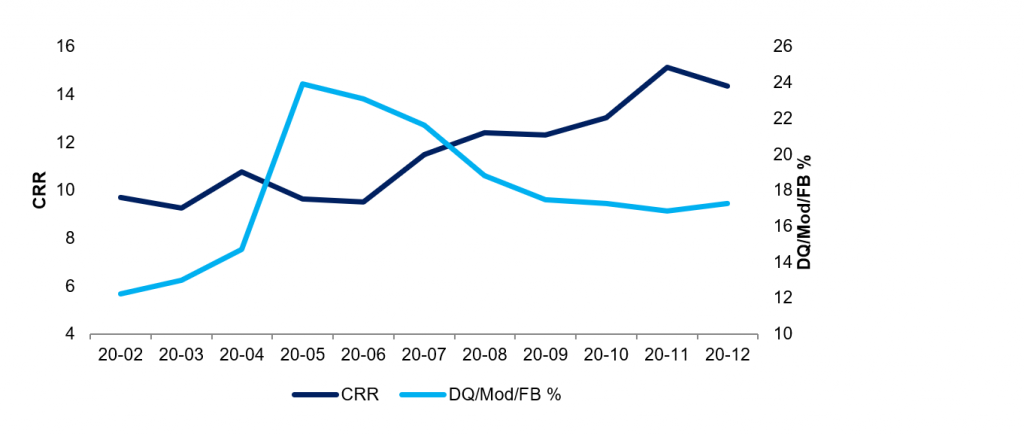
Source: CoreLogic, Amherst Pierpont Securities
Focusing the analysis on only major RPL issuers shows most are by and large performing better than the broader cohort. Focusing on four major shelves; BOFMT, MCMLT, NRZT and TPMT, shows delinquency rates in December for across these issuers was just under 10%, roughly seven points lower than that of the broader cohort (Exhibit 2). Overall delinquency rates nevertheless appear to be increasing at a faster pace as they have increased roughly 200 bp since September. Looking at shelf level performance, it appears the rise in delinquency rates has come largely from the NRZT shelf, where delinquency rates are not only substantially higher than those of other shelves but have risen in a more meaningful way in recent months.
Exhibit 2: Stacking up shelf level delinquencies in seasoned RPLs

Source: CoreLogic, Amherst Pierpont Securities Note: Analysis exclusive to 2017 and later vintage transactions exclusive of any non-performing loan securitizations by the sponsor
One likely reason for the divergence in performance across shelves is that the NRZT shelf often sources collateral by calling legacy structures to get the underlying loans. This is evident from NRZT delinquency rates substantially higher than the TPMT and MCMLT shelves prior to the delinquency surge in the spring. It is important to differentiate sequential-pay deals where the collateral is generally sourced from the GSEs or bank portfolios versus shifting interest deals where the collateral is sourced from legacy trusts. Legacy collateral continues to show elevated levels of new delinquencies particularly in the subprime and Option ARM cohorts.
Forbearance matters
Another consideration when it comes to seasoned RPL transactions is the amount of forbearance securitized, which will vary from trust to trust. Somewhat different from most legacy deals, outstanding principal forbearance on modified loans is securitized in the balance of RPL trusts. Loans with forbearance attached to them are by definition more highly modified, assuming a traditional HAMP modification waterfall where the borrower’s rate and term has already been modified prior to the extension of a balance modification, than those where the borrower is modified without the extension of a forbearance modification. Forborne principal also reduces the WAC on the borrower’s loan as the effective WAC is the weighted average of the note rate on the performing balance of the loan and zero on the non-performing forbearance. As such, pools with higher amounts of securitized forbearance may not only be collateralized by borrowers with weaker credits but also those with less incentive to refinance their loans, potentially leading to both higher delinquency rates and slower prepayments.
Looking across the universe of seasoned RPLs, deals issued in 2018 and early 2019 have by far the largest concentrations of securitized forbearance. Comparing trusts with large amounts of securitized forbearance to those without show a sizable difference in their average 6-month prepayment rate as trusts with low amounts of forbearance prepay roughly twice as fast as those with larger concentrations However, it’s important to weigh other collateral considerations when thinking about prepayment rates. For example, hybrid ARM and second lien collateral has exhibited faster prepayment rates than fixed-rate loans historically and investors should be cognizant of these attributes when thinking about upside to faster prepayments and subsequent deleveraging. (Exhibit 3)
Exhibit 3: Large amounts of securitized forbearance can weigh on prepayments

Source: CoreLogic, Intex, Amherst Pierpont Securities
One additional wrinkle when thinking about forbearance in RPL deals is not only the amount of forbearance securitized at issuance but additional forbearance that has subsequently accrued to these trusts. In recent months, as delinquency rates rose, servicers have, in some cases, capitalized and deferred the borrowers’ arrearages generating a loss to the trust and reducing credit enhancement. This ‘new’ forbearance may not flow back to the trust in the same manner, or at the same rate of recovery as securitized forbearance since it has been recently granted and may take longer to recoup than existing forbearance.
Payment velocity matters, too
One additional consideration when thinking about upside to deleveraging through prepayments is the population of loans that have shown strong payment strings over a longer observation period. Larger populations of loans that have not missed a payment in two years obviously should be consistent with lower delinquency rates. And there are other considerations to take into account such as WAC and effective WAC net of forbearance when thinking about leverage to pools that exhibit strong payment velocity. Investors also need to be aware of potential differences in the reporting of borrowers pay strings across different shelves and issuers. It nevertheless appears that deals with larger concentrations of borrowers with better payment velocity should prepay faster than those without. Looking across the same universe of trusts, deals with higher concentrations of loans that were clean pay for two years exhibited faster prepayment rates than those without. Once again, faster paying deals include hybrid ARM and second lien collateral but it appears one driver of faster speeds in these deals are the outsized populations of loans with strong payment histories (Exhibit 4).
Exhibit 4: Larger populations of 24-month current pay loans drive faster speeds
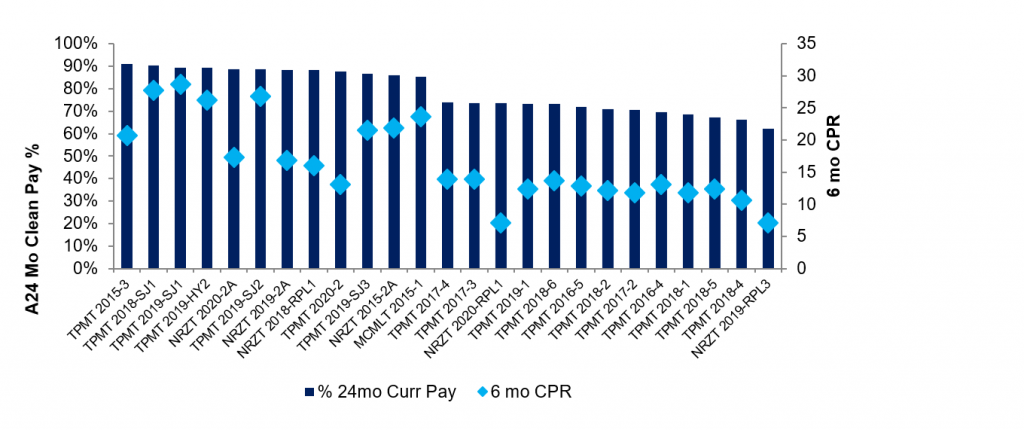
Source: CoreLogic, Intex, the issuers, Amherst Pierpont Securities
This material is intended only for institutional investors and does not carry all of the independence and disclosure standards of retail debt research reports. In the preparation of this material, the author may have consulted or otherwise discussed the matters referenced herein with one or more of SCM’s trading desks, any of which may have accumulated or otherwise taken a position, long or short, in any of the financial instruments discussed in or related to this material. Further, SCM may act as a market maker or principal dealer and may have proprietary interests that differ or conflict with the recipient hereof, in connection with any financial instrument discussed in or related to this material.
This message, including any attachments or links contained herein, is subject to important disclaimers, conditions, and disclosures regarding Electronic Communications, which you can find at https://portfolio-strategy.apsec.com/sancap-disclaimers-and-disclosures.
Important Disclaimers
Copyright © 2026 Santander US Capital Markets LLC and its affiliates (“SCM”). All rights reserved. SCM is a member of FINRA and SIPC. This material is intended for limited distribution to institutions only and is not publicly available. Any unauthorized use or disclosure is prohibited.
In making this material available, SCM (i) is not providing any advice to the recipient, including, without limitation, any advice as to investment, legal, accounting, tax and financial matters, (ii) is not acting as an advisor or fiduciary in respect of the recipient, (iii) is not making any predictions or projections and (iv) intends that any recipient to which SCM has provided this material is an “institutional investor” (as defined under applicable law and regulation, including FINRA Rule 4512 and that this material will not be disseminated, in whole or part, to any third party by the recipient.
The author of this material is an economist, desk strategist or trader. In the preparation of this material, the author may have consulted or otherwise discussed the matters referenced herein with one or more of SCM’s trading desks, any of which may have accumulated or otherwise taken a position, long or short, in any of the financial instruments discussed in or related to this material. Further, SCM or any of its affiliates may act as a market maker or principal dealer and may have proprietary interests that differ or conflict with the recipient hereof, in connection with any financial instrument discussed in or related to this material.
This material (i) has been prepared for information purposes only and does not constitute a solicitation or an offer to buy or sell any securities, related investments or other financial instruments, (ii) is neither research, a “research report” as commonly understood under the securities laws and regulations promulgated thereunder nor the product of a research department, (iii) or parts thereof may have been obtained from various sources, the reliability of which has not been verified and cannot be guaranteed by SCM, (iv) should not be reproduced or disclosed to any other person, without SCM’s prior consent and (v) is not intended for distribution in any jurisdiction in which its distribution would be prohibited.
In connection with this material, SCM (i) makes no representation or warranties as to the appropriateness or reliance for use in any transaction or as to the permissibility or legality of any financial instrument in any jurisdiction, (ii) believes the information in this material to be reliable, has not independently verified such information and makes no representation, express or implied, with regard to the accuracy or completeness of such information, (iii) accepts no responsibility or liability as to any reliance placed, or investment decision made, on the basis of such information by the recipient and (iv) does not undertake, and disclaims any duty to undertake, to update or to revise the information contained in this material.
Unless otherwise stated, the views, opinions, forecasts, valuations, or estimates contained in this material are those solely of the author, as of the date of publication of this material, and are subject to change without notice. The recipient of this material should make an independent evaluation of this information and make such other investigations as the recipient considers necessary (including obtaining independent financial advice), before transacting in any financial market or instrument discussed in or related to this material.
Important disclaimers for clients in the EU and UK
This publication has been prepared by Trading Desk Strategists within the Sales and Trading functions of Santander US Capital Markets LLC (“SanCap”), the US registered broker-dealer of Santander Corporate & Investment Banking. This communication is distributed in the EEA by Banco Santander S.A., a credit institution registered in Spain and authorised and regulated by the Bank of Spain and the CNMV. Any EEA recipient of this communication that would like to affect any transaction in any security or issuer discussed herein should do so with Banco Santander S.A. or any of its affiliates (together “Santander”). This communication has been distributed in the UK by Banco Santander, S.A.’s London branch, authorised by the Bank of Spain and subject to regulatory oversight on certain matters by the Financial Conduct Authority (FCA) and the Prudential Regulation Authority (PRA).
The publication is intended for exclusive use for Professional Clients and Eligible Counterparties as defined by MiFID II and is not intended for use by retail customers or for any persons or entities in any jurisdictions or country where such distribution or use would be contrary to local law or regulation.
This material is not a product of Santander´s Research Team and does not constitute independent investment research. This is a marketing communication and may contain ¨investment recommendations¨ as defined by the Market Abuse Regulation 596/2014 ("MAR"). This publication has not been prepared in accordance with legal requirements designed to promote the independence of research and is not subject to any prohibition on dealing ahead of the dissemination of investment research. The author, date and time of the production of this publication are as indicated herein.
This publication does not constitute investment advice and may not be relied upon to form an investment decision, nor should it be construed as any offer to sell or issue or invitation to purchase, acquire or subscribe for any instruments referred herein. The publication has been prepared in good faith and based on information Santander considers reliable as of the date of publication, but Santander does not guarantee or represent, express or implied, that such information is accurate or complete. All estimates, forecasts and opinions are current as at the date of this publication and are subject to change without notice. Unless otherwise indicated, Santander does not intend to update this publication. The views and commentary in this publication may not be objective or independent of the interests of the Trading and Sales functions of Santander, who may be active participants in the markets, investments or strategies referred to herein and/or may receive compensation from investment banking and non-investment banking services from entities mentioned herein. Santander may trade as principal, make a market or hold positions in instruments (or related derivatives) and/or hold financial interest in entities discussed herein. Santander may provide market commentary or trading strategies to other clients or engage in transactions which may differ from views expressed herein. Santander may have acted upon the contents of this publication prior to you having received it.
This publication is intended for the exclusive use of the recipient and must not be reproduced, redistributed or transmitted, in whole or in part, without Santander’s consent. The recipient agrees to keep confidential at all times information contained herein.


