


By the Numbers
Stacking up servicer response to delinquent loans
Chris Helwig | January 8, 2021
This material is a Marketing Communication and does not constitute Independent Investment Research.
As improvements in borrower performance have stalled across most sectors of mortgage credit, a more nuanced view of servicer response to delinquency has become more valuable. Continued elevated delinquencies suggest that forbearance plans common to private-label borrowers are being extended. It is important to know which servicers are more proactive in their efforts to get borrowers to begin making payments again.
Delinquency rates remain elevated in December
The December remittance cycle brought another month of elevated delinquencies across most sectors of mortgage credit. Most sectors have plateaued well above pre-pandemic levels and the non-QM sector remains the only outlier where delinquency rates continue to fall (Exhibit 1). Seasoned RPLs even saw total delinquency rates increase slightly in December, rising roughly 50 bp higher than the November observation.
Exhibit 1: Delinquencies holding steady across most sectors of mortgage credit
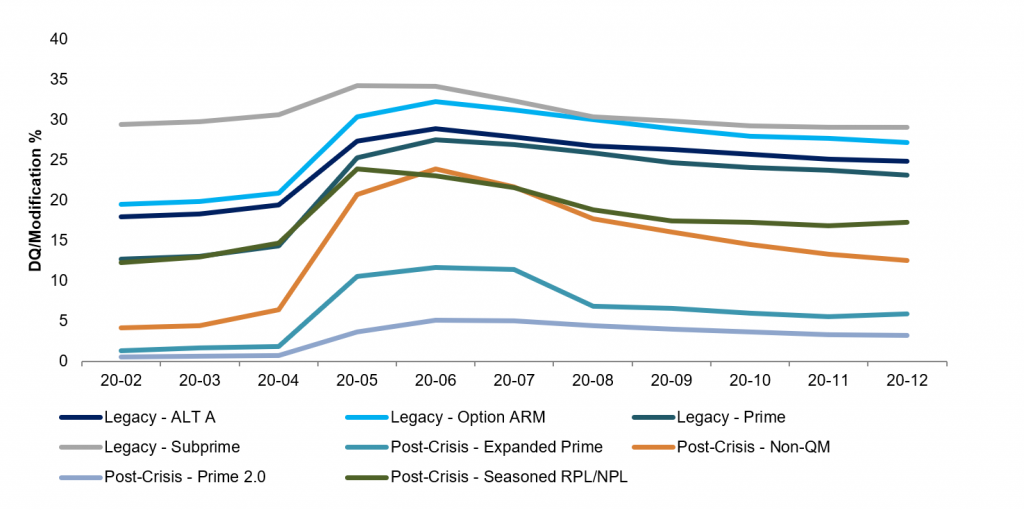
Source: CoreLogic, Amherst Pierpont Securities
Elevated levels of total delinquency can come from the same population of borrowers rolling to later stage delinquency or some portion of those borrowers curing and new borrowers rolling from current to an early-stage delinquency. Given this, any analysis of borrower and servicer behavior must take both of these phenomena into account. By and large, investors should take a more constructive view on higher-touch servicers that are exhibiting the ability to re-perform borrowers coming out of forbearance irrespective of whether new borrowers are rolling into early-stage delinquencies.
Sizing up cure rates across different mortgage credits and servicers
There are a number of ways to look at servicer response to current delinquency pipelines, but one simplified approach looks at transition rates on loans seriously delinquent in November and tracks their December status. Ostensibly, an improvement in the delinquency status of borrowers would signal that servicers are working with these borrowers to get them back to current or at a minimum to begin to get them back to making some payment that would bring them less delinquent.
This 1-month transition observation admittedly has a material drawback in that it may not sync up with the end of borrowers’ forbearance plans. These plans in private-label MBS tend to be three months in duration. However, based on conversations with certain ‘higher-touch’ private-label servicers, it appears that efforts are made to re-perform borrowers even during the terms of their forbearance periods. Given this, these timing mismatches may not be a completely binding constraint to borrowers exhibiting some form of payment velocity.
Given that the non-QM sector continues to exhibit steadily improving borrower performance, it likely makes sense to start the analysis there. An analysis of major non-QM servicer shows that on average roughly 84% of loans that were 90 days or more past due in November remained so in December. Roughly 7% of those borrowers rolled back to current, an additional 4% rolled to an earlier stage delinquency and 5% rolled to more than 90 days delinquent, into foreclosure or REO or prepaid. However, some servicers exhibited better than average performance. Two servicers that stood out in the non-QM sector were Caliber and Shellpoint, who both saw 13% of previously seriously delinquent borrowers return to current pay status. Caliber services the COLT non-QM shelf exclusively while Shellpoint services loans in NRZT non-QM deals as well as others. One concern when seeing loans roll from late stage delinquency to current is whether the servicer capitalized the borrowers’ arrearages, which may result in a loss to the trusts. However, this does not to be occurring be occurring at all on Caliber serviced non-QM loans and only amounted 10 bp of UPB on Shellpoint serviced loans.
Somewhat surprisingly, large servicers of post-crisis prime credits saw roughly the same percentage of loans roll back to current from serious delinquency as the broad non-QM cohort. JPMorgan and Wells Fargo saw roughly 7% of serious delinquencies roll back to current in December. Other servicers saw much more marked improvement in roll rates, albeit on smaller populations of loans. First Republic serviced loans exhibited the strongest performance as roughly 75% of previous serious delinquencies cured in December. Both Nationstar and Provident serviced loans exhibited elevated cure rates at 32% and 23% respectively without any capitalization modifications.
Turning to the seasoned RPL sector, the two largest servicers of post-crisis seasoned RPLs, SPS and SLS both saw 6% of serious delinquencies roll to back to current pay without using any capitalization modifications that created trust losses in December. Ocwen and Nationstar, which by and large service called legacy loans that are re-securitized in the NRZT shelf, saw modestly better borrower performance. Across Ocwen serviced loans, 9% rolled from seriously delinquent while an additional 3% of borrowers rolled to either 30 days or 60 days past due. However, Ocwen still maintains elevated rates of capitalization modifications which are the likely primary driver of elevated cure rates. And these modifications are generating losses as borrowers’ arrearages are capitalized, creating pools of forbearance due to bondholders if and when those arrearages are recouped in the future.
Given the combination of both nominally higher delinquency rates and longer timelines in the legacy sector, cure rates across legacy credits are generally depressed irrespective of servicer. Similar to the seasoned RPL sector, Ocwen generally employs capitalization modifications with greater frequency than other servicers. Total delinquency rates across Ocwen serviced subprime legacy loans were just over 31% in December. Of those delinquent balances, over 14% received a capitalization modification that did not generate a loss, while an additional 2% received a capitalization modification that did generate a loss.
A look at new delinquencies
Despite evidence of borrowers exiting forbearance in December, delinquency rates across most sectors of mortgage credit remained elevated as a result of previously current borrowers replacing those re-performing ones in the delinquency pipeline. Legacy subprime saw the largest percentage of borrowers roll from current to an early-stage delinquency in December as 3.5% of previously delinquent borrowers rolled to 30 days past due. Ostensibly, real roll rates may even be higher than the 3.5% actually reported as delinquent; capitalization modifications employed by Ocwen or other servicers would keep this number depressed as those borrowers would still be marked as current. Other sectors that experienced elevated levels of new delinquencies were the legacy Option ARM and seasoned RPL corners of the market at 2.7% and 2.6% respectively. When thinking about transition rates, a relatively small percentage of new delinquencies can be more meaningful than larger percentages of loans rolling out of delinquency. On this later set of loans, the percentages are a function the prior month’s observed balance. But all of these cohorts have substantially larger populations of previously current pay loans than delinquent ones.
Larger populations of loans rolling to delinquency in the legacy subprime and option ARM cohorts should serve to keep prepayments slow in those corners of the market and should benefit IO profiles that will benefit from these slower speeds. Deals wilt larger population of delinquent loans in judicial states should experience an outsized benefit from this phenomenon given longer timelines to liquidation. The recent uptick in new delinquencies in the seasoned RPL market should drive investors to be more selective in terms of deals with cleaner collateral profiles exhibiting less incidence of modification and lower amounts of securitized forbearance that should prepay and deleverage faster than others.